Week-11 Challenge: Braking
Que-1)
For a defined driving cycle, calculate the energy required for braking.
The total weight of vehicle is taken as 800kg
The derive cycle is generated using time and velocity data
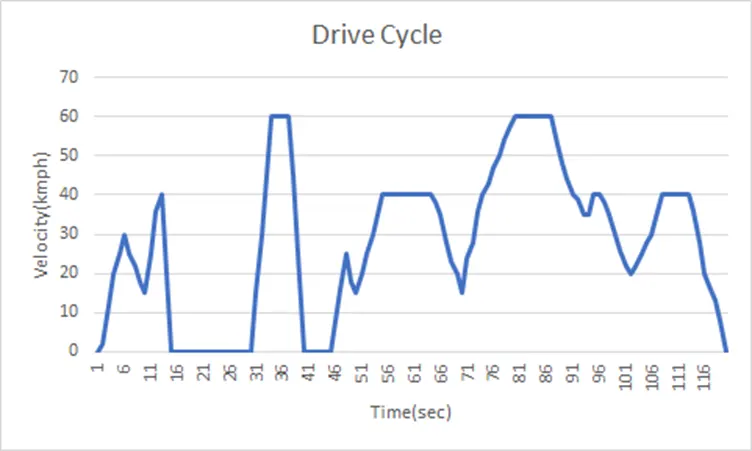
From this only deceleration i.e.,Breaking is saparated
| Deceleration | |||||
| Time(sec) | Speed(KMPH) | ||||
| t1 | t2 | t2-t1 | v1 | v1 | v1-v2 |
| 6 | 10 | 4 | 30 | 15 | 15 |
| 13 | 14 | 1 | 40 | 20 | 20 |
| 37 | 39 | 2 | 60 | 0 | 60 |
| 48 | 50 | 2 | 25 | 15 | 10 |
| 64 | 70 | 6 | 40 | 15 | 25 |
| 87 | 94 | 7 | 60 | 35 | 25 |
| 96 | 102 | 6 | 40 | 20 | 20 |
| 113 | 120 | 7 | 40 | 0 | 40 |
By using this data the Power Requied for braking is calculated
`P = m*1.5*((v*(5/18))^2)/(2*t*3600)`
where, m = total weight of the vehicle
v = final velocity
t = time
The power is calculated for every deceleration period. This drive cycle contains 8 deceleration periods. The toatal power(P) is the sum of all the individual deceleration powers and the total time(T) is tha sum of the all the deceleration period time
| Deceleration calculation | ||||
| Final speed | Deceleration time | Deceleration(m/s2) | Deceleration force(N) | Deceleration Power(KW) |
| 15 | 4 | 3.75 | 3000 | 2.604166667 |
| 20 | 1 | 20 | 16000 | 18.51851852 |
| 60 | 2 | 30 | 24000 | 83.33333333 |
| 10 | 2 | 5 | 4000 | 2.314814815 |
| 25 | 6 | 4.166666667 | 3333.333333 | 4.822530864 |
| 25 | 7 | 3.571428571 | 2857.142857 | 4.133597884 |
| 20 | 6 | 3.333333333 | 2666.666667 | 3.086419753 |
| 40 | 7 | 5.714285714 | 4571.428571 | 10.58201058 |
| total deceleration time | 35 | total Power for braking | 129.3953924 | |
Form this total energy required for breaking is calculated by
Breaking Energy =`P*T/3600`
where, P =total deceleration power
T = total time
Total Energy required for Breaking (KWh) = 1.25801076 KWh
This indicates that for total breaking period of 35 sec the Energy requied is 1.25 KWh
Que-2)
Why electric motor can’t develop braking torque at high speed similar to starting? How electric and mechanical brakes are coordinated?
As we know that torque and Speed are inversily praportional to eachother. If speed is increases the torque is decreased and vice versa. According to the torque speed charectaristics at staring the speed of the motor is low so the starting torque is concedered and it is high, this is for acceleration of the motor. But when the motor is at running at rated speed which is high the running torque is low. when we want to brake the motor at high spped by reversing the torque i.e., as the speed at that instant is high so the reverse torque is low. This indicates that the torque generated for acceleration is high compared to torque generated for breaking. So the Electric motor cannot develop the braking torque similar to staring.
Below charectaristics of motor with Constant torque and increasing power is mainating upto rated speed and after that constant power and decreasing torque is amintaing. During starting the speed is low and the torque is high after the motor reaches the above rated speed the torque no longer constant.at high speed i.e., above rated speed the troque is low comparted to starting. So that electric motor can’t develop braking torque at high speed similar to starting.
How electric and mechanical brakes are coordinated?
There are 2 stratagies for baraking of Electric vehicle.
- Series
- Parallel
Series method:
In this method first the Regenerative braking is applied and if the regenerative braking is not enough for vehicle to stop than the mechanical braking is applied. Like this one after the other first the regenerative braking than the mechanical braking is applied according to the requirment.
Parallel method:
In this method both Regenerative and Mechanical braking are used at a time. How much Energy should be used by each are decided by the designer.
Let us consider an example of a vehicle as shoen below
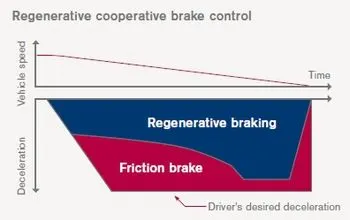
In this we can observe that at low speed Regenerative braking is used and at high speed both Regenerative and Mechanical breaking is used.
Que-3)
Make a MATLAB program which plots contour of given motor speed, torque and efficiency values. Attach the code as a .m file attach a screenshot of all the plots.
Matlab code:
w = linspace(1,1000); %creating the speed values between 1 to 1000 with 100 values
T = linspace(1,250);%creating the Torque values between 1 to 250 with 100 values
Kc = 0.2; % copper loss constant
Ki = 0.008; %iron loss constant
Kw = 0.00001; %rotation loss constant
ConL = 25; % constant motor loss
[w,T] = meshgrid(w,T);
OP = (w.*T); % Output power = Speed * Torque
A = (T.^2)*Kc; % copper loss
B = w*Ki; %iron loss
C = (w.^3)*Kw; %rotation loss
IP = OP+A+B+C+ConL; % Input power = output power* total losses
Z = OP./IP; % efficency = output / Input
V = [0.7 0.8 0.85 0.9 0.925 0.95 0.975 ]; %set uping the efficiecy values for which the contour will plot
contour(w,T,Z,V); % creating the contour
xlabel('speed(rad/sec)');
ylabel('Torque(N.m)');
title('contour of speed,torque and efficiency');
Output Contour:
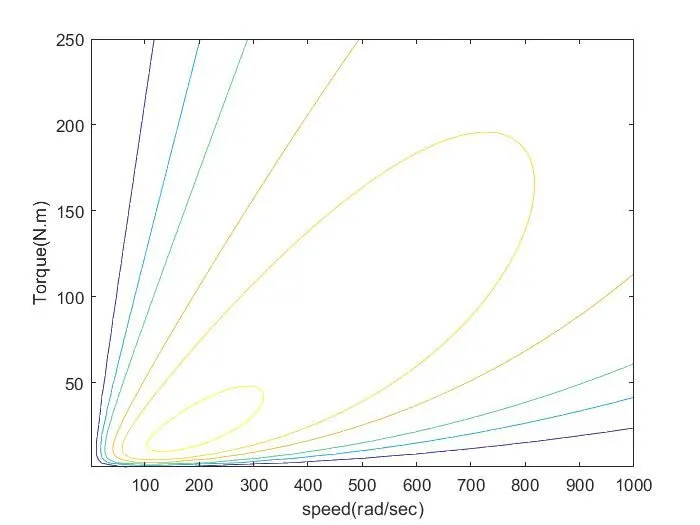
The graph shows the Torque speed characteristics of different efficiences as given in code i.e., 0.7,0.8,0.85,0.9,0.925,0.95 and 0.975. The inner most contour refers to highest efficiency.