Week-11 Challenge: Braking
- For a defined driving cycle, calculate the energy required for braking.
- Why electric motor can’t develop braking torque at high speed similar to starting? How electric and mechanical brakes are coordinated?
- Make a MATLAB program which plots contour of given motor speed, torque and efficiency values. Attach the code as a .m file attach a screenshot of all the plots.
1.
Driving cycle:
A driving cycle is a series of data points representing the speed of a vehicle versus time.
Driving cycles are produced by different countries and organizations to assess the performance of vehicles in various ways, as for instance fuel consumption, electric vehicle autonomy and polluting emissions.
Fuel consumption and emission tests are performed on chassis dynamometers Tailpipe emissions are collected and measured to indicate the performance of the vehicle.
Another use for driving cycles is in vehicle simulations. More specifically, they are used in propulsion system simulations to predict performance of internal combustion engines, transmissions, electric drive systems, batteries, fuel cell systems, and similar components.
Some driving cycles are derived theoretically, as it is preferred in the European Union, whereas others are direct measurements of a driving pattern deemed representative.
The "Drive-cycle" basically is the representative of the road. Drive cycles are used to reduce the expense of on road tests, time of test and fatigue of the test engineer. The whole idea is to bring the road to the test lab (a chassis dynamo-meter) or to the computer simulation.
Calculating energy required for braking by using excel calculator.
Firstly, a drive cycle is created on my own values with time in seconds and velocity in m/sec.
The Mass of the vehicle is taken as 1100 kg.
Then the energy was calculated in Joules.
Here we required the power in Kwh, so the energy is converted from Joules to Kwh by using the below formulae.
`Energy (KWH) =(Energy (joules))/(1000*3600)`
The excel calculator is shown below
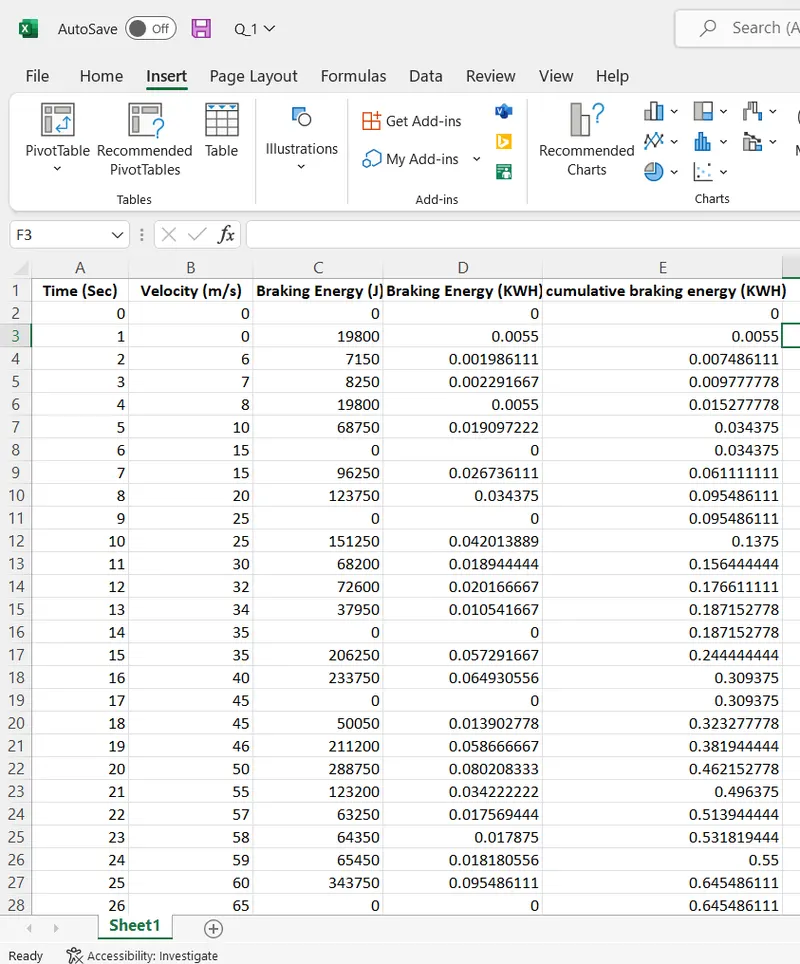
The plot between the cumulative braking energy,braking energy and velocity is shown below figure.
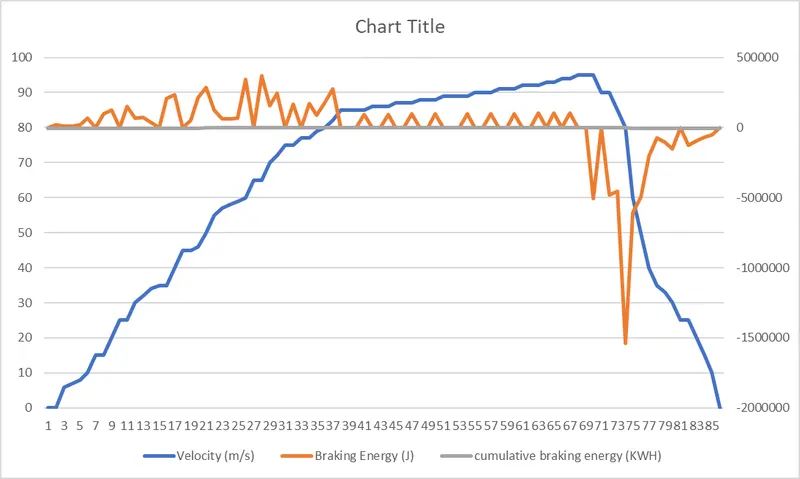
as we see from the above figure as there is a change in the velocity the braking energy required is changed
if the velocity value is decreased very high at that period the braking energy required is high.
2.
Electric motor can't develop braking torque at high speed similar to starting, because. Braking torque is applied in the opposite direction of the rotation.
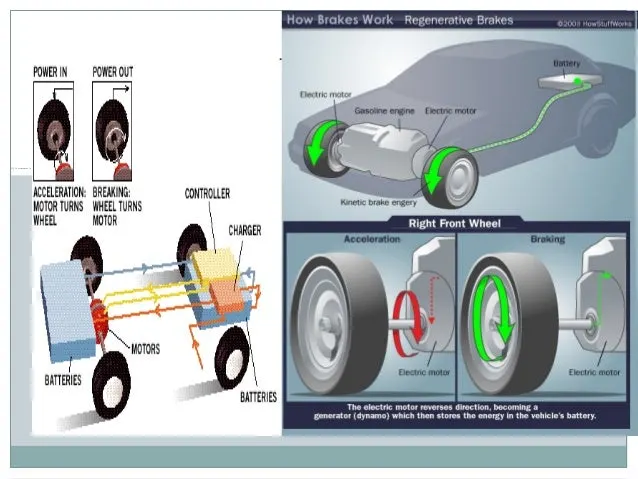
Regenerative braking is used in vehicles that make use of electric motors, primarily fully electric vehicles and hybrid electric vehicles. One of the more interesting properties of an electric motor is that, when it's run in one direction, it converts electrical energy into mechanical energy that can be used to perform work (such as turning the wheels of a car), but when the motor is run in the opposite direction, a properly designed motor becomes an electric generator, converting mechanical energy into electrical energy. This electrical energy can then be fed into a charging system for the car's batteries.
In a regenerative braking system, the trick to getting the motor to run backwards is to use the vehicle's momentum as the mechanical energy that puts the motor into reverse. Momentum is the property that keeps the vehicle moving forward once it's been brought up to speed. Once the motor has been reversed, the electricity generated by the motor is fed back into the batteries, where it can be used to accelerate the car again after it stops. Sophisticated electronic circuitry is necessary to decide when the motor should reverse, while specialized electric circuits route the electricity generated by the motor into the vehicle's batteries. In some cases, the energy produced by these types of brakes is stored in a series of capacitors for later use. In addition, since vehicles using these kinds of brakes also have a standard friction braking system, the vehicle's electronics must decide which braking system is appropriate at which time. Because so much is controlled electronically in a regenerative braking system, it's even possible for the driver to select certain presets that determine how the vehicle reacts in different situations. For instance, in some vehicles a driver can select whether regenerative braking should begin immediately whenever the driver's foot comes off the accelerator pedal and whether the braking system will take the car all the way to 0 mph (0 kilometers per hour) or will let the car coast slightly.
There's a general movement in the automotive industry toward so-called brake-by-wire systems where many of the functions of brakes that have traditionally been performed mechanically will be performed electronically. Hybrids and electric cars will probably be early adopters of these brake types. At present, different automotive engineers have come up with differing circuit designs to handle the complexities of regenerative braking; however, in all cases, the single most important part of the braking circuitry is the braking controller.
Coordination Control Strategy for Mode Switch:
According to whether or not the hydraulic braking system is involved in braking, the braking mode-switch type is divided into two categories. Braking mode-switch coordination control strategies are developed for the different braking mode-switch types.
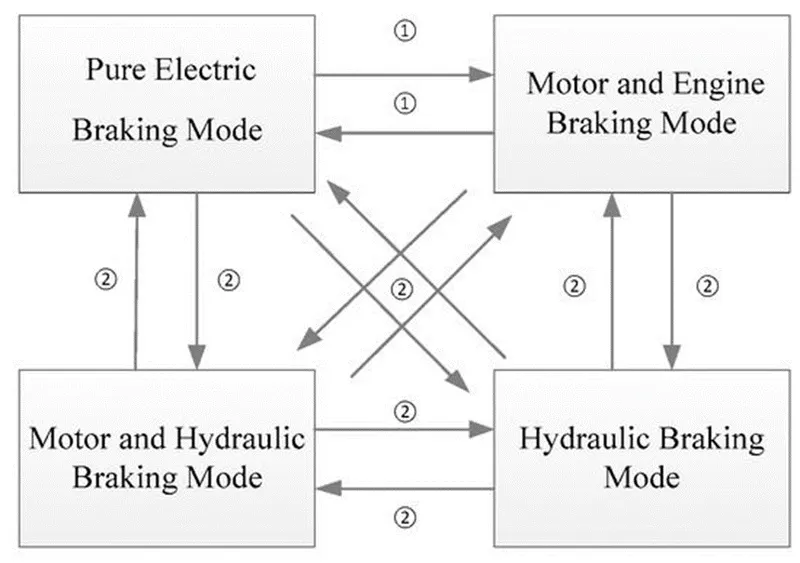
(1) Type one: braking mode switch without hydraulic braking system participation. In this type of mode switching, it is necessary to control the engagement of the clutch and the change rate of the motor torque. Thus, the fluctuation caused by the mode switch can be reduced.
(2) Type two: braking mode switch with hydraulic braking system participation. Due to the different dynamic response characteristics of the motor and the hydraulic braking systems, this switch mode is difficult to coordinate. The idea of coordinating control is to take full advantage of the characteristics of the braking systems. The hydraulic system can provide large and stable torque, and the motor braking system’s torque response is quick and accurate, reducing the fluctuation of the vehicle.
The overall coordination control flow chart is shown in the figure. Tbm_req, Tbh_req, and TbICE_req are the target motor, hydraulic, and engine braking torques allocated by the braking force control strategy.
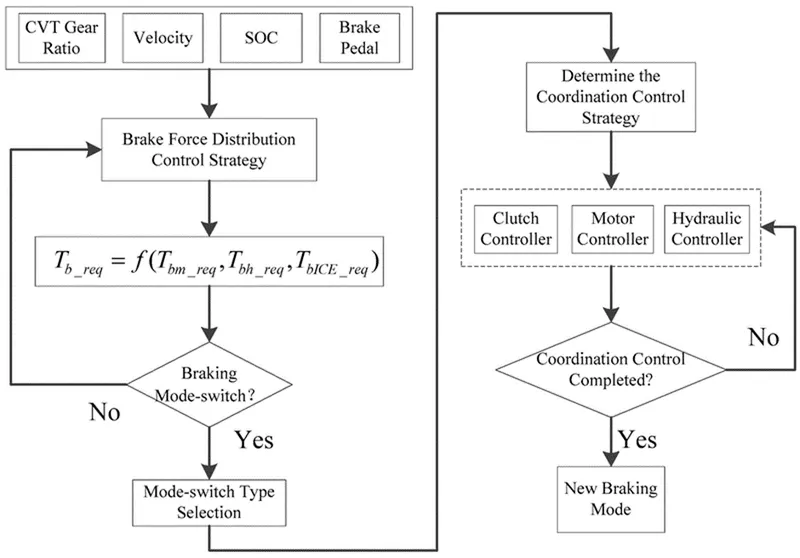
Flow chart of overall coordination control.
First, according to current speed, SOC, CVT ratio, and brake pedal, the braking force distribution control strategy allocates the target motor, hydraulic, and engine braking torques; then, according to the braking mode boundary conditions the vehicle controller determines whether the braking mode should switch or not. If mode switching happens, the vehicle controller determines the type of mode switch and then selects the corresponding coordination control strategy and controls the clutch, motor, and hydraulic torques to reduce the mode switch fluctuation. Finally, the vehicle controller determines whether the coordination control is completed, and if it is completed, the vehicle will enter a new braking mode.
3.
here they asked me to make a MATLAB program which plots contour of given motor speed, torque and efficiency values
so, i opend my MATLAB and creared a new script with the class video reference and here is the program is
clear all;
close all;
clc;
% A program for plotting Efficiency contours for Electric motors.
% Defining Arrays for range
x = linspace(1,1000); % speed in rad/sec
y = linspace(1,250); % Torque in N-m
% Motor losses
cu=0.4; % copper losses
Ir=0.006; % iron losses
wd=0.00002; % windage losses
cl=22; % constant losses
% Mesh making
[X,Y]=meshgrid(x,y);
output =(X.*Y); % torque * speed = power
B=(Y.^2)*cu; %copper losses
C = X*Ir; % iron losses
D=(X.^3)*wd; % windage lossees
Input= output + B + C + D + cl;
z = output./Input;
%contor efficiences setting
V=[0.7,0.8,0.83,0.85,0.9,0.92,0.93,0.95,0.97];
box off;
grid off;
contour(X,Y,z,V);
xlabel('speed in rad/s')
ylabel('torque in N-m')
title('Efficiency Contour of Electric motor')
hold on;
% plot a contour of the power output
V=[8000,10000];
contour(X,Y,output,V);
colorbar;
x=linspace(1,1000); % speed in rad/s
y=linspace(1,250);- In the above code Speed and Torque of the motor are defined using the "linspace" command.
- Then all the loss constants as mentioned above are entered in the code and named accordingly.
- After that, a 2D Matrix is created for Speed and Torque using the "meshgrid" command to help to create Contour Plot.
- Then all the losses, output power, and input power are calculated according to the above-mentioned formulas.
- Next, we created another efficiency matrix so that we can define levels for the Contour.
- At last, we plotted contour using the "contour" command, and once the program runs we get the following results.
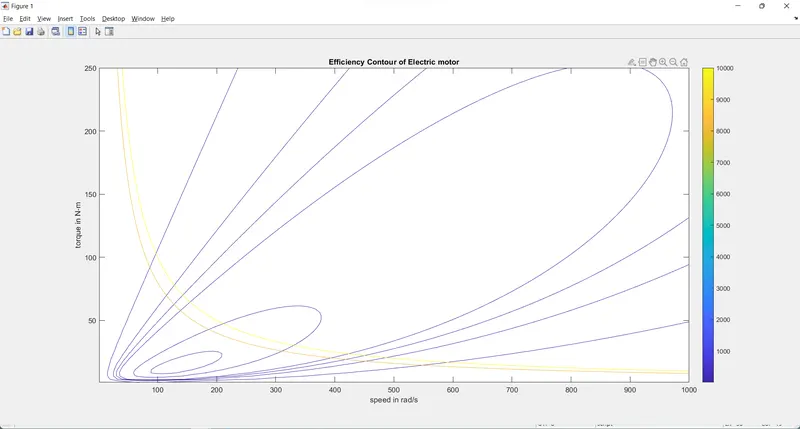
- From the above plot, we can observe that the most efficient region in the contour is the innermost elliptical shape with an efficiency of over 92%.
- It is evident from the contour that, the efficiency decreases as values are away from the innermost shape.
- It is optimal for the Motor to operate between the innermost ellipse and its adjacent one for maximum efficiency and performance.