Week-11 Challenge: Braking
OBJECTS:
- For a defined driving cycle, calculate the energy required for braking.
- Why electric motor can’t develop braking torque at high speed similar to starting? How electric and mechanical brakes are coordinated?
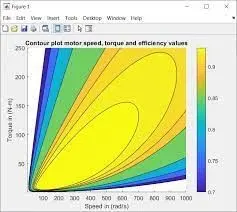
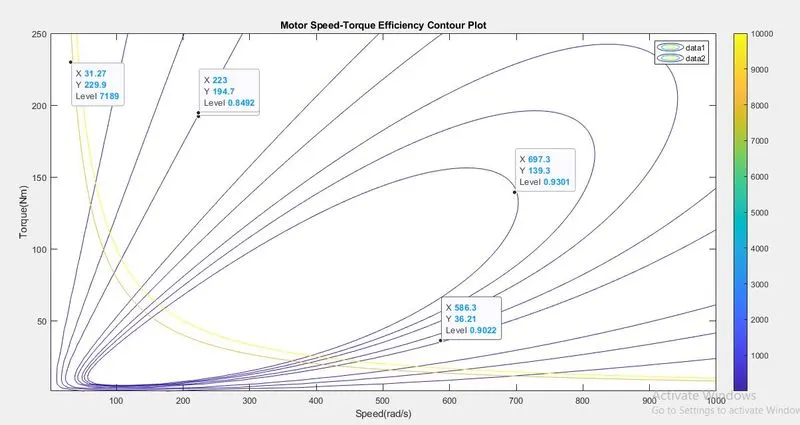
- Make a MATLAB program which plots contour of given motor speed, torque and efficiency values. Attach the code as a .m file attach a screenshot of all the plots.
EV design – energy consumption
And V=rω=dω/2 and ω=V/r with r being the radius of the wheel, r = d/2. However, because of small "I" of the wheels compared to the mass of the car, the contribution of the wheel's change of energy is not significant.
The high voltage battery of an electric vehicle (EV) is one of the most important components since it dictates the dynamic performance, range and charging time of the vehicle. In order to calculate the size of the battery we need two main inputs: the average energy consumption and the range of the vehicle.
This article is explaining how to calculate the energy consumption of a vehicle and it’s part of a EV design series:
- EV design – introduction
- EV design – energy consumption
- EV design – battery
- EV design – electric motors
- EV design – mode management
- EV design – vehicle systems and components
- EV design – simulation model
- EV design – simulation results and evaluation
WLTC drive cycle
The average energy consumption of the vehicle Eavg [Wh/km] will be calculated on a homologation cycle. For our example we are going to use the WLTC drive cycle. The test procedure WLTP (Worldwide harmonized Light vehicles Test Procedure) contains several driving cycles:
- Class 1 – low power vehicles with PWr <= 22
- Class 2 – vehicles with 22 < PWr <= 34
- Class 3 – high-power vehicles with PWr > 34
Where PWr [kW/Tonne] is the power-to-weight ratio, defined as the ratio between the rated engine power and kerb weight.
Our target is to convert the 16MY Jaguar F-type vehicle into a battery electric vehicle (BEV). Therefore we need to understand what is the current energy consumption of the vehicle. From the article EV design – introduction we can extract the maximum power and kerb weight and calculate the power-to-weight ratio:
Since the vehicle’s PWr is bigger than 34, we are going to use the WLTC Class 3 driving cycle to calculate the energy consumption.
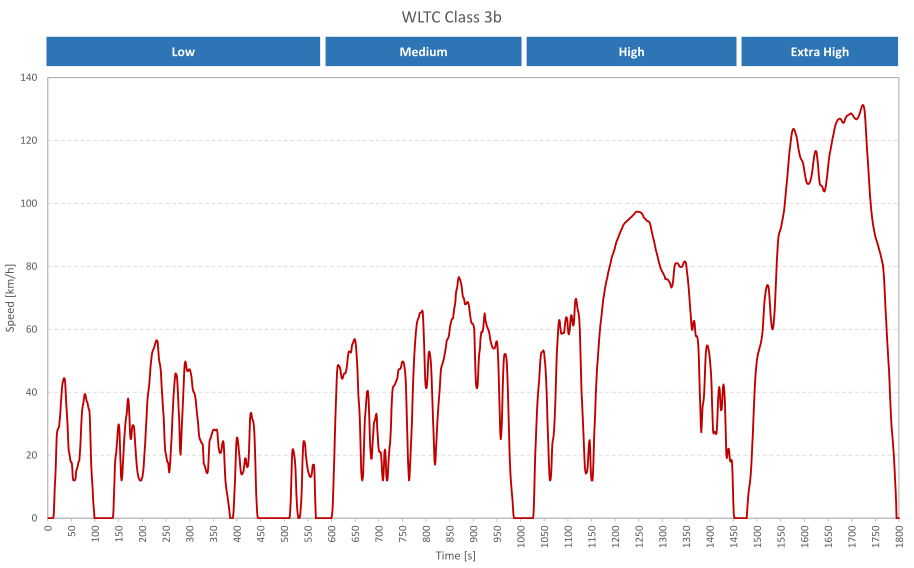
Image: Speed profile for WLTC Class 3 driving cycle
The parameters of the WLTC Class 3 cycle are summarised in the table below:
| Low | Medium | High | Extra High | Total | |
|---|---|---|---|---|---|
| Duration, s | 589 | 433 | 455 | 323 | 1800 |
| Stop duration, s | 150 | 49 | 31 | 8 | 235 |
| Distance, m | 3095 | 4756 | 7162 | 8254 | 23266 |
| % of stops | 26.5% | 11.1% | 6.8% | 2.2% | 13.4% |
| Maximum speed, km/h | 56.5 | 76.6 | 97.4 | 131.3 | |
| Average speed without stops, km/h | 25.3 | 44.5 | 60.7 | 94.0 | 53.5 |
| Average speed with stops, km/h | 18.9 | 39.4 | 56.5 | 91.7 | 46.5 |
| Minimum acceleration, m/s2 | -1.5 | -1.5 | -1.5 | -1.44 | |
| Maximum acceleration, m/s2 | 1.611 | 1.611 | 1.666 | 1.055 |
The method to calculate the energy consumption is straight forward and it makes use of the Scilab/Xcos simulation environment. The steps are as follows:
- Determine the mathematical expression of the energy consumption
- Create a Scilab script file (
*.sce) for the vehicle parameters (input data) - Create the Xcos block diagram (
*.zcos) - Run the simulation on the WLTC driving cycle
- Create a post-processing script (
*.sce) and analyse the result
Mathematical expression of the energy consumption
The energy consumption is calculated based on the road loads. The total road load Ftot [N] is the sum of the inertial force, road slope force, road load (friction) force and aerodynamic drag force.
where:
Fi [N] – inertial force
Fs [N] – road slope force
Fr [N] – road load force
Fa [N] – aerodynamic drag force
The inertial force is given by the equation:
where:
mv [kg] – total vehicle mass
av [m/s2] – vehicle acceleration
The vehicle acceleration can be calculated as:
where:
Δv [m/s] – speed difference
Δt [s] – time difference
The road slope force is given by the equation:
where:
g [m/s2] – gravitational acceleration
αs [rad] – road slope angle
The road load (friction) force is given by the equation:
where:
crr [-] – road rolling resistance coefficient
The aerodynamic drag force is given by the equation:
where:
ρ [kg/m3] – air density at 20 °C
cd [-] – air drag coefficient
A [m2] – vehicle frontal area
vv [m/s] – vehicle speed
The total power Ptot [W] is calculated as the product between the total road forces and the vehicle speed:
By integrating the total power over time (for the whole duration of the cycle), we get the total energy consumption Etot [J]:
All the equations above will be used in the Xcos block diagram in order to calculate the energy consumption of the vehicle over the drive cycle.
Vehicle parameters (input data)
The main vehicle parameters used for the WLTC drive cycle are explained in the article EV design – introduction defined in a Scilab script (*.sce).
vehMassKerb = 1741; // [kg]
vehMassDriver = 80; // [kg]
vehMassfm = 1.05; // [-]
vehMass = vehMassKerb * vehMassfm + vehMassDriver; // [kg]
vehg = 9.81; // [m/s^2]
vehcd = 0.36; // [-]
vehfa = 2.42; // [m^2]
vehro = 1.202; // [kg/m^3]
roadSlope = 0; // [rad]
roadCrr = 0.011; // [-]
Xcos block diagram (vehicle simulation over WLTC)
The Xcos block diagram model is run for 1800 s, which is to total duration of the WLTC drive cycle. A Clock block is used to generate a time step of 1 s. This time step is set because the input data (WLTC speed profile) is sampled at 1 s. The speed profile is read with a From workspace block. Before running the simulation we need to load the speed profile as a variable of type structure, containing the speed values and time (e.g. WLTC.time and WLTC.values).

Image: Xcos block diagram for WLTC energy consumption
Since the sample time is 1 s, which means Δt = 1, the vehicle acceleration will be calculated as the difference between the current speed value and the previous speed value. In the WLTC driving cycle, the road slope is considered 0 rad, therefore will not have any influence on the energy consumption.
Depending on the sign of the total power, we can distinguish between the acceleration and braking (deceleration) phases of the vehicle. The integration of the power, for a Δt = 1, gives the energy. The acceleration and braking energies are calculated separately and then summed up to give the total energy.
By dividing the last calculated value of the total energy (3205.39 Wh) to the total length of the WLTC drive cycle (23.266 km), we get the average energy consumption of the vehicle, 137.8 Wh/km.
The WLTC speed profile, total road load forces, total power, acceleration energy, brake energy and total energy are saved in the Scilab workspace for further visualisation and analysis.
Data post-processing
Using a Scilab script we can plot the drive cycle simulation result. In this particular case we are going to plot only the acceleration, braking and total energy.
plot(WLTC_vehTotEgy_kWh.time, WLTC_vehTotEgy_kWh.values,'k')
plot(WLTC_vehAccEgy_kWh.time, WLTC_vehAccEgy_kWh.values,'r')
plot(WLTC_vehBrkEgy_kWh.time, WLTC_vehBrkEgy_kWh.values,'b')
xgrid()
xlabel('Time [s]','FontSize',2)
ylabel('Energy [kJ]','FontSize',2)
title('x-engineer.org','FontSize',2)
legend('Total','Acceleration','Braking',2)
Running the script will generate the following plot.

Image: WLTC energy consumption
The same model can be used for any other vehicle, the only change needed being the input parameters update. Also, the simulation can be run for different drive cycles, like FTP or NEDC or for custom cycles which can include also a road gradient.
The average energy consumption over WLTC drive cycle is 137.8 Wh/km. This value will be used to calculate the total energy required for the high voltage battery.
A moving car has a lot of kinetic energy. When you apply the brakes, that energy of motion is transformed into something else, and the car slows down.
Most cars use friction brakes, which inhibit motion by converting kinetic energy to heat. Because cars are massive and move fast, they have a lot of energy to convert. That means brakes get very hot, 450
As brakes heat, they fade (become weaker) and eventually fail (that's why it's good to shift into a lower gear on a long downhill grade rather than ride the brakes).
During extreme use, brakes can even catch on fire:
More advanced automobiles use regenerative braking, where a portion of the kinetic energy is converted to electrical energy and stored in batteries (this is not 100% efficient and a significant fraction of the kinetic energy is still converted to heat).
Regenerative braking adds cost and complexity to the design, but also adds a lot of efficiency (it's one reason a Prius gets > 50 mpg) and extends the life of the braking system.
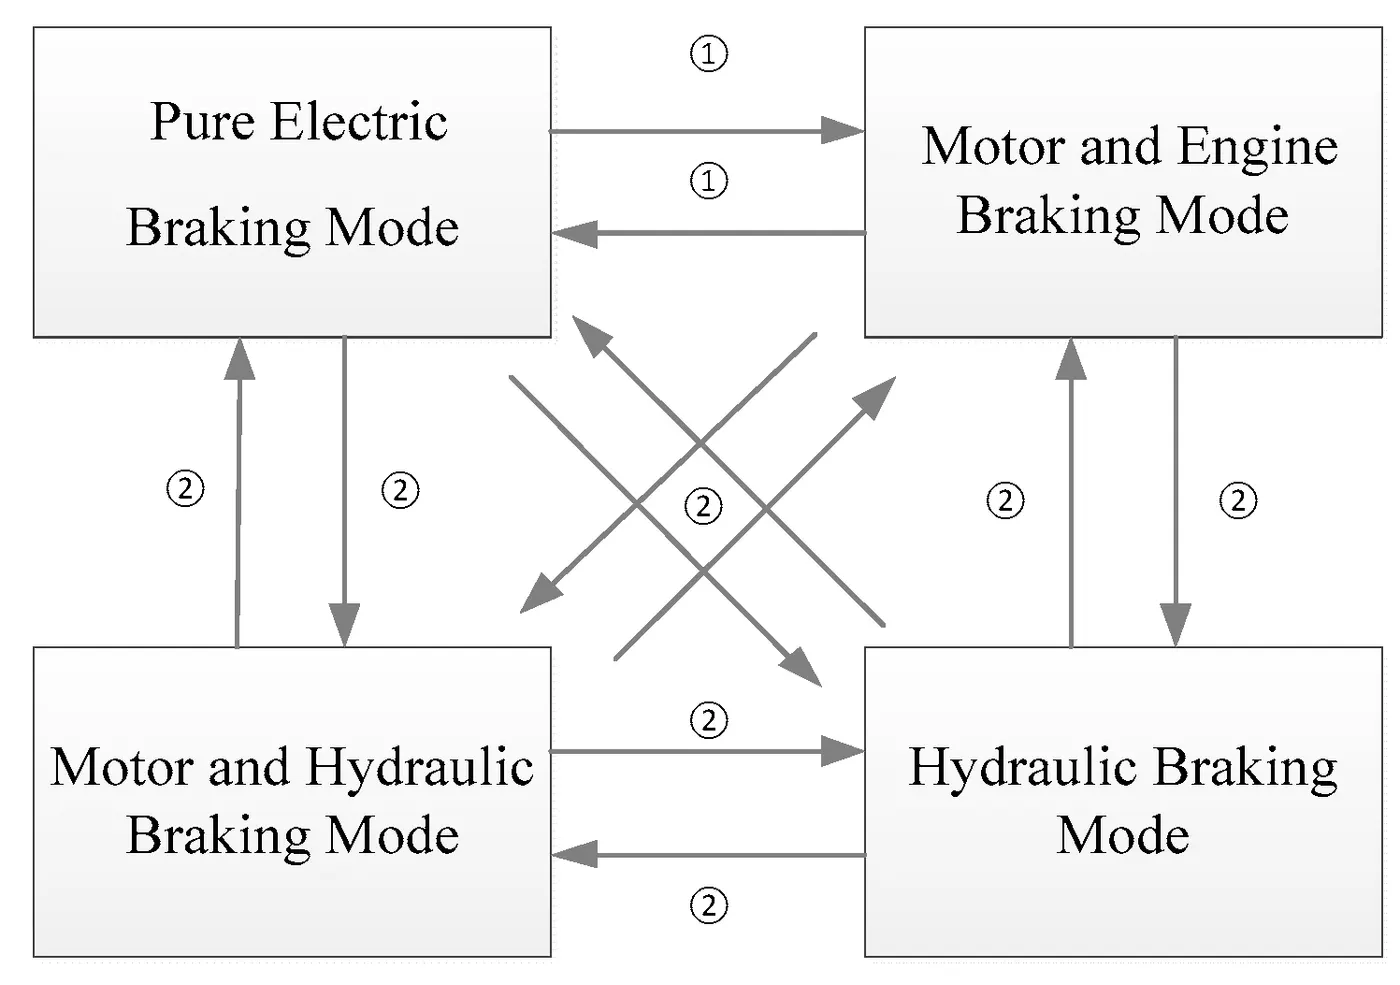
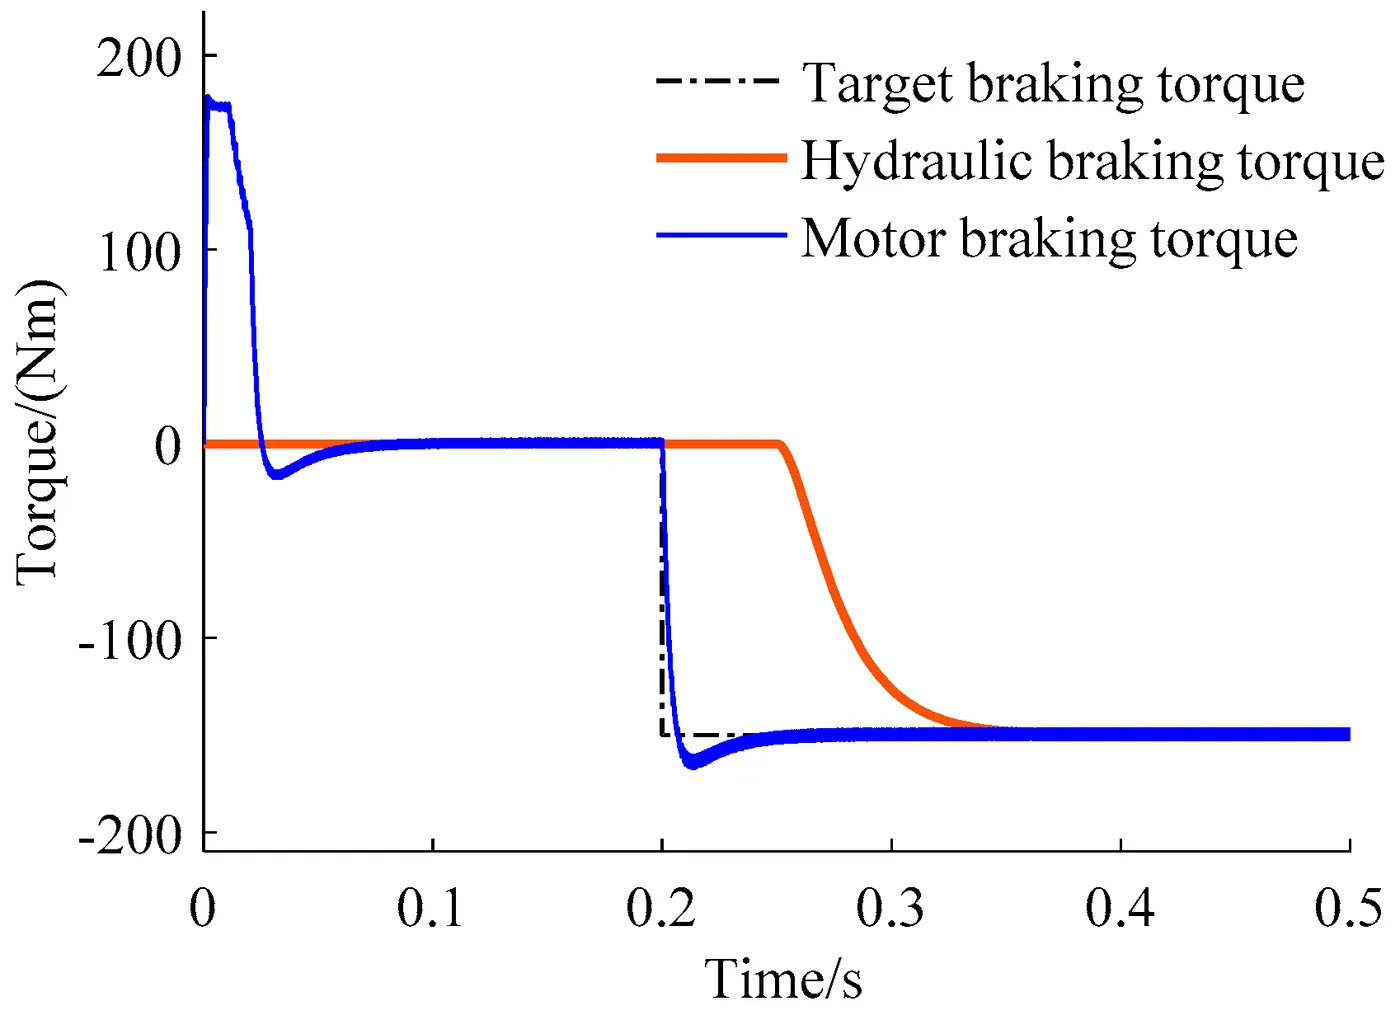
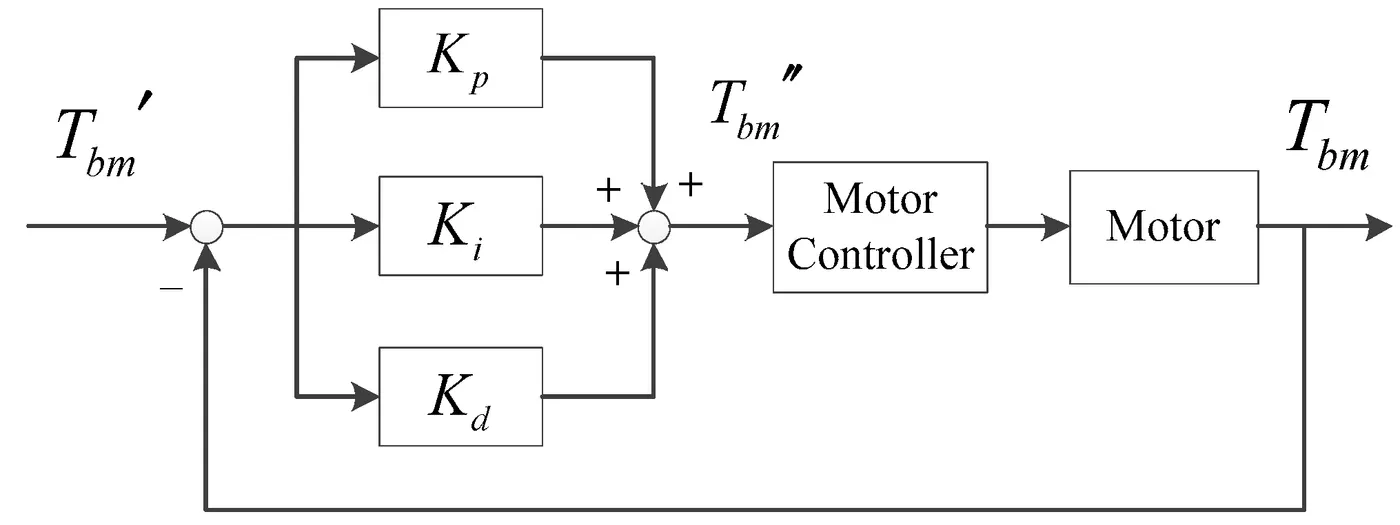
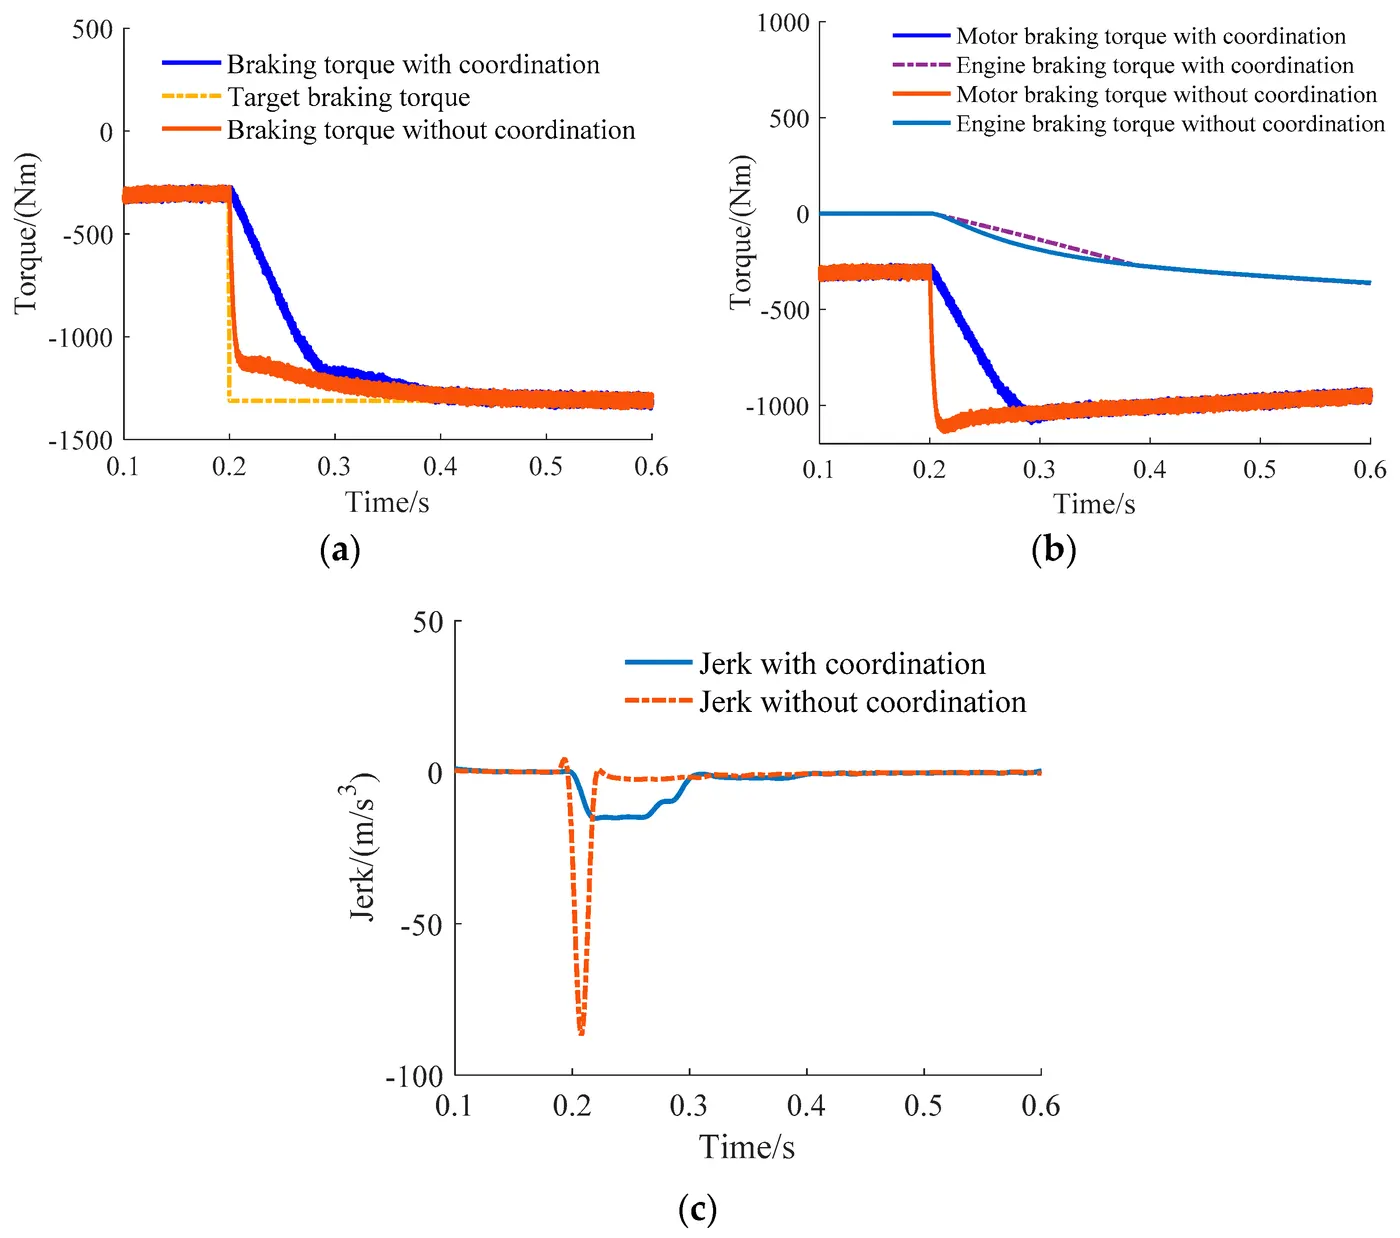
2.Why electric motor can’t develop braking torque at high speed similar to starting? How electric and mechanical brakes are coordinated
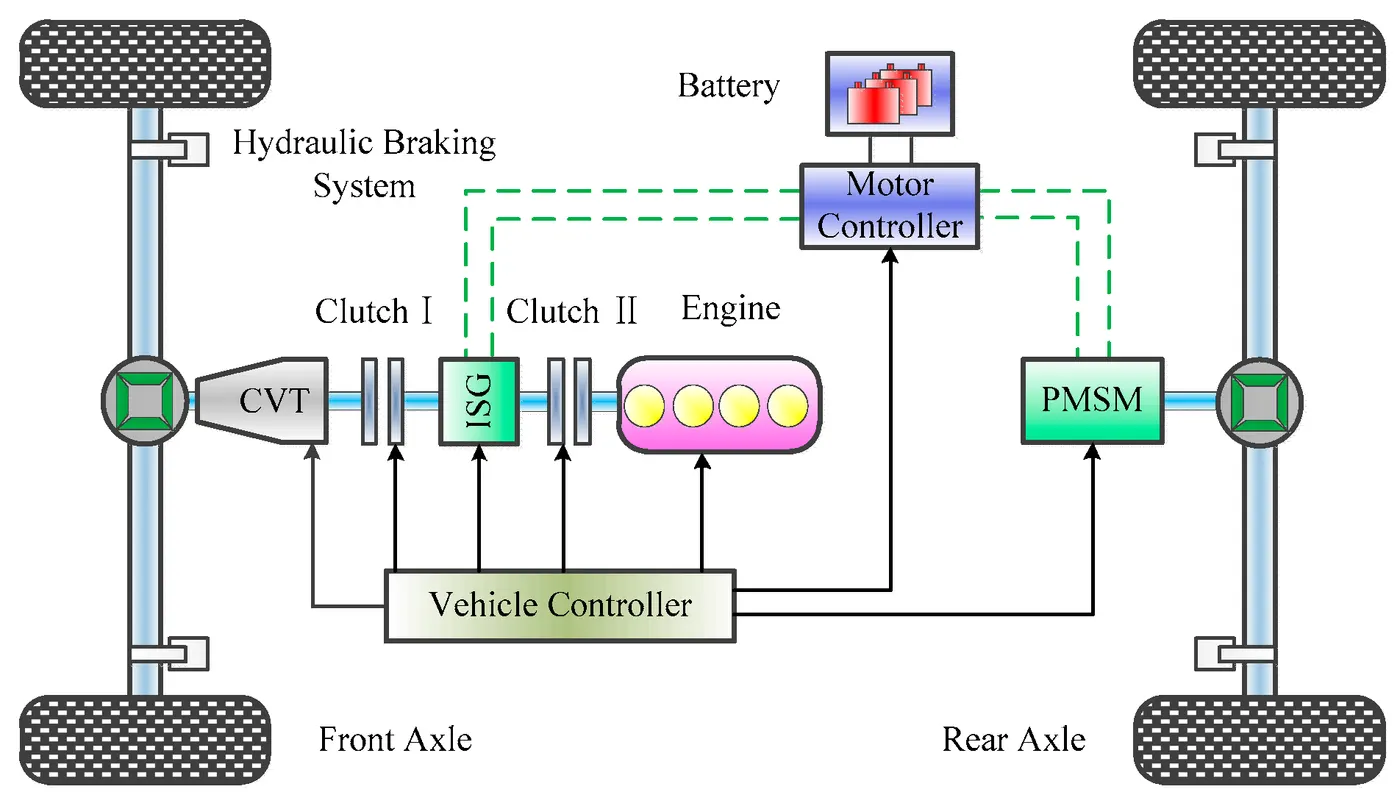
Before starting: torque actual value IS NOT, the real motor torque
What you read as torque actual value is indeed the current read on the motor multiplied by a factor (torque sensitivity or torque constant) that we consider linear and constant.
Reasons why the torque actual is NOT the real torque:
- If commutation, phasing, is not correct, an important part of the current is not useful torque, it just creates electrical and magnetic loses.
- If current loop is not well configured or unstable, the current will be higher and with ripple, the real "useful mechanical torque" will be indeed lower.
- Torque constant can vary due to several factors, like motor construction, temperature of the magnets (that affects its magnetic properties).
However this solution is good and practical approximation. And saves expensive torquemeters or strain gauges.
Why can't I reach 100% torque?
Sometimes after accelerating you can't reach the maximum torque. The reason is that no matter how much the current loop wants to increase current (proportional to torque) by increasing the PWM duty cycle of the power stage, the Vmotor is too close to Vbemf and therefore current can't increase more.
Whenever Friction torque + Additional loads = Motor Torque, the load remain in equilibrium (does not move, or moves under constant speed). Whenever Friction torque + Additional loads < Motor Torque, the load accelerates (Motor torque - Friction torque - Additional loads = Acceleration torque > 0). Al high speeds, the BEMF is so close to Vbus that the applicable Motor torque gets limited. Then, the bigger the Friction torque + Additional load is, the smaller the Acceleration torque becomes.
This can also occur if acceleration or speed is limited by some reason.
This situation does not occur at the beginning of an acceleration because most of the torque is used to increase the kinetical energy of the load (and motor). But when the speed is already high and no extra load is applied it is not possible to increase the torque.
Maximum achievable torque depending on motor speed
Recalculate this based on your motor parameters.
STEPS:
How to prevent this
Increase DC bus voltage.
Unlimit system acceleration.
Use a motor with less resistance and lower back EMF proportion.
Compensation for electric mobility throttles
This situation creates a bad feeling that at high speeds the throttle does not work correctly.
The user feels that it releasing the throttle does not reduce motor force!
The proposed solution is to add a torque demand limitation based on speed.
- Will improve user feeling when releasing brake when the vehicle is already accelerated.
- Will limit vehicle top speed (safety)
3.Make a MATLAB program which plots contour of given motor speed, torque and efficiency values. Attach the code as a .m file attach a screenshot of all the plots.