Week-11 Challenge: Braking
Student of EV Batch 16:
1.For a defined driving cycle, calculate the energy required for braking:
>The driving cycle taken into conisideration is UDDS cycle which stands for Urban Dynamometer Driving Schedule.
>The data is taken for a total driving time for 1370s.
>The command script for the energy is given below:
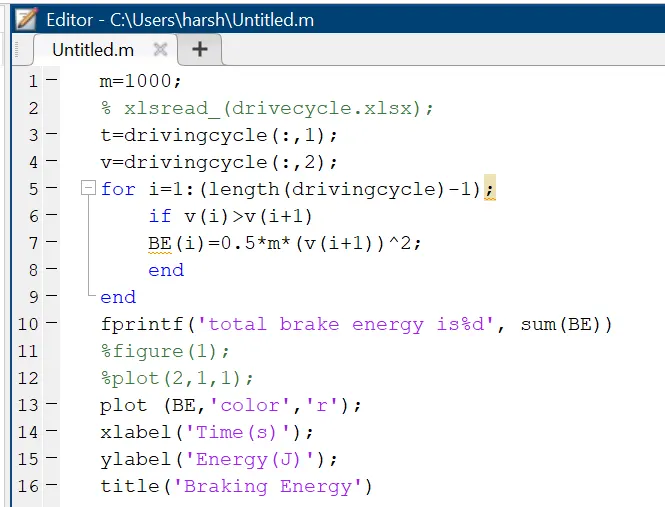
>The equation for kinetic energy is
E=(1/2).mv^2
>The driving cycle excel sheet which is inserted in the matlab command is given below:


>After inserting the excel sheet in the matlab program and saving the driving cycle sheet same file in the script is written, the script is ran.
>The output after hitting the run button.
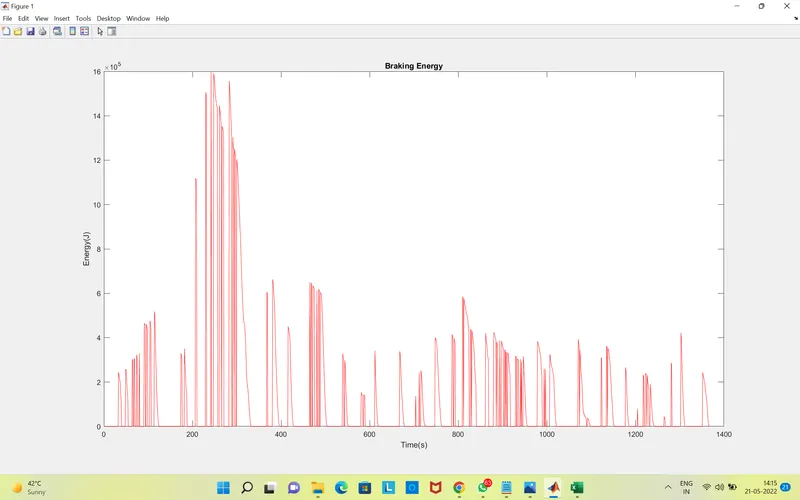
>The graph of braking energy vs time is plotted, the inputs are taken upto 1370 seconds.
2.Why electric motor can’t develop braking torque at high speed similar to starting? How electric and mechanical brakes are coordinated?
Torque speed charcheteristics:
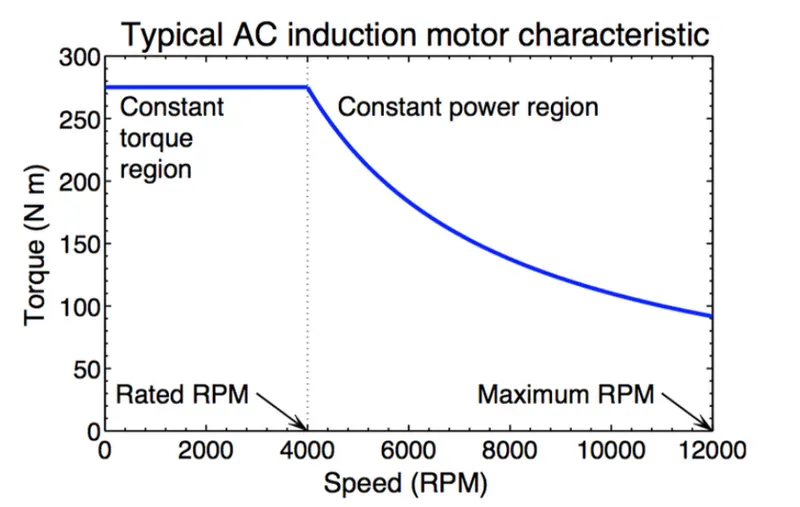
>The above graph show charateristics of torque vs speed for different inputs.
>From this curve we have two regio, constant torque and constant power region.
>At the start the motor achieves peak torque till it reaches a certain motor speed range from where it will rapidly drop.
>The reason due to the drop in torque is due to the motor shaft reac hes the critical speed and the area where peak torque is constant known as the constant torque region of motor.
>The region where the torque decreases is known as the constant power region as the power generated by the motor will be at it's peak.
>Since the torque produced at the consatnt power region is very low, it is not possible to develop enough braking torque in this region.
>The braking torque produced increases as the speed decreases.
>In electric vehicles, two types of brakes are used:
Elecric brake system & Mechanical Brake System
Elecric brake system:
>in this type of brakig system, the winding of the motor is used to produce a braking torque.
>a braking torque is developed during the braking operation.
>This braking torque opposes the motion of the electrical connections of the motor.
>the motor operates on a speed-torque characterstics, depending upon the method of braking employed.
Mechanical Brake System:
>In this type of braking system, the frictional force between the rotating parts and the brake drums produces the required braking.
>To achieve this, mechanical equivpment such as brake linnings and brake drums, are required.
>Whether electrical or mechanical, the braking of the drive should stop the motor at the specified point of time and position.
Co-ordination of Electric and Mechanical Braking In An Electric Vehicle:
>The electrical braking system used in EVs and HEVs is regenrative braking.
>This method uses the motor as a generator during braking, developing a retarding torque, which acts on the running motor and halts it.
>Mechanical braking can be either disc or drum brake system.
>From the graph we can clearly see that, the braking torque is very less at high speeds in regenrative braking, mechanical brakes are applied to slow down the vehicle.
>As the motor reaches the constant torque region the regenertaive braking system takes effect where the motor acts as a generator and the negative torque produced chaarges the battery pack.
3.MATLAB program which plots contour of given motor speed, torque and efficiency values.
>An efficency map of an electric motor is a contour plot of torque and speed.
>It is used to describe the speed and torque combinations required at different efficiency ranges.
>In order to model the efficiency contour we must consider the losses that occur in electric motors and these losses are,
Iron Core Losses.
Copper or Variable Losses.
Windage Losses.
>Based on all threee losses the MATLAB program is to plot the efficiency contour is written below:
clear all
clc
x=linspace(1,1000); % speed,rad/s not rpm
y=linspace(1,250); % 0 to 40Nm
% Allocate motor loss constants
kc=0.2; % For copper losses
ki=0.008; % for iron losses
kw=0.00001; % for windage losses
ConL=400; % for constant motor losses
% Now make mesh
[X,Y]=meshgrid(x,y);
Outputpower=(X.*Y); % torque x speed = power
B=(Y.^2)*kc; %copper losses
C=X*ki; % iron losses
D=(X.^3)*kw; % windage losses
Inputpower = Outputpower + B + C + D +ConL;
Z = Outputpower./Inputpower;
% We now set the efficiencies for which a countour will be plotted
V=[0.5,0.6,0.7,0.75,0.8,0.85,0.88];
box off
grid off
contour(X,Y,Z,V);
xlabel('speed/rad.s^-^1')
ylabel('Torque/N.m')
zlabel('Efficiency')
title('torque speed curve of induction motor')
hold on
V=[3000,5000];
contour(X,Y,Outputpower,V);

figure
surf(X,Y,Z)
colorbar
xlabel('speed rad/s')
ylabel('torque Nm')
zlabel('Efficiency')
title('Efficiency of a motor')
>In order to map the contour for diferent efficiency ranges an array is defined which consists of the effciencies from 0.7 to 0.93.
>The speed and the torque are defined as 2-Dimensional linearly spaced array using the linespace command.
>The 2D arrays of speed and torque and also the #d arrays are defined using the meshgrid command.
>The contour plot of MATLAB is given below:
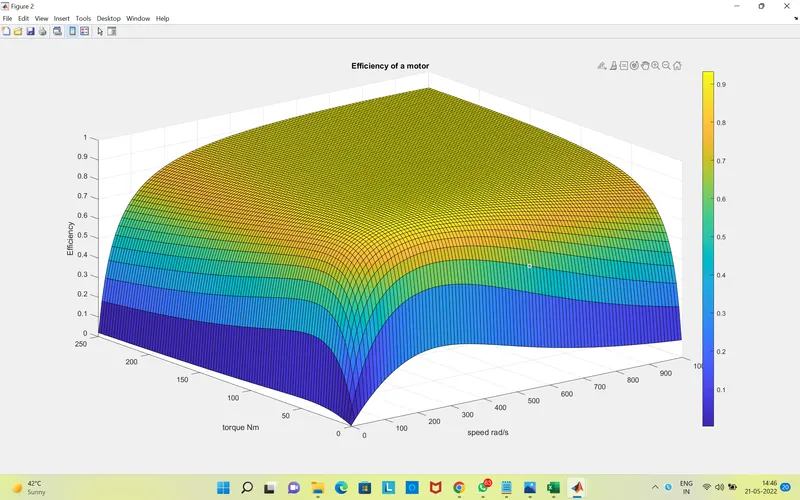
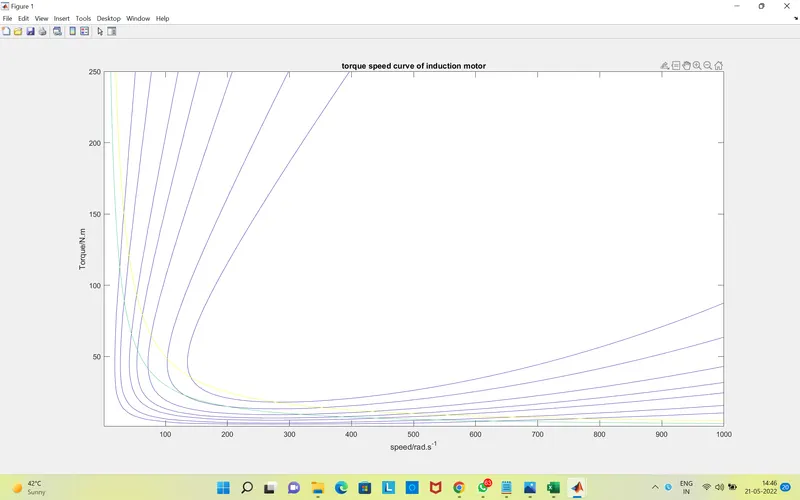
>From the plot it can be observed that the speed and torque varies as the efficiency increases.This is due to the motor losses that occur.
>Greater the motor efficiency, lower speed-torque combination is required to overconme motor losses.