Week-11 Challenge: Braking
Objective: To answer the following questions appropirately,
- For a defined driving cycle, calculate the energy required for braking.
- Why electric motor can’t develop braking torque at high speed similar to starting? How electric and mechanical brakes are coordinated?
- Make a MATLAB program which plots contour of given motor speed, torque and efficiency values. Attach the code as a .m file attach a screenshot of all the plots.
Explanation:
1. For a defined driving cycle, calculate the energy required for braking.
We know that braking action results in decelerating the vehicle. Kinetic energy is the force that keeps the vehicle moving, so when the brake are applied, due to the friction developed between the contacting surfaces (Disc brake/Drum with Tyre, Tyre with the road) the kinetic energy get's observed and dissipates as heat.
Kinetic energy = (1/2)*m*v^2
This can be rewritten as (1/2)*(W/g)*[(u^2)-(v^2)]
The intensity of the brake also depends upon the at what rate should the moving vehicle should come to rest. The following are the factors that are considered for the intensity of the braking,
a) Vehicle weight, W (W = m*g)
b) Vehicle velocity, (u is the initial velocity and v is the final velocity)
c) Time at which the Vehicle needs to be stopped
For the defined cycle, I have considered the New york city Drive cycle from the following source as an example to find out the braking energy required for that cycle.
source: https://www.epa.gov/sites/production/files/2015-10/uddscol.txt
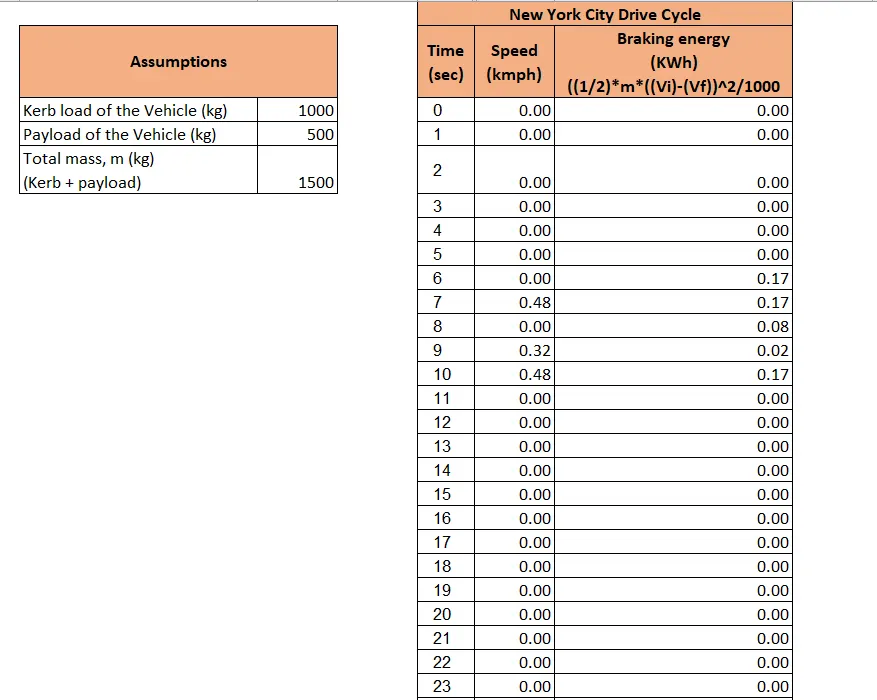
The braking energy obtained was plotted along with the drive cycle to get a better picture.
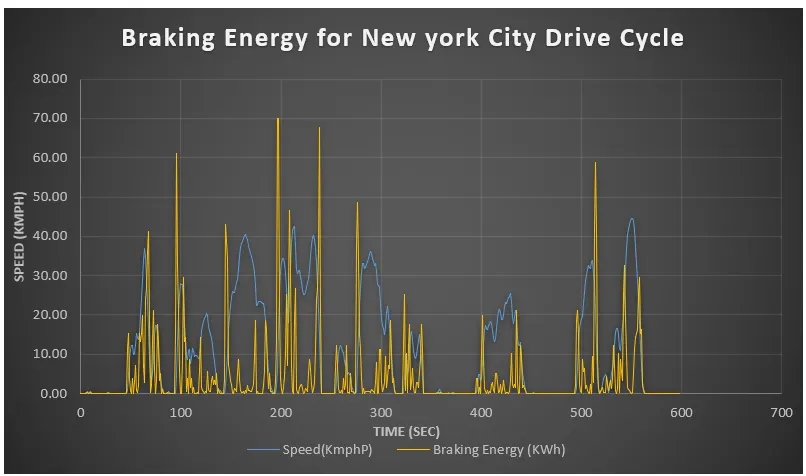
So Whenever it is observed from the above graph that whenever there is a deceleration in the vehicle, the braking energy peaked according to the dissipation of the kinetic energy generated by the vehicle at that moment. The total braking energy obtained for the entire driving cycle is 2630 KWh.
2 (a) Why electric motor can’t develop braking torque at high speed similar to starting?
Regenerative Braking:
As soon the brake pedal is pressed, the AC/DC motor will be cut down from the battery source, but the motor will continue to run due to the interia. Since the motor is running in the generated magnetic field, a back emf develops which then leads the AC motor to generate negative torque. This negative torque results in braking.
During the braking, the motor functions as generator which then recharges the battery, so that the kinetic energy of the Vehicle gets converted in to electrical energy and stored in the Battery. In conventional IC engine Vehicle this kinectic energy will only get dissipated as heat during braking.
However there are some limitations from the motor and battery side which affects the efficiency of the regenerative braking.
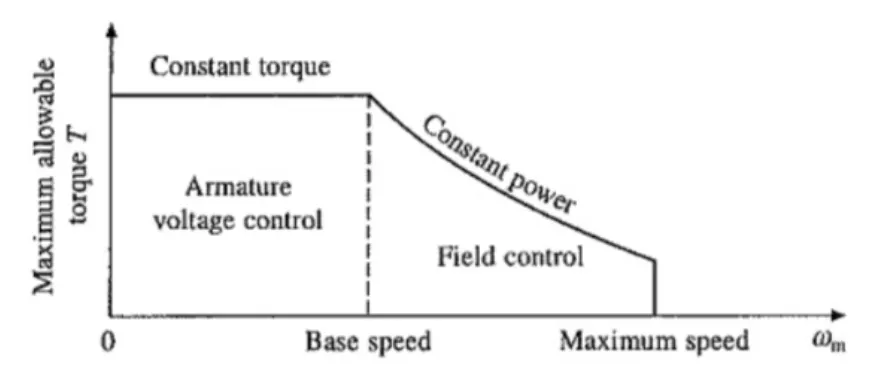
Motor Limitation: This is the speed torque characteristics of an Electric Vehicle, here we can observe when the Vehicle is started it will be on low speed and high torque which is the "Constant Torque" region. As the Speed increases the torque will also decrease. This lies in the "Constant Power" region. When the EV is running at this constant power region, ie., at high speed and low torque, the negative torque generated by the motor at the time of braking will be based on the immediate rotation. Hence the negative torque is lesser than the torque produced during the starting speed.
Battery Limitation: Most of the batteries used in the EV has higher discharge rate than the charge acceptance rate because of this battery won't receive the current from regenerative braking beyond a threshold value. This why two kinds of brakes are employed in the EV's one is the Electric brake and the conventional hydraulic brake.
This how Motor and Battery limitations play role in affecting the regenerative braking.
2(b) How electric and mechanical brakes are coordinated?
As explained above due to the limitations of the motor and the battery, both mechanical and electric brakes are employed in an EV. Whenever the battery cannot accept the regenarative current, the dynamic/hydraulic brake comes into action, like the conventional ones here there won't be any energy conversion or storage but the energy gets dissipated as heat.
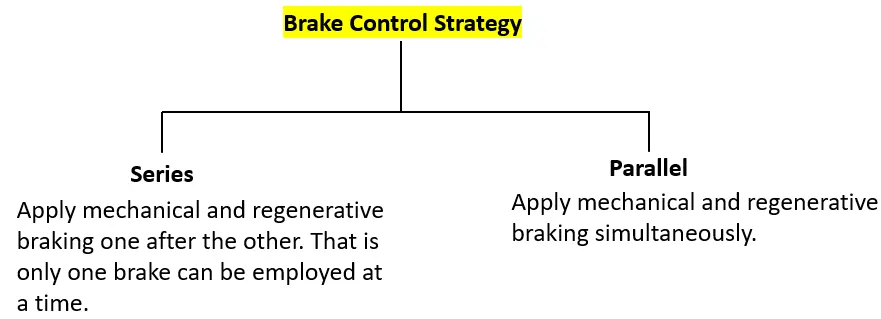
To manage on how these 2 brakes are engaged is called the "Brake control strategy". It depends the kinetic energy at the moment and the passenger comfort & safety categories.
In Nissan Leaf they have deployed a new technique called "Electric Driven Intelligent Brake" (EDIV).
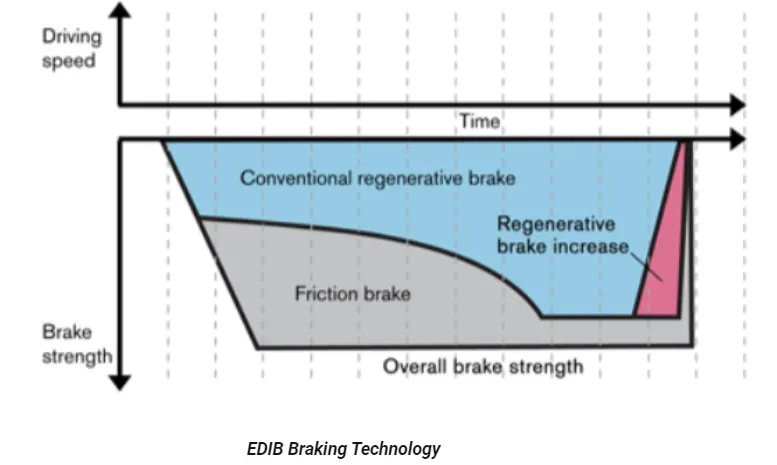
Here both regenrative brake and frictional brakes are employed but only at certain conditions both are equally used and in another condition only one brake is used.
As we can see in the above figure, At higher speeds when the vehicle needs braking, % of the both brakes used will be almost equal. The reason during this constant power region there will be lower torque hence even if electric brakes are used the negative torque will be lesser which may not effective enough to generate the required current. Whereas at lower speeds The % of the regenerative braking will be higher. This is again this is the constant torque region with higher torque which means while braking there will higher negative torque.
3. Make a MATLAB program which plots contour of given motor speed, torque and efficiency values. Attach the code as a .m file attach a screenshot of all the plots.
Generally the efficiency of the motor is determined by intrinsic losses and this can only be decided by the changes in the motor design. There are fixed and variable losses. Here I have considered only the fixed losses as variable losses are subjected to many dynamic changes.
Fixed losses:
These are further classified as types,
a) Copper loss - Copper loss is given by I^2*R, where I is the current and R is the resistance
We know that I is proportional to the Torque T, thereby the relation can be rewritten as kc*T^2
Here kc is the resistance of the brushes and the magnetic flux effect.
b) Iron Loss - This occurs due to the magnetic losses that the motor faces. In case of permanent magents there is a constant magnetic field.
The relation of the Iron loss is ki*W, where ki is the Iron loss constant and W is the speed in rad/s. The ki depends upon the change in the magnetic field this in turn varies according to the speed.
c) Windage Loss - It is also called the mechanical or frictional loss. This loss mainly depends upon the size and shape of the motor. The relation of the Windage loss is given by kw*(W)^3 where kw is the windage loss constant and W is the motor speed.
d) Constant loss - This loss which does not fall under the category of the above 3 will be considered in the constant loss.
We know that, Efficiency = Ouput power/ Input power
Output power = Input power - ( Copper loss + Iron loss + Windage loss + Constant loss)
Here a Matlab code is generated to show the contour plots of the Speed, Torque and efficiency of the DC motor. Contour is nothing the 3D representation of the lines at same heights though it might different depiction in the bar garph/scatter plots.
Matlab code:
clear all
close all
clc

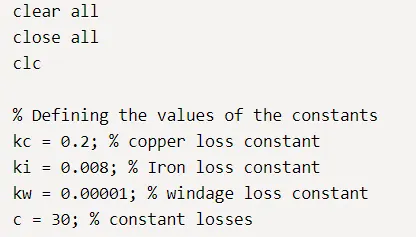
% Defining the values of the constants
kc = 0.2; % copper loss constant
ki = 0.008; % Iron loss constant
kw = 0.00001; % windage loss constant
c = 30; % constant losses

% Defining the Speed and Torque
w = linspace(0,1000,500); %speed in rad/s
t = linspace(0,250); %Torque in Nm
% inorder to create a 2D array
[W,T] = meshgrid(w,t);

% To calculate the steady losses in DC motor
CL = kc.*(T).^2; % copper losses (I^2*R)
IL = ki.*W; % Iron losses
WL = kw*((W).^3); % Windage losses

% To calculate the output power
OP = W.*T;

% To calculate the input power
% W.K.T the Output power = Input power - (copper loss+Iron loss +Windage
% loss+ constant loss)
IP = OP + CL + IL + WL + c;
% to find the motor efficiency
E = OP./IP;

% efficiency range
ER = linspace(0.75,0.93,15);

% to generate the contour plot
contour(W,T,E,ER)
colorbar
xlabel('Speed (rad/s)')
ylabel('Torque (Nm)')
zlabel('Efficiency')
title('Contour analysis of Speed, Torque and Efficiency')
Code Explanation:
i) The loss constant values were defined. These values were assumed based on DC motor considertion.
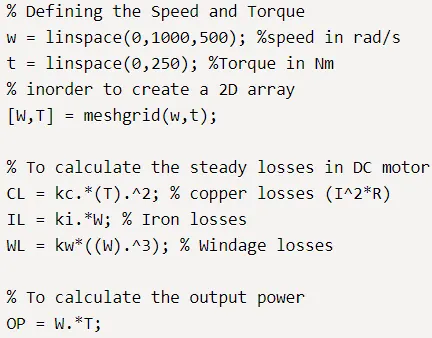
ii) Used linspace command to define the values of the Speed and Torque, only more arrays are generated the graph will be easier to interpret. I have created a 2D array using the command Meshgrid. Based on the theory explanation of the losses above, the loss relations have used used to figure out the loss values. For the array multiplication "." is used.
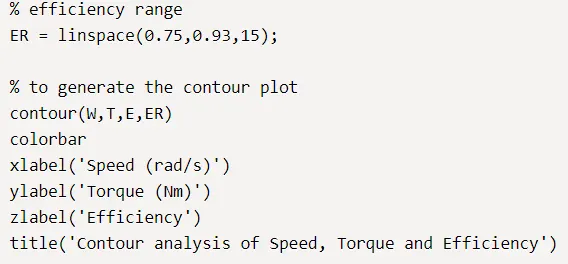
iii) Finally the efficiency of the DC motor ranges from 75 % (at higher torque) to 93% (at lower torque) so used linspace command to bring the values between them. To obtain the contour plot I used the command "Contour".
Result Graph:
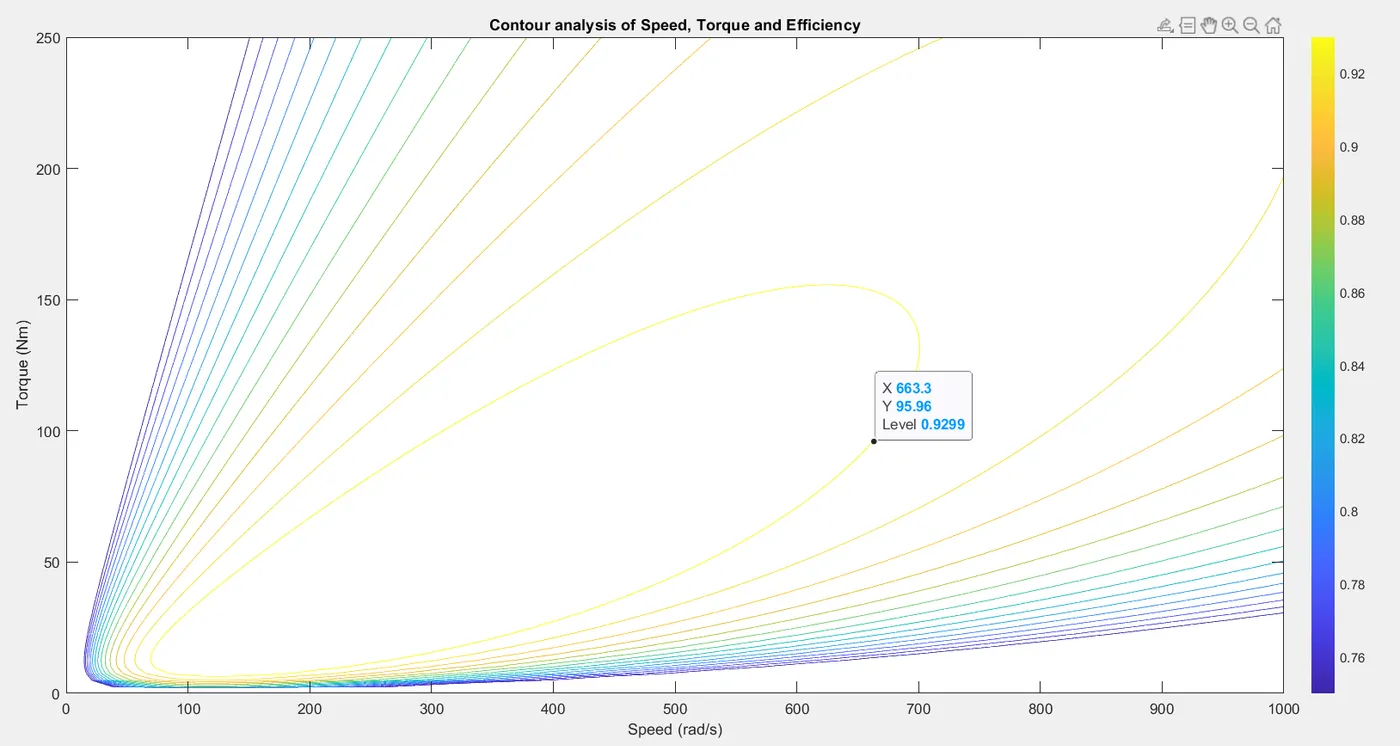
Here we can observe the center contour line is the highest efficiency of the motor which is 93%. The first half represents the constant torque and constant power. Using this efficiency map, we can determine which motor we can used. This also depends upon the efficiency requirements of the vehicle (at what speed and Torque that is gonna predeominently driven).