Week-11 Challenge: Braking
1. For a defined driving cycle, calculate the energy required for braking.
Answer:
Braking is a dynamic state that which a vehicle decelerates from a certain velocity. The vehicle needs a certain period of time to move to another level of velocity or to stop. The vehicle possesses kinetic energy when it accelerates either in motion or from rest and during deceleration, the opposite occurs.
For an object with mass(m) & moving at velocity(V), kinetic energy can be defined as:
E = 1/2 * m * V^2
Kinetic energy is provided by the engine to accelerate the vehicle from a standstill to the desired speed. This energy is dissipated as heat during the braking.
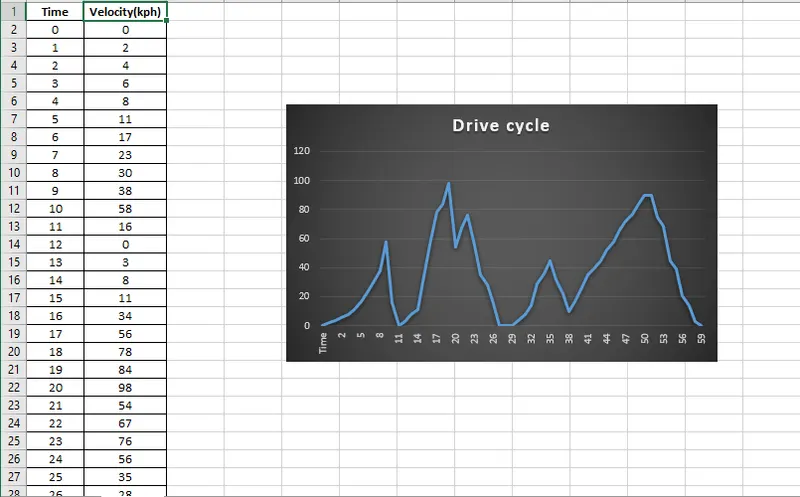
The Drive cycle is the set of data representing the relation between vehicle velocity and time. The drive cycle is prepared in excel as shown below.
If the vehicle is decelerating from its initial velocity(Vi) to final velocity(Vf), then the energy required for braking is given as:
E = 1/2 * m * (Vi -Vf)^2
Code:
clc;
clear;
% Input
m = 1500; % mass in kg
d = readtable ('Drive_c.xlsx');
t = d.Time; % time(s)
v = d.Velocity / 3.6 ; % velocity(m/s)
E = zeros(1,length(t));
BE = 0;
for i = 1 : length(v)-1
if v(i)>v(i+1)
E(i) = 0.5 * m * ((v(i))^2-(v(i+1))^2) ;
BE = BE + E(i);
end
end
disp("Breaking energy is " + BE/1000 + " KWh" )
plot(t,v,linewidth=2);
title("Drive cycle");
xlabel("Time(s)");
ylabel("Velocity(m/s)");
figure
plot(t,E,linewidth=2);
title("Breaking energy");
xlabel("Time(s)");
ylabel("Breaking energy");
Simulation results:
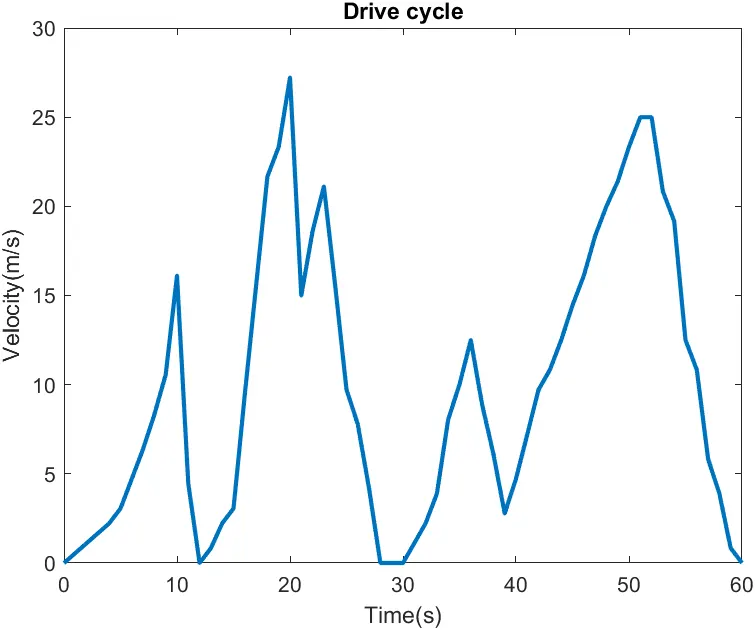
The Drive cycle is as shown below.
The below graph shows the breaking energy required.
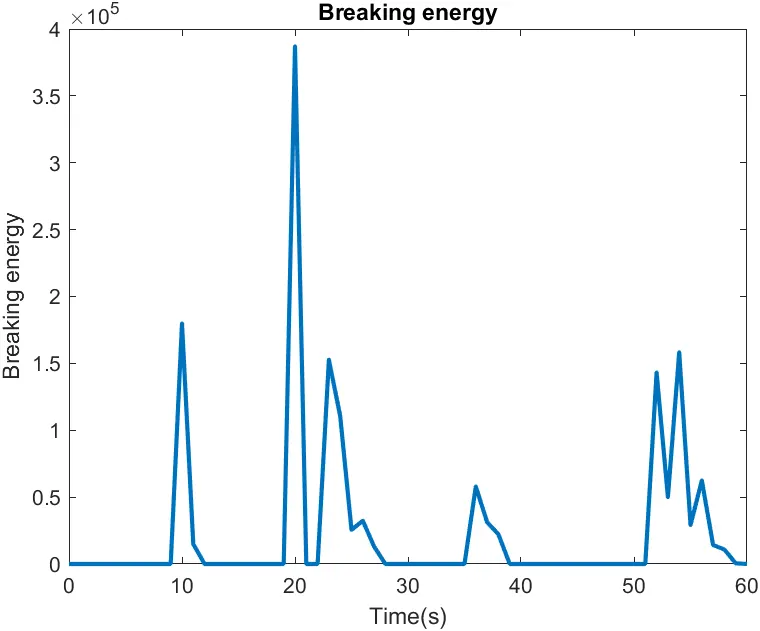
Breaking energy is 1496.1227 KWh
2. Why electric motor can’t develop braking torque at high speed similar to starting? How electric and mechanical brakes are coordinated?
Answer:
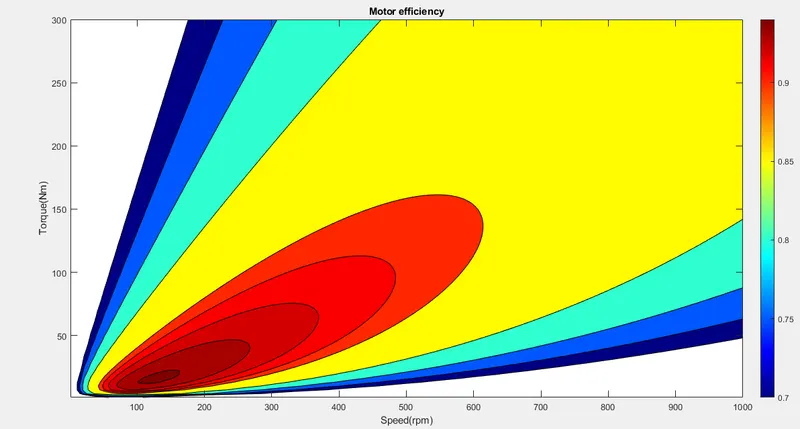
The speed-torque contour plot is shown below.
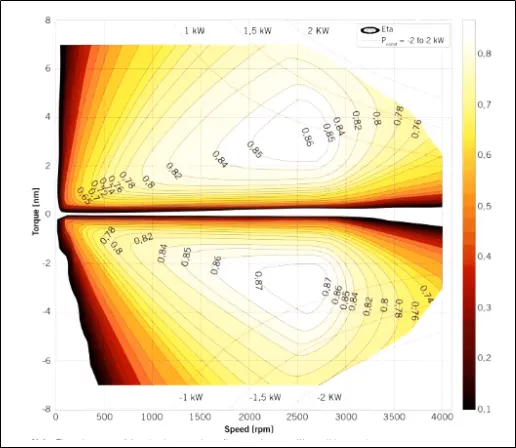
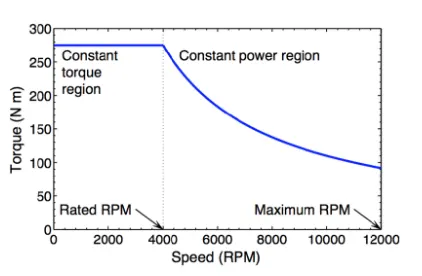
The electric motor produces high starting torque and low speed during acceleration. This torque remains constant below the critical speed, this region is known as the constant torque region. But as speed increases there will be a sudden drop in torque this region is known as the constant power region. Here Power will remain constant. When the motor starts decelerating, motor characteristics shits to the braking region. The motor speed is very high, the braking torque is low. Due to this electric motor can not develop braking torque at a high speed similar to starting.
Factors limiting the braking power generated during the regenerative braking are
- Braking power is not only limited by the motor's power rating, but by the charging power limit of the battery pack. The limits depend on the battery type & temperature.
- The kinetic energy of a slow-moving vehicle is low, this generates energy that does not overcome the motor & inverter losses.
- When the battery is fully charged regenerative braking is necessarily limited. The motor controller limits the regenerative torque.
Electric and mechanical brakes coordination:
Electric & mechanical brakes can be classified into two types based on the coordination.
- Series braking control
- Parallel braking control
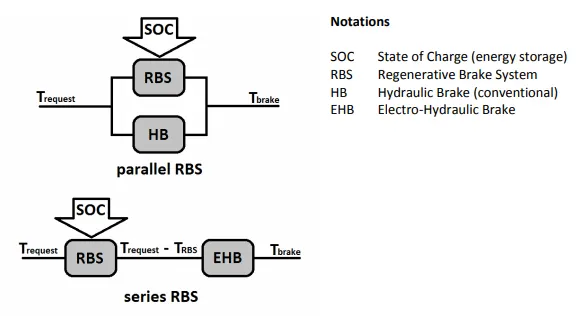
Series braking:
In series braking, the electric & mechanical brakes are applied one after another. This consists of a brake controller that controls the braking forces on the front & rear wheels. The main purpose of the series braking is to recover the braking energy as much as possible. So regenerative braking is operated before mechanical braking.
The series braking operation is based on passenger comfort and energy conversion efficiency.
Parallel braking:
Parallel braking is a combination of electric and mechanical brakes. In this case, both the regenerative brake & mechanical brakes are applied simultaneously. This has a fixed ratio of braking forces on both front and rear wheels, electric braking adds additional force on the front wheels.
3. Make a MATLAB program which plots contour of given motor speed, torque and efficiency values. Attach the code as a .m file attach a screenshot of all the plots.
Answer:
The losses in the motor are classified into four types
1. Copper loss:
Copper losses are given by I^2 * R loss. Torque is proportional to the current. So the copper loss is given as:
Copper loss = Kc * T^2
2. Iron loss:
Iron losses are due to magnetic losses.
Iron loss = Ki * ω
3. Windage loss:
This is a loss due to the friction between air and the rotor.
Windage loss = Kw * ω^3
4. Constant loss:
Constant losses in the motor are considered as C.
Total loss = (Kc * T^2) + (Ki * ω) + (Kw * ω^3) + C
Outpower can be calculated by multiplying the torque & velocity
Po = T * ω
So input power is sum of output power & losses.
Pi = Po + (Kc * T^2) + (Ki * ω) + (Kw * ω^3) + C
Code:
clc;
clear all;
V = linspace(1,1000); % Velocity
t = linspace(1,300); % Torque
Kc = 0.25; % Copper loss coefficient
Ki = 0.007; % Iron loss coefficient
Kw = 0.00002; % Windage loss coefficient
C = 20; % Contant loss
[W,T] = meshgrid(V,t); % 2D array
Po = W .* T; % Output power
CL = Kc * (T.^2); % Copper loss
IL = Ki * W; % Iron loss
WL = Kw * (W.^3); % Windage loss
Pi = Po + CL + IL + WL + C ; % Input power
Efficiency = Po ./ Pi ;
S = [0.7, 0.75, 0.8, 0.85, 0.9, 0.91, 0.92, 0.93, 0.94]; % Efficiency scale range
%plot
contourf(W,T,Efficiency,S)
colorbar
xlabel("Speed(rpm)");
ylabel("torque(Nm)");
title("Motor efficiency");
Output:
The motor efficiency is shown as a contour plot with speed & torque. Observed that the efficiency of the motor is more in the center (red region), gradually decreases as to move away from the center.