Week-11 Challenge: Braking
1)
Aim:
To calculate the energy required for braking.
Principle:
Braking:
- Under the braking condition vehicle starts decelerating i.e. the speed of the vehicles reduces.
- The function of the brake system is to stop the vehicle within the smallest possible distance.
- Hence it is done by converting the kinetic energy of the vehicle into the heat energy which is dissipated into the atmosphere.
E=(1/2)*m*v^2
Where,
m= mass of the vehicle
v= velocity of the vehicle
E= energy
Driving cycle:
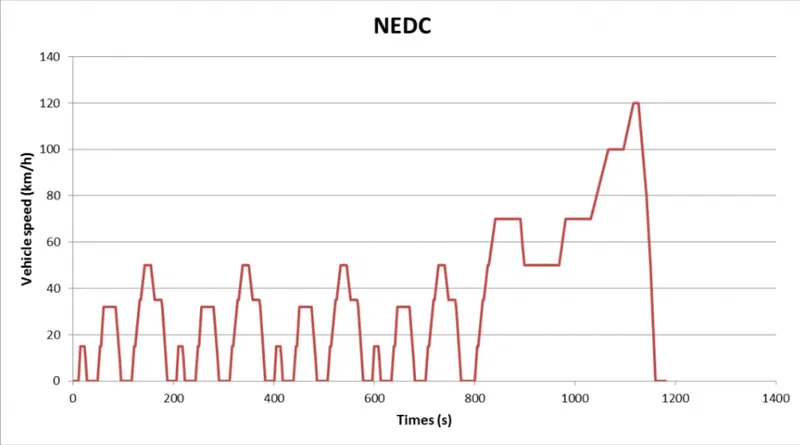
- A driving cycle is a series of data points representing the speed of a vehicle versus time.
- It is used to assess the performance of fuel consumption, vehicle autonomy and pollutants emission etc.
Excel Sheet:
Duty cycle:
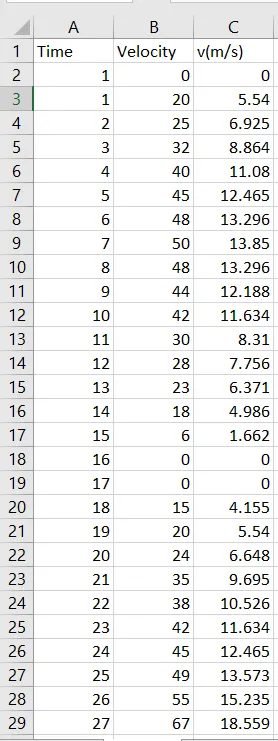
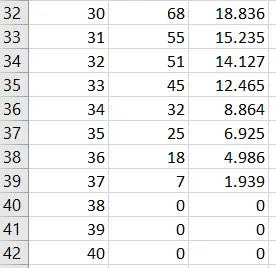
- The driving cycle is created for 40 intervals of time.
- The velocity from km/h is converted into m/s by multiplying it to 5/18.
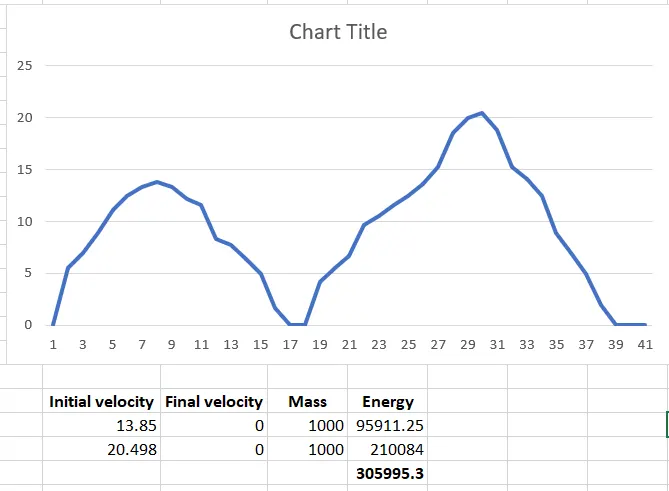
- The driving cycle curve obtained is plotted in graph.
- Energy required for braking is 0.5*m*v^2.
- The 1000 kg is considered as the vehicle mass.
- The initial velocity period is the time at which the vehicle starts to decelerate and reaches to zero.
- So in the above driving cycle twice the vehicle is decelerated.
Energy =0.5*m*(vi-vf)^2
where,
m=mass
vi=initial velocity
vf=final velocity

Braking1:0.5*1000*(13.85-0)^2
=95911.25J
Braking2:0.5*1000*(20.498-0)^2
=210084J
Total energy= 95911.25+210084
=305995.3 J- Hence for the driving cycle ,the energy required for braking is 305995.3 J.
Result:
Thus the energy required for braking for a defined driving cycle is done.
2)
Aim:
To find how the electric and mechanical brakes are coordinated.
Explaination:
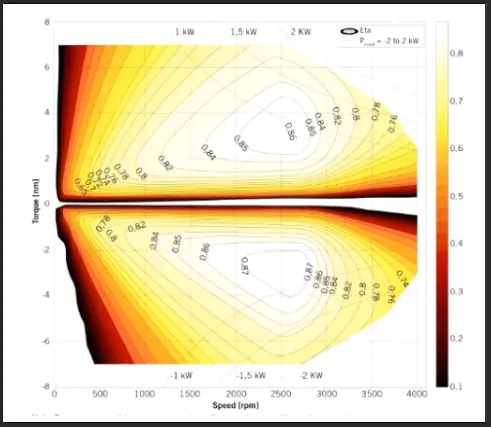
- The above image represents the speed-torque characteristics of an electric motor.
- At low speed, the torque maintained in the motor is constant leading to higher acceleration.
- As the speed increases the torque reduces , which is constant power region.
- And the value of torque obtained in deceleration is negative.
- So the peak acceleration torque and peak deceleration torque are not equal.
- From this it is clear that electric motor cannot develop braking torque at high speed similar to starting.
Brake control stratergies:
- Series brake control stratergies: In this the both mechanical and regenerative electric brake are operated one after the another.
- Parallel brake control stratergies:In this both the mechanical and regenerative electric brake are applied at a time.
Electric Driven Intelligent Brake:
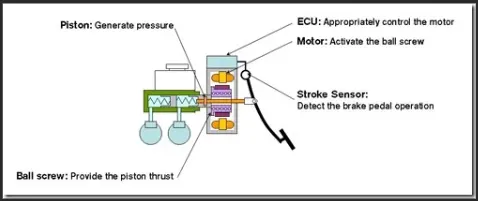
- The conventional power brake system derive vaccum from the engine intake manifold and use this energy to apply brake.
- This reduces drivers pedal force and it becomes highly responsive with easiness to operate.
- But the major disadvantage of the conventional power brake is that it puts load on the engine since the braking energy is extracted from the engine.
- Also the energy lost in stopping the vehicle goes waste.
- But in the Electric Driven Intelligent Braking System, the braking force is provided with the help of a ECU controlled motor and ball screw arrangement.
- So there is no direct load on the engine while applying brakes.
- A more controlled and uniform braking force is applied due to the usage of ECU controller.
- Thus helps to recover thr braking losses when a regenerative braking system is used.
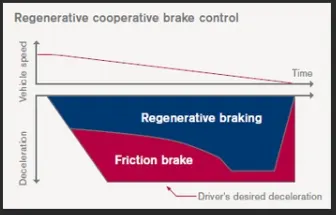
- It is the combination of regenrative braking and the friction brake.
- Both the regenerative braking and the friction brake are operated parallelly for the high speed of vehicle.
- At low speed the percentage of regenerative braking is high.
- So the torque produced is high when the vehicle is at low speed.
- Control signal must detect the either regenerative or friction brake from the pedal.
- And these control signal should be diverted to the brake cyclinder or regenerative brake to power converter.
Conclusion:
Thus the regenerative braking are efficient but it requires a customized 3 phase bidirectional power flow inverter to take power from the motor and feed it back to the battery.
3)
Aim:
To make a MATLAB program which plots contour of given motor speed, torque and efficiency values.
Principle:
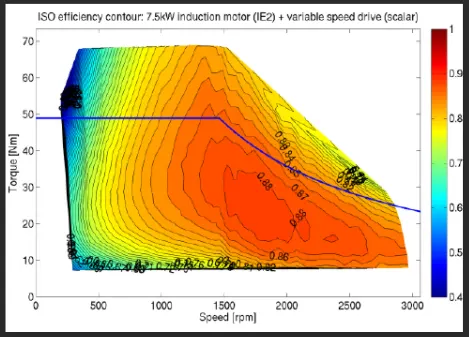
- A contour line of a function of two variables is a curve along which the fucntion has a constant value, so that the curve joins points of equal value.
- It is a plane section of three dimensional graph of the function parallel to the plane.
- The contour line is represented for the motor speed, torque and efficiency.
Efficiency contour plot:
Copper losses= I^2*R= kc*T^2
Iron losses= ki*w
Windage loss= kw*w^3
Constant losses= C
Total losses= (kc*T^2)+(ki*w)+(kw*w^3)+C
MATLab Script:
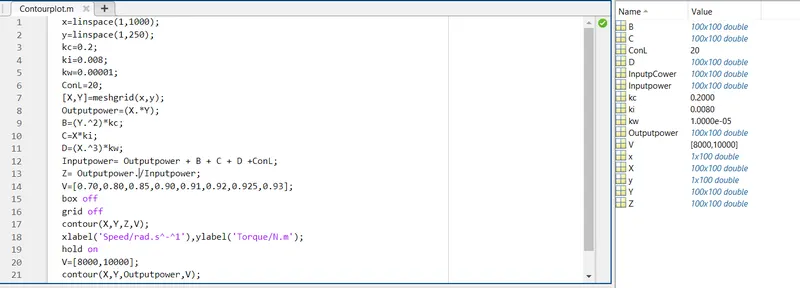
- The x axis is declared as speed upto 1000 rad/s.
- In the y axis torque is specified upto 250 N.m.
- The value of 0.2 is given as kc.
- The value of 0.008 is given as ki.
- 0.00001 for kw.
- 20 as constant motor losses.
- The product of torque and speed is done to obtain power.
- As per the formula the copper loss, iron loss and windage losses are calculated.
- The sum of output power and the losses gives input power.
- Z is the ratio of output power to the input power.
- To plot the efficiency , the contour values are given from 0.70 percent upto 93 percent.
- The graph is plotted along the X,Y,Z and V axis.
Output:
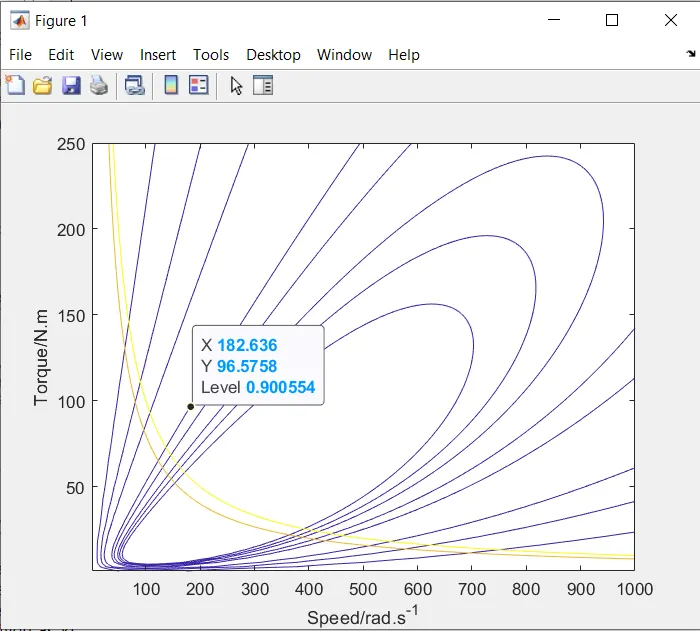
- The above image represents the contour plotting of the motor speed, torque and effciency.
- It X axis represents the speed upto 1000 rad/s.
- The Y axis represents the torque upto 250N.m.
- In the above image we can find the values of speed , torque and efficiency of the motor by clicking the desired curve.
- As per the point in the above image, the speed is 182.636 rad/s, 96.5758 N.m as the torque and 90.05 percentage as the efficiency.
Result:
Thus a MATLAB program is compiled in which the contour plots of motor speed, torque and efficiency values are plotted.
Attachment:
https://drive.google.com/file/d/1BoCyaMz5hIQ__CQ-sYUGUECA-yt9z7ik/view?usp=sharing