Week-11 Challenge: Braking
Part 1 Energy calculation required for braking-
I have created a drive cycle with help of excel and going to calculate total energy required for braking in this drive cycle-
| Time in secs | Speed in kmph |
| 0 | 0 |
| 1 | 5 |
| 2 | 10 |
| 3 | 20 |
| 4 | 30 |
| 5 | 45 |
| 6 | 50 |
| 7 | 50 |
| 8 | 50 |
| 9 | 55 |
| 10 | 58 |
| 11 | 60 |
| 12 | 60 |
| 13 | 60 |
| 14 | 60 |
| 15 | 60 |
| 16 | 60 |
| 17 | 60 |
| 18 | 60 |
| 19 | 56 |
| 20 | 55 |
| 21 | 54 |
| 22 | 52 |
| 23 | 50 |
| 24 | 48 |
| 25 | 45 |
| 26 | 42 |
| 27 | 40 |
| 28 | 36 |
| 29 | 35 |
| 30 | 30 |
| 31 | 25 |
| 32 | 20 |
| 33 | 20 |
| 34 | 20 |
| 35 | 20 |
| 36 | 20 |
| 37 | 20 |
| 38 | 20 |
| 39 | 20 |
| 40 | 28 |
| 41 | 32 |
| 42 | 37 |
| 43 | 40 |
| 44 | 44 |
| 45 | 49 |
| 46 | 50 |
| 47 | 55 |
| 48 | 58 |
| 49 | 62 |
| 50 | 66 |
| 51 | 66 |
| 52 | 70 |
| 53 | 72 |
| 54 | 72 |
| 55 | 72 |
| 56 | 72 |
| 57 | 72 |
| 58 | 72 |
| 59 | 72 |
| 60 | 72 |
| 61 | 75 |
| 62 | 75 |
| 63 | 75 |
| 64 | 75 |
| 65 | 75 |
| 66 | 75 |
| 67 | 70 |
| 68 | 66 |
| 69 | 60 |
| 70 | 58 |
| 71 | 55 |
| 72 | 52 |
| 73 | 50 |
| 74 | 46 |
| 75 | 40 |
| 76 | 36 |
| 77 | 36 |
| 78 | 36 |
| 79 | 36 |
| 80 | 36 |
| 81 | 36 |
| 82 | 39 |
| 83 | 44 |
| 84 | 46 |
| 85 | 50 |
| 86 | 50 |
| 87 | 50 |
| 88 | 55 |
| 89 | 59 |
| 90 | 60 |
| 91 | 60 |
| 92 | 60 |
| 93 | 60 |
| 94 | 60 |
| 95 | 60 |
| 96 | 60 |
| 97 | 60 |
| 98 | 60 |
| 99 | 60 |
| 100 | 60 |
| 101 | 60 |
| 102 | 60 |
| 103 | 58 |
| 104 | 54 |
| 105 | 49 |
| 106 | 40 |
| 107 | 35 |
| 108 | 32 |
| 109 | 26 |
| 110 | 20 |
| 111 | 20 |
| 112 | 15 |
| 113 | 15 |
| 114 | 15 |
| 115 | 15 |
| 116 | 10 |
| 117 | 10 |
| 118 | 10 |
| 119 | 0 |
| 120 | 0 |
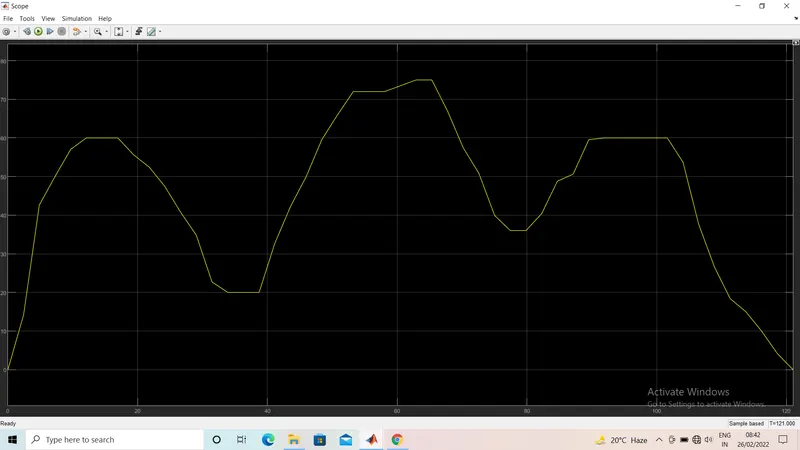
The drive cycle is for 120 seconds and there is three times deceleration, let find energy required during each deceleration-
Energy required = 0.5*mass of vehicle*(final speed - initial speed)^2
Let the mass of vehicle is 1000 kg-
After t = 18 sec vehicle applied brake and reached to speed of 20 kmph(5.56 m/sec) from 60(16.67 m/sec)kmph-
E1 = 0.5*1000*(5.56-16.67)^ = 61679.02 joule
After t = 66 sec vehicle again start decelerating and reached to speed of 36 kmph(10 m/sec) from 75 kmph(20.84 m/sec)-
E2 = 0.5*1000*(10-20.84)^2 = 58752.80 joule
After t = 102 sec the vehicle applied brake and stop from speed of 60 kmph(16.67 m/sec)-
E3 = 0.5*1000*(0-16.67)^2 = 138916.67 joule
Now total energy = E1+E2+E3 = 259348.48 joule = 259.35 kilojoule.
Power required = Total energy/ Total time
= 259.35 kilojoule/44 sec = 5.894 kW
Part 2 Reason for braking torque is less than starting torque-
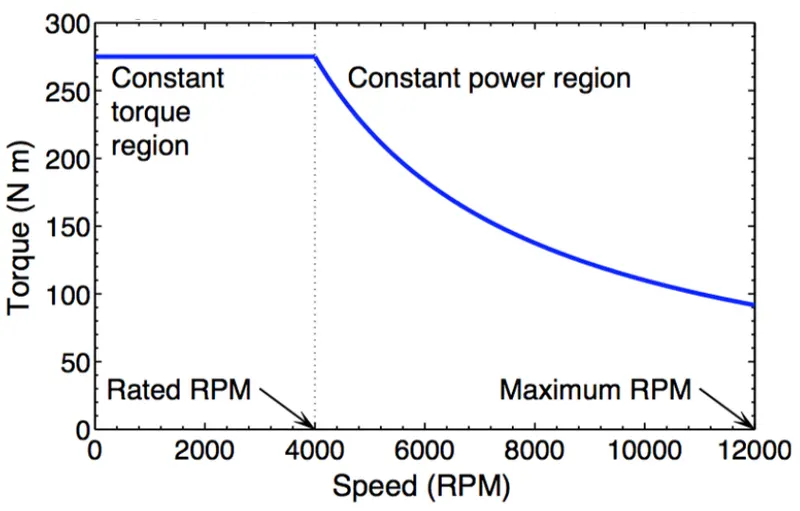
The operation range of an induction motor can be divided into three regions according to the output torque capability as
- •Constant torque region: speed range below the base speed
- •Constant power region: speed range above the base speed
- •Breakdown torque region: speed range above the base speed maintaining the maximum slip frequency
During starting the speed of motor is low and it operate in constant torque region as can be seen in figure below. So during starting we can get high value of torque due to low value of speed for same power input but at higher speeds the motor operates in constant power region i.e. we have limited supply of power and as value of speed is high so we get low torque at these operating points.
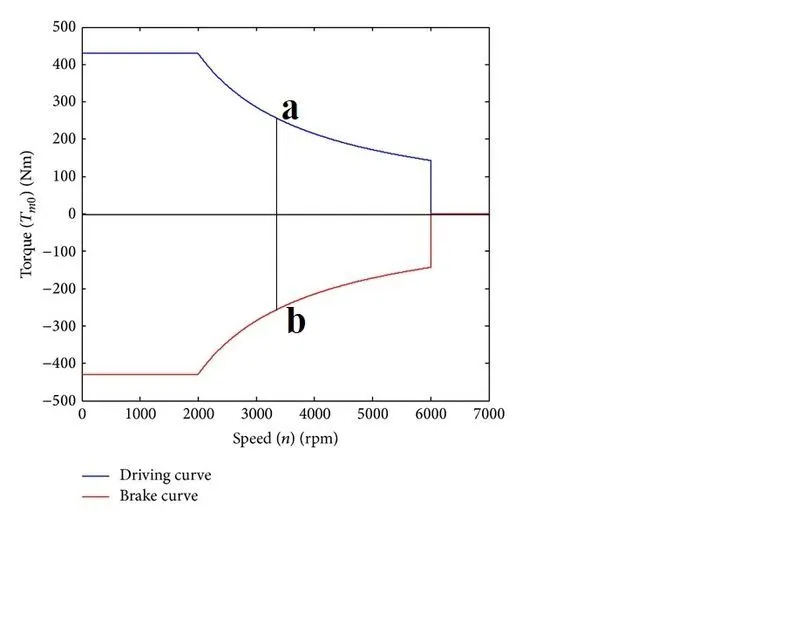
Let assume that the vehicle is running at point (a) and we suddenly apply brakes then this operating point goes to 4th quadrant i.e. point (b) and corresponding value of torque at point (b) is lower than starting torque as it is in constant power region.
The mechanical and electric braking system of intelligent vehicle is analyzed by the theory of vehicle braking stability. By reducing the participation of mechanical braking, the motor of the front and rear axle of the vehicle is in a better state of power generation. That, to ensure the braking efficiency of the vehicle, more braking energy is recovered. The dissipation of kinetic energy during braking, by an electric or hybrid vehicle can be recovered advantageously by controlling the power electronics for total energy management onboard the vehicle.Therefore, regenerative braking is an efficient technology to improve the efficiency of vehicles.
There is two method of coordinating electrical and mechanical braking-
1. Series control strategy : In series control only one brake is applied at a time and both brakes are applied in sequence i.e. one after another.
2. Parallel control strategy : In parallel control both brakes are applied at a time and contribution of both can be adjusted as required.
Part 3 Matlab program for contour ploting-
Here is the script for ploting contour in matlab-
% A program for plotting efficiency contours for electric motors.
w=linspace(1,720);% speed, N.B. rad/s NOT rpm
T=linspace(1,60); % 0 to 60 N.m
% Motor loss constants.
kc=1.5; % For copper losses
ki=0.11; % For iron losses
kw=0.00002; % For windage losses
ConL=20; % For constant motor losses
% Now make mesh
[X,Y]=meshgrid(w,T);
Output_power=(X.*Y); % Torque x speed = power
B=(Y.^2)*kc; % Copper losses
C=(X.*ki); % Iron losses
D=(X.^3)*kw; % Windage losses
Inputpower = Output_power + B + C + D + ConL;
Z = (Output_power)./(Inputpower);
% We now set the efficiencies for which a contour will be plotted.
n=[0.4,0.45,0.5,0.55,0.6,0.65,0.7,0.75,0.8,0.85,0.88];
box off
grid off
contour(X,Y,Z,n,'ShowText','on');
xlabel('Speed/rad.s^-^1'), ylabel('Torque/N.m');
title('Contour plot of speed, torque and efficiency','Color' ,'r');
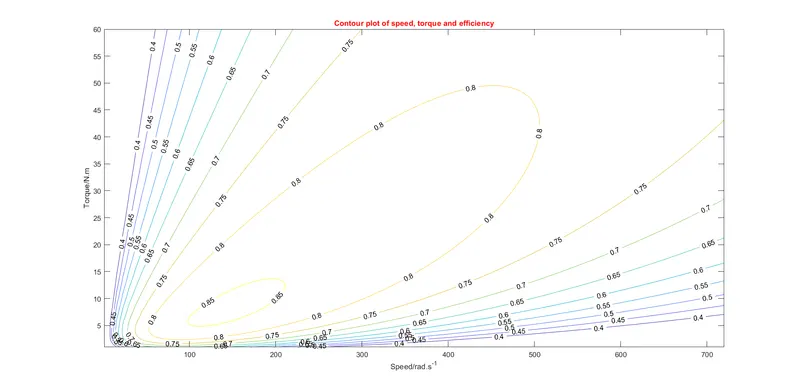
(Torque variation is from 0 to 60)
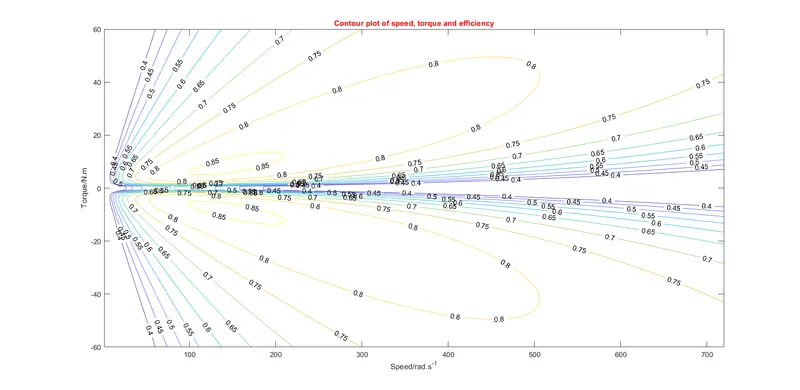
(Torque variation from -60 to 60)