Week-11 Challenge: Braking
Q1. For a defined driving cycle, calculate the energy required for braking.
>>Braking system is a mechanical system that increases the frictional resistance to reduce the speed of a moving vehicle or to bring it to rest at the shortest possible distance on a surface or to pull the vehicle against the gravitational force on an inclined surface.
>>There are 2 types of brakes are Foot brake (service brake) and Hand brake (safety brake)
>>Brakes must operate without interfering the steering action.
>>Brakes must be capable of decelerating the vehicle faster than engines could accelerate .
>>Generally brakes absorb energy three times of the engine horsepower energy.
>>During braking heat is dissipated in the form of Kinetic energy
>>Kinetic energy increases as the weigh increases and doubles as the speed increases.
KE=(1/2)(W/g)((U^2)-(V^2))
KE=(M/2)((U^2)-(V^2))
Where KE-kinetic Energy
M-Mass of the vehicle (Kg); W-Gross vehicle weight (N); g-acceleration due to gravity (m/s^2)
U-Initial velocity (m/s); V-Final velocity (m/s);
>> Kinetic energy at an instance, KE=0.5*M*(v^2)
>>A drive cycle is a set of data that represent the pattern of driving of a vehicle in a particular time period.
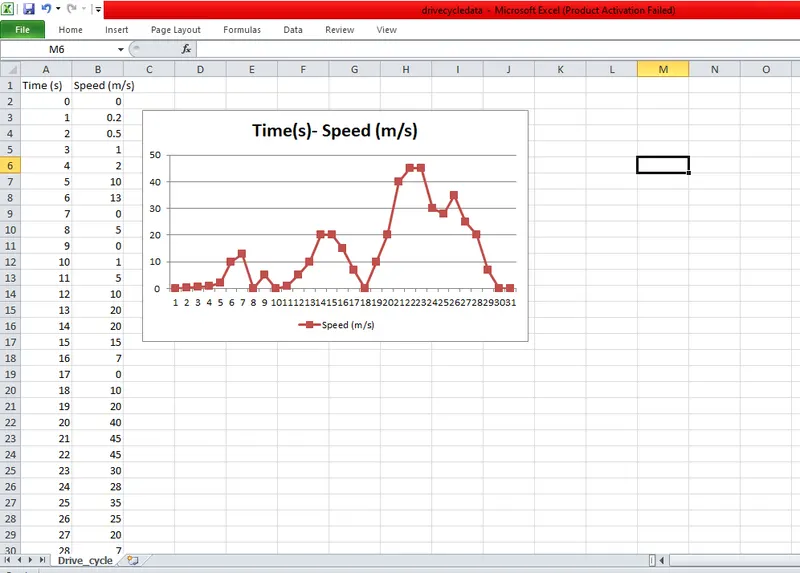
>>A drive cycle is created on the excel and imported in Matlab
>>A m-script is created to find & plot the brake energy
>>The following m-script is run.
M = 1000; %Vehicle mass
R=xlsread('drivecycledata');
t=R(:,1);%input time
v=R(:,2); %input speed (m/s)
for i=1:(length(v)-1)
if v(i)>v(i+1)
KE(i)=0.5*M*((v(i)-v(i+1))^2); %Braking Energy
end
end
fprintf('Total braking energy is %d', sum(KE));
fprintf('Average braking energy is %d', mean(KE));
figure(1);
subplot(2,1,1);
plot(t,v);
title('Drive cycle');
ylabel('Speed (RPM)');
xlabel('Time (s)');
subplot(2,1,2);
plot(KE);
title('Braking Energy');
ylabel('Braking Energy');
xlabel('Time (s)');
OUTPUT:
>> W11q1_tt
Total braking energy is 452000
Average braking energy is 1.558621e+04>>
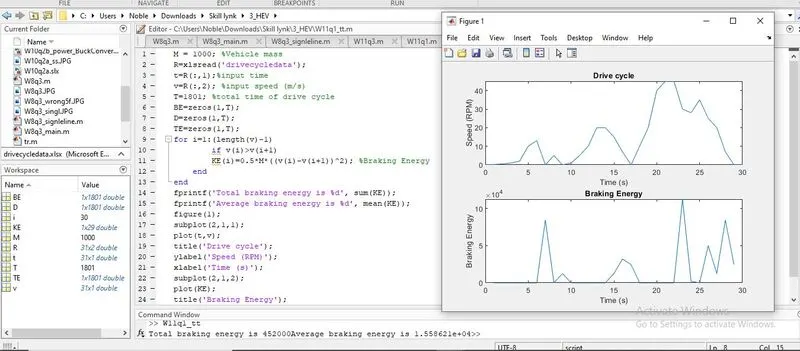
>>The graph is displayed showing the input time, speed & output braking energy.
Q2. Why electric motor can’t develop braking torque at high speed similar to starting? How electric and mechanical brakes are coordinated?
>>The electric motor can’t develop braking torque a higher speed similar to staring torque because the motor acts as generator as soon as the electric input stopped which in turn weakens the flux and reduces the torque
>>The 2 types of brakes in a vehicle are electrical Brake (Regenerative brake) & mechanical brake.
>>In mechanical braking system, the frictional resistance is increased to reduce the speed of a moving vehicle or to bring it to rest at the shortest possible distance on a surface or to pull the vehicle against the gravitational force on an inclined surface.
>>In electrical braking system, the excess kinetic energy dissipated while braking is recovered and stored by using the electrical motors as generators under braking condition. This reduces the wear & tear and increases the life of the braking system. It’s also called as regenerative braking.
*COORDINATION OF ELECRICAL & MECHANICAL BRAKING
>>Electric motors doesn’t have high torque handling capacity during braking, so mechanical brake is preferred during initial braking time.
>>As the braking torque starts to decrease, electric brake is preferred over mechanical brake.
>>There are 2 types of control strategies, they are:
*SERIES BRAKING CONTROL STRATEGY:
Series braking control is when mechanical & electrical brakes are applied one after the other.
Series braking control strategy is classified as 2 types, they are:
1.Series braking with optimal braking feel is to minimize the stopping distance & optimize the driver’s feel.
-When the commanded deceleration is less than 0.2g, only the regenerative brake on the front wheel is applied emulating the retarding function in the engine.
- When the commanded deceleration is greater than 0.2g, the braking force is applied on both rear & back wheels
-When the demanded braking force is less than maximum breaking force, regenerative force is used.
- When the demanded braking force is greater than maximum breaking force, mechanical force is used.
-At low speed, maximum torque is constant & at high speed, maximum torque decreases hyperbolically with speed.
- Series braking with optimal energy recovery is used to recover the possible braking energy when the demanded braking force is equal to maximum braking capacity of the brake
-When the braking is done with acceleration rate greater than 0.7g, then the regenerative braking force on both front & rear wheels are varied.
-When deceleration rate is smaller than road adhesive coefficient, the force demand is less and can be met by regenerative brake alone.
-When deceleration rate is equal than road adhesive coefficient, the force demand is met by maximum regenerative brake and the rest by mechanical force.
- When deceleration rate is greater than road adhesive coefficient, the force demand is met by both regenerative brake and mechanical brake equally.
*PARALLEL BRAKING CONTROL STRATEGY is built in such a way that the mechanical brake has fixed ratio mechanical braking force distribution on the front & rear wheels, where regenerative brake adds additional braking force to the front wheel.
-The mechanical braking force on front & rear axles are proportional to the hydraulic pressure in the master cylinder.
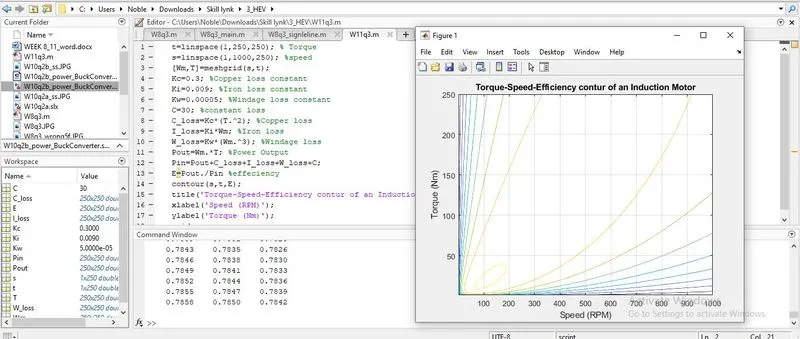
Q3. Make a MATLAB program which plots contour of given motor speed, torque and efficiency values. Attach the code as a .m file attach a screenshot of all the plots
>>The time and speed are taken as input array values using the command ‘linspace’
>>The time & speed values are combined using command ‘meshgrid’
>>Copper loss constant, Iron loss constant, windage loss constant & loss constant are the constant inputs taken.
>>Then the following formulae are given to calculate the losses:
Copper loss=Kc*(T.^2)
Iron loss=Ki*Wm
Windage loss=Kw*(Wm.^3)
>>Then he power output is calculated Pout=Wm.*T
Where Wm is the speed(m/s) and t is he time (s)
>>The input power is calculated by adding all the losses with poweroutput
>>Then the efficiency is calculated
>>The contour is plotted between the speed, torque & efficiency
>>then the m-script is run and the output graph is displayed
t=linspace(1,250,250); % Torque
s=linspace(1,1000,250); %speed
[Wm,T]=meshgrid(s,t);
Kc=0.3; %Copper loss constant
Ki=0.009; %Iron loss constant
Kw=0.00005; %Windage loss constant
C=30; %loss constant
C_loss=Kc*(T.^2); %Copper loss
I_loss=Ki*Wm; %Iron loss
W_loss=Kw*(Wm.^3); %Windage loss
Pout=Wm.*T; %Power Output
Pin=Pout+C_loss+I_loss+W_loss+C;
E=Pout./Pin %effeciency
contour(s,t,E);
title('Torque-Speed-Efficiency contur of an Induction Motor');
xlabel('Speed (RPM)');
ylabel('Torque (Nm)');
grid on