Week-11 Challenge: Braking
1. For a defined driving cycle, calculate the energy required for braking.
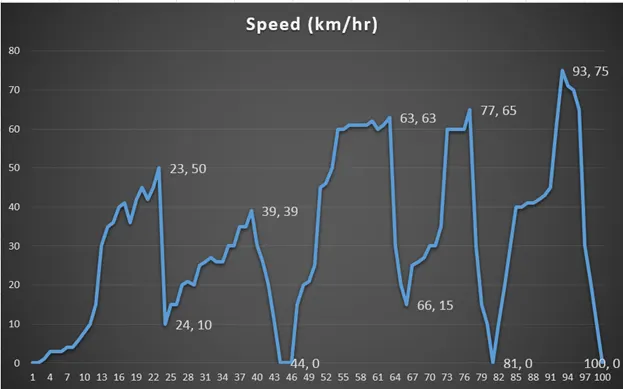
The above drive cycle is defined in the excel sheet and plotted. The peak speed and the speed after the braking is shown as it will helpful for calculating the energy required for the braking.
Basically the energy required for the braking is the energy to overcome the kinetic energy stored during vehicle is moving.
The kinetic energy is given by
`K.E = (1/2) *m*v^2`
Where
K.E = kinetic energy in joules
m = mass in kg
v = velocity of vehicle in m/s
The energy required for the braking is calculated as per the given points in the plot.
- Initial speed `v_i` = 50 km/h, final speed `v_f`= 10 km/h
Difference in speed v = 40 km/h
Let’s consider the mass of the vehicle is 1000 kg
Hence the energy required for the braking to bring down vehicle speed from 50 km/h to 10km/h for that interval is
40 km/h = 40*1000/3600 m/s = 40*(5/18) m/s
K.E = `0.5 * 1000 (40*(5/18)) ^2`
= 61728.39 joule = 61.72 k(watt-sec)
Hence,
The time required for the braking is 1 sec
K.E = 61.72 k(watt-sec/3600)
= 0.0171 kwh
- Initial speed `v_i`= 39 km/h, final speed `v_f` = 0 km/h
Difference in speed v = 39 km/h
Let’s consider the mass of the vehicle is 1000 kg
Hence the energy required for the braking to bring down vehicle speed from 39 km/h to 0km/h for that interval is
40 `(km)/h` = 39*1000/3600 m/s = 39*(5/18) `m/s`
- E = 0.5 * 1000 (39*(5/18)) ^2 joule
= 58.68 k(watt-sec)
Hence,
The time required for the braking is 5 sec
K.E = 58.68 k (watt 5 sec/3600)
= 0.081 kwh
Likewise, we can calculate for the remaining points
| Sr. | `v_i` km/h | `v_f` km/h | v km/h | Time required for braking(sec) |
Required Power (kw) 0.5 mv^2/(t*1000) |
Energy Required (kwh) (kw*t/3600) |
| 1 | 50 | 10 | 40 | 1 | 61.72 | 0.017 |
| 2 | 39 | 0 | 39 | 5 | 11.73 | 0.081 |
| 3 | 63 | 15 | 48 | 3 | 29.62 | 0.074 |
| 4 | 65 | 0 | 65 | 4 | 163.00 | 0.181 |
| 5 | 75 | 0 | 75 | 7 | 31.0 | 0.421 |
Total energy required for that driving cycle= 0.774 kwh
Q_2
Why electric motor can’t develop braking torque at high speed similar to starting?
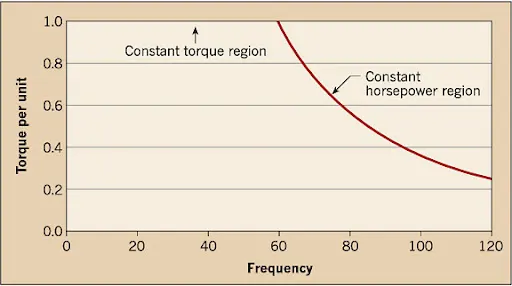
Above plot is for the constant torque and constant power region for a motor.
It shows that at the starting the unit torque is high for low speed.
Because of that the motor can produce higher torque at the starting results in higher acceleration.
Similarly, when motor is running at some higher speed in which it operates in the constant power region. And hence the developed torque is lower compared with the torque at the starting.
In the above figure it is shown that the speed below the 60Hz frequency operates in the constant torque region and it can produce unit torque in that region.
Above the 60Hz frequency operation the developed torque is less then unity and the breaks apply in that region produces the less torque compared with low speed.
How electric and mechanical brakes are coordinated?
There are two ways that electric braking and mechanical braking are coordinates:
- Series Braking
- Parallel Braking
- Series Brakes:
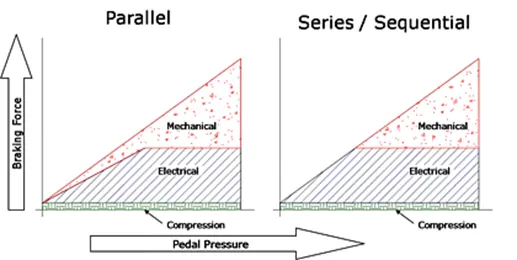
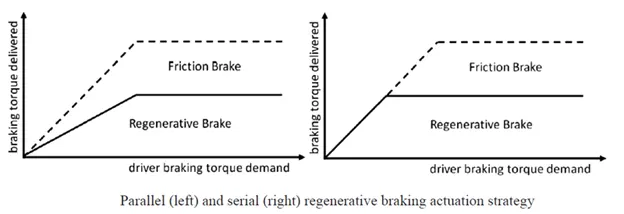
As shown in the figure the series braking is the type of braking in which the brakes are applied one after another. At a time only one brake is active either mechanical or regenerative braking.For this several modi
- Parallel braking
This type of braking is the braking in which the electric and mechanical braking both applied simultaneously, at same time. the brak padel pressure is results into the regenrative braking and friction bracking same time.
EDBI (Electric Driven Intelligent Brake): Nissan leaf has developed a EDBI which operates as shown in the below figure.
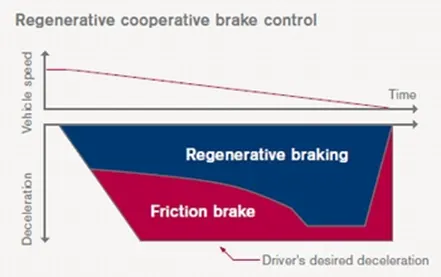
At high speed motor cannot produce high braking torque as acceleration torque for regenerative braking alone.
Hence at the high speed and high deceleration frictional brake has more contribution for braking.
But for low speed and low deceleration the regenerative braking has more contribution and motor can handle the desired deceleration only with help of regenerative braking.
3.Make a MATLAB program which plots contour of given motor speed, torque and efficiency values. Attach the code as a .m file attach a screenshot of all the plots.
what is contour plote?
Contour plote is graphical representation of 3D plot by slicing the Z axis. The contour plot is top view of the 3D plot with slicing of Z axis for defined values.
For making an contour for given motor speed , torque and efficiency value in the coding we need to define the different values for x and y axis.
speed is defined from 0 rad/sec to 1000 rad/sec and similarly torque value is defined from 0 to 300 Nm.
Although these are not practical but only taken for the plotting the contour for that given value.
Now, for getting efficieny for z axis we need to find input and output power.
`\eta % = P_(out)/P_i`
Input power can be found from torque
`P_(out)= T*omega_m`
and input power can be found from the adding output power with all the loses occurs in the motor.
and hence finally we can plot the contour of speed efficiency and motor torque by the contour(x,y,z) command.
And for abeling each contour the clabel(C) has used.
close all;
clear all;
clc;
% range for speed
omega_m = linspace(0,1000)

% range for torque
T = linspace(0,300)

% Loss coefficients
K_w = 2e-5;
K_i = 4e-3;
K_c = 0.1;

% defining the losses
[x,y]= meshgrid(omega_m,T)
C_loss = (y.^2)*K_c
W_loss = (x.^3)*K_w
I_loss =  x * K_i

P_out = x.*y ; % Output Power
P_in = P_out + C_loss + W_loss + I_loss


%Efficiency
Eff = P_out./ P_in ;

% Plotting the contour
n = linspace(0.75,0.95,10)
[C,h] =contour(x,y,Eff,n)
 clabel(C,'FontSize', 13)
 title('contour of speed, torque and efficiency values');
 xlabel('speed in rad/sec')
 ylabel('Torque in Nm')
Output Contour:
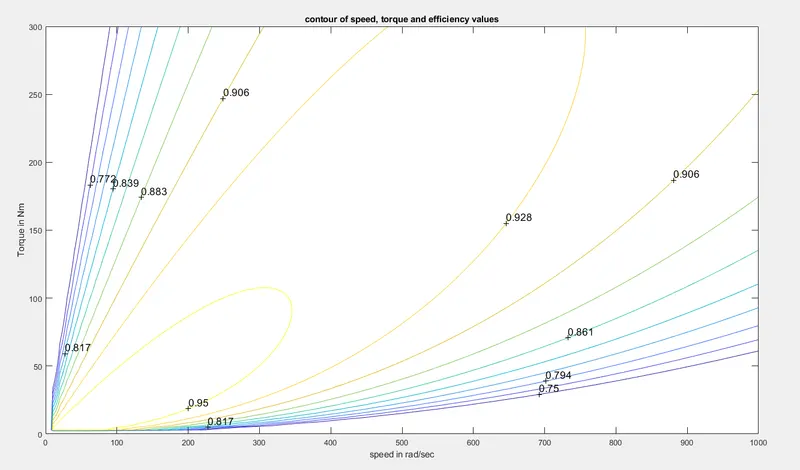
The output contour is plotted for the given motor. The top most contour plot line is for 0.95 efficiency. At the 0.95 efficieny the motor can produce more power compared with other lower efficieny as the power is product is speed and torque.