Week-11 Challenge: Braking
1. Question(1):-
For a defined driving cycle, calculate the energy required for braking.
Drive cycle :-
A driving cycle is a series of data points representing the speed of a vehicle versus time.
Driving cycles are produced by different countries to assess the performance of vehicles like fuel consumption its energy efficiency ,emissions,etc so that the vehicle can be tested as per standard drive-cycle,against which its performance is measured and compared for similar vehicles.
There are different driving cycle of different countries like :-
- Indian drive cycle :- IDC
- American driving cycle:- FTP-75
- Japanese driving cycle :- The 10-15 mode cycle
- European driving cycle :- NEDC
In electric vehicle drive cycle the energy efficiency is the main focus that is how much energy will a vehicle take per km(Wh/km).
It depends on how the vehicle travels and how much energy it takes .
Energy required will depends upon speed,acceleration,idling,decceleration.
Consider a drive cycle as shown below :-
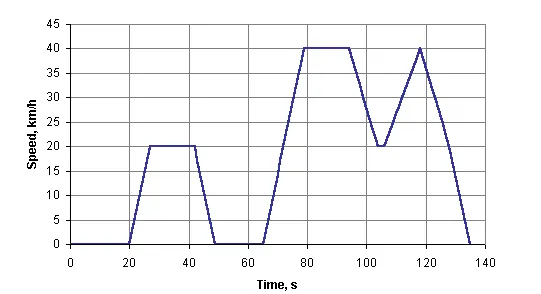
- Above drive cycle upto 140 seconds in which:-
- 0 to 20 seconds =Idling
- 20 to 25 second= Acceleration
- 25 to 40 seconds= constant speed
- 40 to 50 seconds=decceleration
- 50 to 65 seconds=idling
- 65 to 80 seconds=accelartation
- 80 to 95 seconds=constant speed
- 95 to 105 seconds =decceleration
- 105 to 108 seconds=idling
- 108 to 115 seconds =acceleration
- 115 to 135 seconds =deccelertaion
We have to calculate the energy required for braking that is during decceleration:-
Calculation for decceleration:-
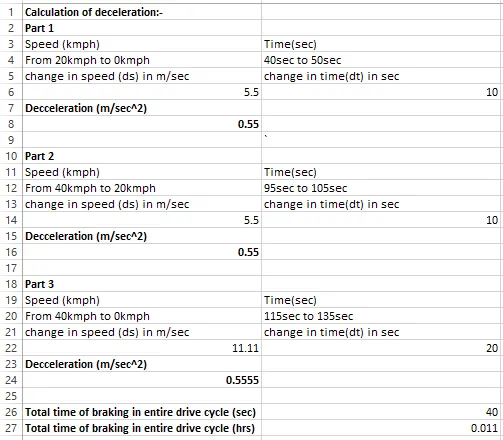
- As there are three times vehicle deccelerates so ot is divided into three parts .
- In part 1 the time from 40 to 50 sec and speed from 20kmph to 0 kmph.
- Part 2 the time from 95 to 105 sec and speed from 40kmph to 20kmph.
- Part 3 the time from 115 to 135 sec and speed from 40kmph to 0 kmph.
- Decceleration(m/sec^2)=change in speed(m/sec)/change in time(sec)
- m/sec=kmph/3.6
- Total time for braking during entire drive cycle is 40seconds=0.011hrs.
Calculation for power required during decceleration:-
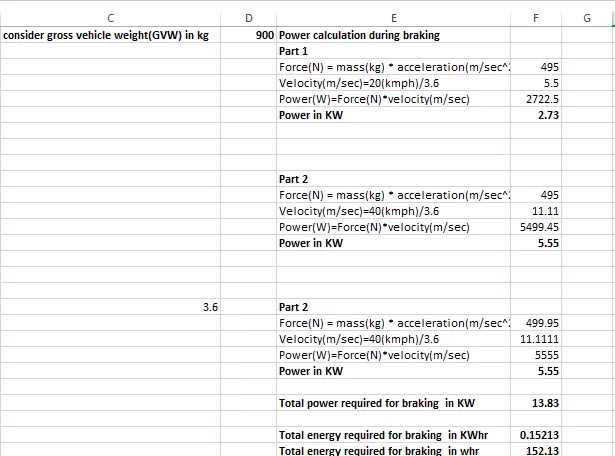
- Consider the gross vehicle weight (GVW) =900kg.
- Calculation of power is done part wise .
- Power(W)=Force(N) * velocity(m/sec)
- Force(N)= Mass(kg)* acceleartion(m/sec^2).....(In formula acceleration is written but during calculation deccelration value is consider that is negative acceleration) .
- As total power required for braking is 13.83 KW
- So, Total energy required for braking = Total power required for braking *Total time for braking
- Total energy required for braking(Kwhr) = 13.83*0.011=0.15213
- Total energy required for braking(whr) = 152.13
2. Question(2):-
a. Why electric motor can’t develop braking torque at high speed similar to starting?
Answer of this question is discussed based on example of dc motor.
As general equation of dc motor is given by:-
V= (K*ϕ)+I*ra.......E=k*ϕ
Torque(T) = K*I ...linear relation
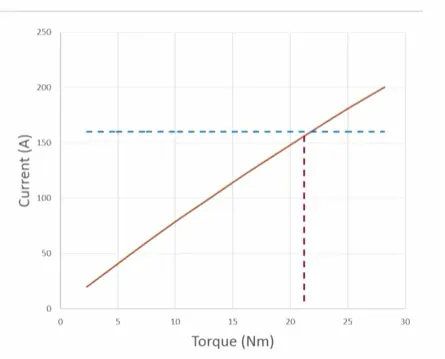
That is if current increases torque also increases and if it reaches the current limit then torque limit also reached so this point is called as rated torque.
Similarly as speed of the motor increases the back emf of the motor also increases so to compensate this the supply voltage has to increase,because if backemf is more than supply voltage then it acts as generator.
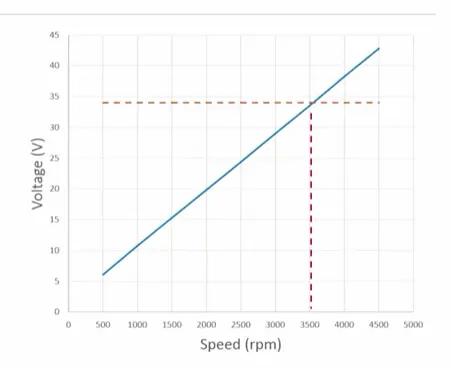
If we take an example as battery voltage is limited to 34 volts so we can increase the speed upto that limit point because beyond this we are not able to make back emf more than V. So, the speed corresponds to this point is called rated speed .And all this operation is done by taken into consideration as load current is constant and it is set to 160A and it gives rated torque of 22 Nm.
Now suppose we want to increase the speed beyond rated speed as we have reached battery voltage limit of 34 volt ,So we have to reduce the current results in decrement in torque .
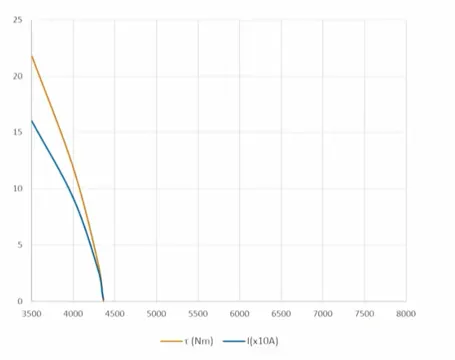
Here we can see the current and torque can drastically reduce and now we are not in constant torque region .
Torque-Speed characeristic of motor is shown below :-
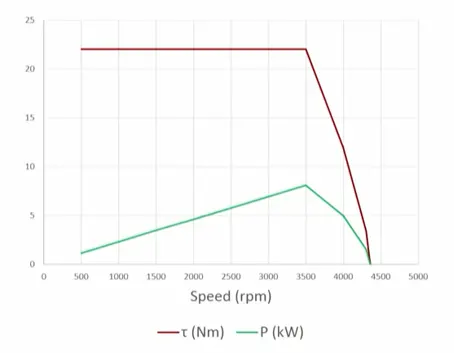
Here it is seen upto 3500RPM we have reached voltage limit of 34 volts with 22 Nm torque at 160A current and we are in constant torque reagion.
But as we increase the speed beyond rated that is at higher speed the torque goes on decreasing and also power decreases.
And if we want to brake the motor in this region that is at higher speed region we get a little torque to brake the motor than to brake the at lower speed or at starting.
b. How electric and mechanical brakes are coordinated?
Braking is one of the most important factor to look upon. . In order to stop the system in cases of emergency,in order to ensure that the system remains stationary when not in operation and in order to follow the correct speed-time profile.
There are two types of braking systems are employed in most drive systems: electrical and mechanical braking.
Electrical braking:-
In electrical braking the speed control of any motor is done through the control of flux and torque production.
But the main idea but behind each type of electrical barking is the reversal of the direction of the flux.
But we can divide braking in to three parts mainly, which are applicable for almost every type of motors.
Regenerative Braking.
Plugging type braking
Dynamic braking.
Mechanical braking:-
In mechanical braking the speed of the machine is reduced solely by mechanical process .
There are four types of mechanical brakes used :-
Drum brakes.
Disk brakes.
Band brakes.
Pawl and Ratchet brakes
How electrical and mechanical brake are co-ordinated is explained by brake control strategy:-
Broadly there are two types of brake control strategy that are series and parallel.
Series brake control strategy:-
In this as the the name series that is one after the other brakes are applied that is one brake at a time .
We can apply first regenerative braking and then mechanical braking or vice -a-versa .
This further divided into two types :-
Series optimal feel:-
In this the control objective is to minimize the stopping distance and optimize the driver’s feel.
Series optimal energy recovery:-
The principle of the series braking system with optimal energy recovery is to recover the braking energy as much as possible in the condition of meeting the total braking force demanded for the given deceleration
Parallel brake control strategy :-
In this strategy the regenerative and mechanical brakes are apllied simultaneously that at the same time.
In this braking system has a conventional mechanical brake which has a fixed ratio of braking force distribution on the front and rear wheels. Regenerative braking adds additional braking force to the front wheels, resulting in the total braking force distribution curve.
3. Question(3):-
Make a MATLAB program which plots contour of given motor speed, torque and efficiency values. Attach the code as a .m file attach a screenshot of all the plots.
In this question we are plotting the torque-speed -efficiency contour of an motor.
Performance of the motor is seen from its torque-speed characterists it exhibits for different type of loads .
Efficiency is one of the important parameter for motor ,as it directly relates with its performance.
There are some typical losses which are common in all types of motor that are :-
- Copper losses = I^2*R as Torque is proportional to current so, copper loss =kc*T^2.
- Iron losses=ki*w.....(as w=speed)
- Windage loss = kw*w^3
- And other constant loss=cl
So, total losses =(kc*T^2)+(Ki*w)+(kw*w^3)+cl
Efficiency of motor =output power/Input power
Output power = Torque*Speed
Input power = Output power+Losses
Matlab program for plot of contour of torque-speed-efficiency are as follows :-
clc
x=linspace(1,800);                      % It is speed vector 1 to 800 rad/sec
y=linspace(1,200);                      % It is torque vector from 1 to 200 Nm
[X,Y]=meshgrid(x,y);                    % It is a meshgrid function which generate grid matrix X and Y
kc=0.2;                                 % Copper loss constant
ki=0.008;                               %Iron loss constant
kw=0.00001;                             %Windage loss constant
cl=20;                                  % other constant
B=(Y.^2)*kc;                            % copper loss
C=(X.*ki);                              %Iron loss
D=(X.^3)*kw;                            %Windage loss
outputpower = Y.*X;
inputpower = outputpower+B+C+D+cl;
E= outputpower./inputpower;             %efficiency
V=[0.75,0.80,0.85,0.90,0.92,0.94,0.96]; %This vector represent the set values of efficiency whose contour are to be plotted
box off
grid off
contour(X,Y,E,V);                       %Function to plot contour
xlabel('speed in rad/sec');             %Label x axis
ylabel('Torque in Nm');                 %Lbel y axis
title('contour plot of speed,torque and efficiency');
- x and y are the evenly spaced vectors are created.
- x represents speed axis in rad/sec and y represents torque in Nm.
- Then by using meshgrid function a mesh is created . In X vector contains copy of x points and in Y vector contains copy of y points.
- The values of all loss contants are defiend.
- As efficiency is calculated as output power/input power which is disscussed above.
- V vector is created as it contains some points which defined which efficiency contour we want.
- To plot contour use contour() as function .
- To label the x and y axis use xlabel() and ylabel() as function and for title use title().
Contour plot is shown below :-
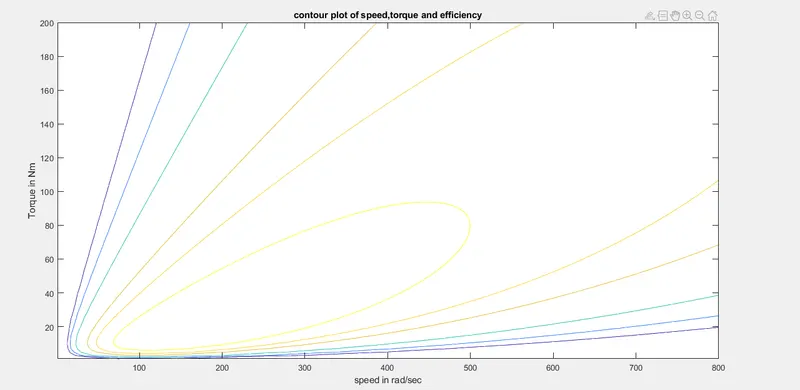
- In this on X axis speed points are plotted in rad/sec .
- And on Yaxis torque points are plotted in Nm.
- The different -different curve shown are called as contour which tells about the different efficiency we get as we take in vector V.
- On each contour the efficiency is same.