Week-11 Challenge: Braking
1. For a defined driving cycle, calculate the energy required for braking.
What is drive cycle?
- A Driving Cycle is a series of data points representing the speed of a vehicle vs. time. Driving cycles are produced by different countries and organisations to access the performance of the vehicles in various ways, as for example fuel consumption and polluting emissions.
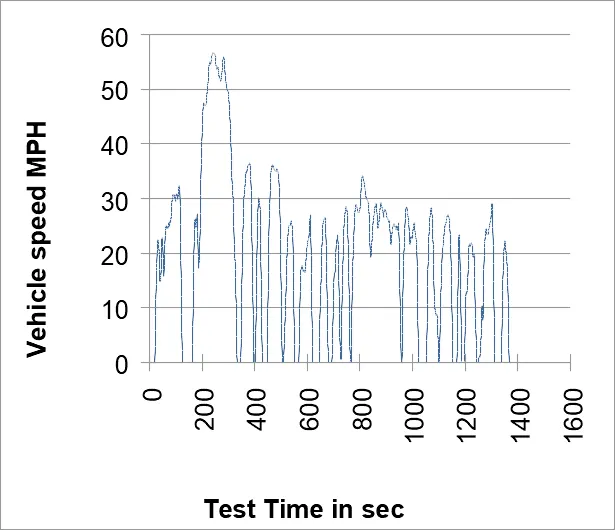
- There are many defined Drive cycles are present for this we have taken the UDDS (Urban Dynamometer Driving Schedule) as our reference Drive cycle.
- To calculate Braking power for UDDS drive cycle we need below mentioned forumulas.
Braking Energy:
- To accelerate a vehicle we need some Energy to accelerate, like the same to brake the vehicle we need some energy to brake.
- In acceleration the velocity changes from initial to final velocity value. While Braking the velocity changes from Final value to initial value or 0.
- So, in this case of Braking, the Kinetic Energy is given by,
- Braking Energy = 1/2 * M * (Vf - Vi)^2
where
M - Mass of the vehicle
Vi - Initial velocity
Vf - Final velocity
- The mass of the vehicle is assumed to be 1000 kg and the Total time period of this UDDS Drive cycle is 1369 Seconds.
- From the drive cycle data file, wherever the Deceleration occurs we can say that the Braking occurs and in those parts.
- By using the brake enery formula we can find the baraking energy in those parts and adding all the deceleration part throughout the drive cycle, we can get the Total Braking Enrgy required for one cycle.
- A MATLAB program is used to calculate the Braking Energy required for the UDDS Drive cycle.
UDDS drive cycle graph is shown below:
Matlab codes to calculate Braking energy:
close all
clc
% Mass of the vehicle
M = 1000;
% Total Time period of the cycle
T = 1369;
% Drive cycle data
A = readmatrix('Urban Dynamometer Driving Schedule.xlsx');
% Time of Drive cycle in seconds
time = A(1:T,1);
% velocity in mph
velocity = A(1:T,2);
% converting velocity from mph to m/s
v = velocity.*0.4470;
% Creating same length vectors for values storage.
Braking_energy = zeros(1,T);
for i = 1:(length(v)-1)
if v(i) > v(i+1)
Braking_energy(i) = 0.5*M*((v(i))^2 - (v(i+1))^2) / 3600;
end
end
fprintf('The Total Braking Energy Required For UDDC Drive cycle is %3f W.h',sum(Braking_energy))
The Total braking energy required for one cycle of UDDS Drive cycle is 582.79 Watt.Hour.
2. Why electric motor can’t develop braking torque at high speed similar to starting? How electric and mechanical brakes are coordinated?
Electric Motor Braking:
- The electric motor braking is also known as Regenerative Braking, which is an energy recovery mechanism that slows down a moving vehicle or object by converting its kinetic energy into a form that can be either used immediately or stored until needed.
- When we press the brake pedal, we cut off the power supply to the motor and now the motor will be in rotation due to its inertia.
- As this rotation is happening inside the magnetic field a Back Emf is generated which produces a negative Torque and that is used as the brakes to reduce the vehicle speed.
- Also the current flows in reverse direction, Using a Bi-directional Inverter we can store the current back into the battery.
- This process of Braking by the effect of negative Torque produced and where the motor acts as a generator in producing the current out of the motor's rotation and storing it back into the battery is called Regenerative braking.
- Speed and Torque Characteristics graph of a DC Motor is shown below.
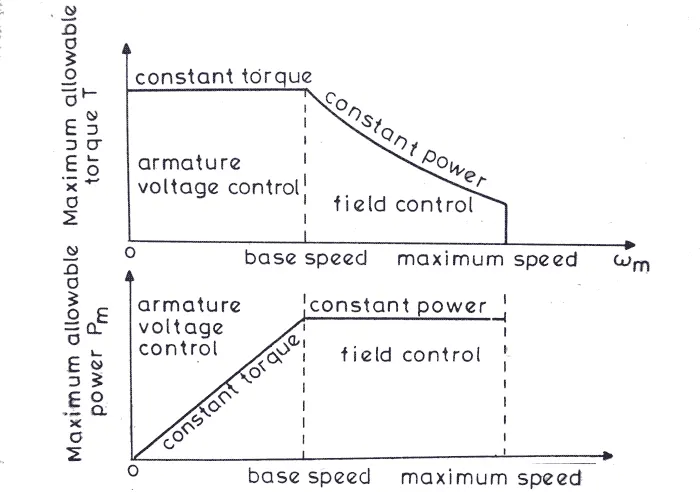
- From the above figure we can see the speed and torque behaviour of a electric motor.
- During the initial time period speed is low and the Torque is high which is the constant Torque region. As speed builds up, after the Critical speed point the torque gradually decreases which is known as constant Power region.
- So during high speed time the motor will be at constant power region and while braking, due to high speed of the motor the negative torque produced will be less.
- But while starting the motor, the speed will be very less and at this stage the motor will be operating in constant torque region and this is the reason for High accelerating torque during the start time of motor.
- From this we can say that the Braking torque produced at High speed motor operations will be lesser than the starting Torque of an Electric motor.
- Also there are other reasons like Battery Limitations due to which we cannot get High braking torque.
- The rate of discharge is always higher than the rate of charging due to the battery's chemical compositions.
Co-ordination of Electric and Mechanical brakes:
- Motor of electric vehicle is able to be used to brake regeneratively, so braking energy can be recycled.
- Braking stability of electric vehicles with electro-hydraulic hybrid braking system can be influenced by braking force distribution between hydraulic braking force and regenerative braking force
- Due to presence of regenerative braking in EV’s, It substantially reduce the need for hydraulic braking.
- But there are some limitations like, the maximum deceleration with the engine alone is far smaller than with brake assistance.
- So you still need an ordinary Frictional brake system to make the car stop instantly if required.
- When the regenative capacity is less than the actual braking required, mechanical brakes are applied at those times.
Brake control Strategy:
- When the brake pedal is pressed the control signal is sent to both the Hydraulic cylinder and power converters for producing both Frictional Braking and Regenerative braking.
- There are two ways of applying the combination of brakes and they are classified as,
1. Series braking- The Regenerative braking and Frictional braking are applied one after another.
2. Parallel braking - The Regenerative braking and Frictional braking are applied at the same time
The series braking and parallel braking is chosen based on two parameters, one is Driver's comfort and other one is based on the Efficiency.
3. Make a MATLAB program which plots contour of given motor speed, torque and efficiency values. Attach the code as a .m file attach a screenshot of all the plots.
Contour plot: A contour plot is a plot which represents heights in Two-dimensions figure.
In a operating motor there are various types of losses are occur they are mentioned below.
1. Copper losses.
2. Iron losses.
3. Windage losses.
4. Constant losses.
1. Copper losses :
Copper losses are given by (I) ^2*R
Where, R = Armature resistance.
In DC motor we already know Torque(T) is dirctly propotional to Current(I) so the copper loss is considered as Kc*(T)^2
Where, K is to take care of resistance of brushes & also to take care of flux and its effect.
Hence Copper Losses = Kc*(T)^2
2. Iron losses:
Iron losses (or) magnetic losses= Ki*ω
where Ki is the factor based on magnetic field effect.
3. Windage losses:
These are the mechanical or friction Windage losses. This is based on size and shape of the motor.
Windage losses = Kw*ω
4. Constant losses:
In all the motor there are some constant losses happening and it is denoted as C.
5. Total losses :
The total losses are given by,
Total Losses = Kc*(T)^2+ Ki*ω + Kw*ω + C.
Output Power = Input Power - The Total Losses.
Finally the Efficiency of the DC Motor is given by, Efficiency = Output Power / Input Power.
Matlab code:
close all
clc
% The Torque and Velocity Range of the motor
Torque = linspace(0,250);
Velocity = linspace(0,1000);
% copper Loss constant
kc = 0.2;
% Iron loss constant
ki = 0.008;
% windage loss constant
kw = 0.00001;
% constant motor loss
c = 20;
% Creating 2D Array for torque & velocity
[W,T] = meshgrid(Velocity,Torque);
output_power = (W.*T);
% Loss calculations
copper_losses = kc*(T.^2);
Iron_losses = (W).*ki;
Windage_losses = (W.^3)*kw;
% Power and Efficiency calculations
Input_power = output_power + copper_losses + Iron_losses + Windage_losses + c;
Efficiency = output_power./Input_power
% Efficieny curves values range
V = [0.70,0.75,0.80,0.85,0.875,0.90,0.91,0.92,0.93]
% Plotting the Contour for Speed, Torque and Efficiency
box off
grid off
contourf(W,T,Efficiency,V);
colorbar
xlabel('Motor speed (RPM)');
ylabel('Torque (Nm)');
zlabel('Efficiency');
title('Contour of given motor speed, torque and efficiency')
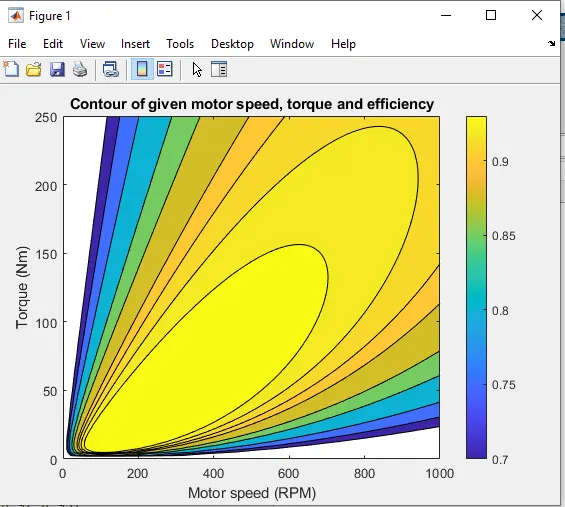
Output contour plot for the given motor data: