Week-11 Challenge: Braking
1) Braking:
The term braking comes from the term brake. We know that brake is an equipment to reduce the speed of any moving or rotating equipment, like vehicles, locomotives. The process of applying brakes can be termed as braking. we can classify the term braking in two parts
- Mechanical Braking
- Electrical Braking
Kinetic energy, form of energy that an object or a particle has by reason of its motion. Translational kinetic energy of a body is equal to one-half the product of its mass, m, and the square of its velocity, v, or 1/2mv2.
For calculating the energy required for braking,
Prepare the excel sheet with the Time and Velocity as follow;-
|
Time |
Velocity(kmph) |
Velocity(m/s) |
|
0 |
0 |
0 |
|
1 |
20 |
5.555555556 |
|
2 |
35 |
9.722222222 |
|
3 |
50 |
13.88888889 |
|
4 |
65 |
18.05555556 |
|
5 |
80 |
22.22222222 |
|
6 |
95 |
26.38888889 |
|
7 |
105 |
29.16666667 |
|
8 |
120 |
33.33333333 |
|
9 |
80 |
22.22222222 |
|
10 |
65 |
18.05555556 |
|
11 |
90 |
25 |
|
12 |
100 |
27.77777778 |
|
13 |
110 |
30.55555556 |
|
14 |
115 |
31.94444444 |
|
15 |
120 |
33.33333333 |
|
16 |
120 |
33.33333333 |
|
17 |
120 |
33.33333333 |
|
18 |
120 |
33.33333333 |
|
19 |
120 |
33.33333333 |
|
20 |
120 |
33.33333333 |
|
21 |
100 |
27.77777778 |
|
22 |
80 |
22.22222222 |
|
23 |
110 |
30.55555556 |
|
24 |
115 |
31.94444444 |
|
25 |
115 |
31.94444444 |
Matlab script:
clc
mass=1000;
num=xlsread('SpeedTimeValues.xlsx');
Time=num(:,1);
Vel=num(:,2);
E=zeros(1,100);
for i=1:(length(Vel)-1)
if Vel(i)>Vel(i+1)
E(i)=0.5*mass*(Vel(i)-Vel(i+1))^2;
end
end
fprintf('Braking Energy is %d',sum(E));
fprintf('Average Braking Energy is %d',mean(E));
figure(1)
subplot(2,1,1)
plot(Time,Vel,'linewidth',3,'color','b')
xlabel('Time in sec')
ylabel('Velocity in m/s')
title('DriveCycle')
hold on
subplot(2,1,2)
plot(E,'linewidth',3,'color','r')
xlabel('Time in sec')
ylabel('Energy in J')
title('Braking Energy')
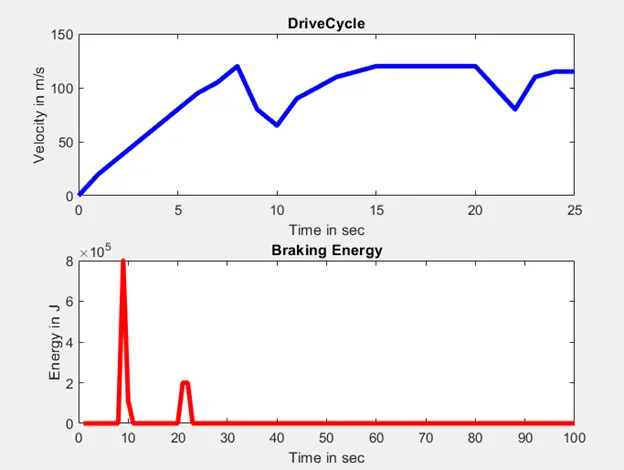
The energy required for braking is obtained by the change in the velocity. From the above script, the average energy required for braking is obtained.
Conclusion:
The braking energy obtained is shown as below;

By running the script, the below plot is obtained.
2)Electric motor braking:
Aim: To describe Why electric motor can’t develop braking torque at high speed similar to starting and how electric and mechanical brakes are coordinated?
Description:
In a battery-powered electric vehicle, regenerative braking (also called regen) is the conversion of the vehicle’s kinetic energy into electrical energy stored in the battery, where it can be used later to drive the vehicle. It is braking because it also serves to slow the vehicle. It is regenerative because the energy is recaptured in the battery where it can be used again.
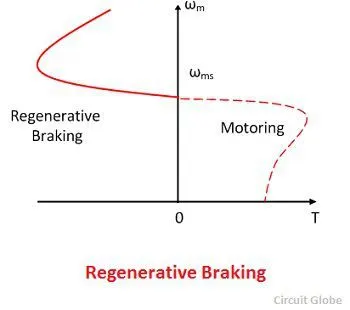
Brake torque is the force applied at the brake wheel to stop the motion of the moving vehicle. Unfortunately, Electric motor can’t develop braking torque at higher speed similar to starting because Braking torque applied in the opposite direction of the rotation. We can use a mechanical brake to produce a braking torque.
Regenerative braking takes place when the speed of the motor exceeds synchronous speed,so the motor becomes the generator and generates the electrical energy which can be stored in the battery and supply to load.
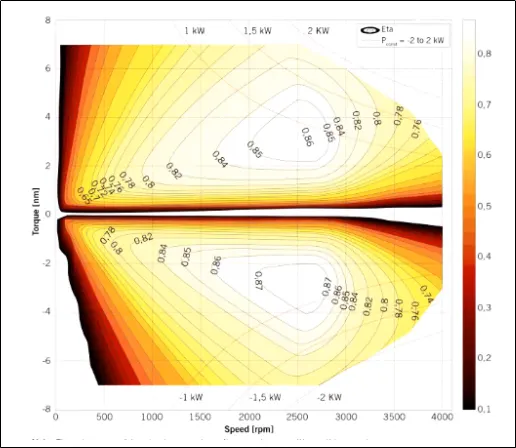
From the above graph, shows that the motoring and the braking are mirror images. But, found that Peak acceleration Torque and Peak deceleration torque are not equal. For acceleration, we usually have high torque for low speed and low torque for high speeds .It shows that , the motor producing torque 7NM for acceleration cannot produce -7NM for braking. Motor is operated in the field weakening region or above base speed, so that the torque is compromised. So the braking torque of motor is not as high as Acceleration.
We can conclude from above that Electric motor can’t develop braking torque at high speed similar to starting
Braking in Electric Vehicle:
There are two types of braking in the EV. One is regenerative/Electrical Braking and the other is mechanical braking. We can apply series of electrical and mechanical brakes or both at the same as per the requirement. In Practical cases, both the brakes are applied. The combined /singular response of the brakes are called Brake control Strategies.
Series: Here, the Electrical and the Mechanical brakes are applied one after the other. Either Mechanical applied after the Electrical brakes or Vice Versa. This brakes are applied based on either comfort of the driver or Energy requirements. If needs to be more comfort, then compromise with energy. If Energy requirement is priority, need to compromise with comfort.
Parallel: The Electrical and the Mechanical brakes are applied at a time simultaneously.
Electrical Driven Intelligent Braking:
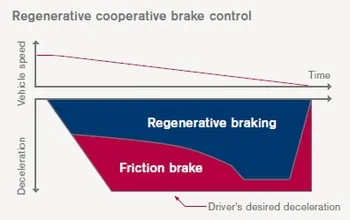
This is an brake which is applied With respect to the Pedal/Throttle of the accelerator. From the above graph. Shows that the percentage of the brake applied for the speed. The braking system is a combination of Regenerative and Mechanical braking. For high speeds, the Friction brake is applied high compare to regenerative braking. For Low speeds, Regenerative braking is very high, compared to the friction brake. This speed recognition is done from the pedal of the accelerator and power converter helps in braking.
3)
Aim:
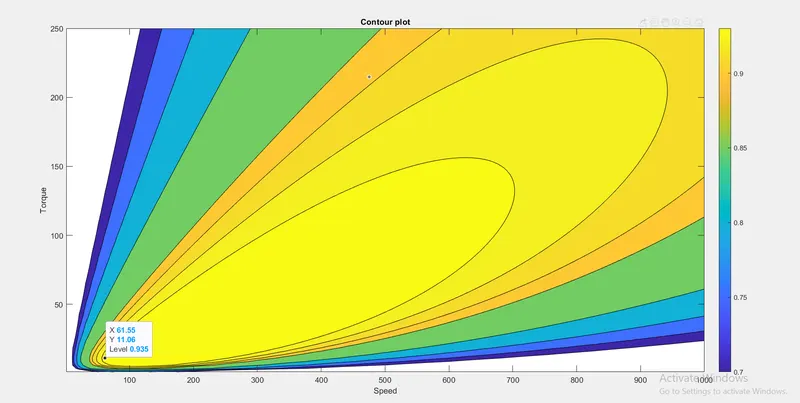
To design a MATLAB program which plots contour of given motor speed, torque and efficiency values.
MATLAB Program:
close all
clc
%Inputs
S=linspace(1,1000); %speed
T=linspace(1,250); %Torque
kc=0.2;
ki=0.008;
kw=0.00001; %constant values
c=20; %COnstant motor loss
[S,T]=meshgrid(S,T);
p_out=(S.*T); %Output power
%Losses
CL=kc*(T.^2); %Copper loss
IL=S.*ki; %Iron losses
WL=kw*(S.^3); %Windage loss
p_in=p_out+CL+IL+WL+c; %Input Power
Z=p_out./p_in; %Efficiency
VL=[0.70,0.75,0.80,0.85,0.90,0.91,0.92,0.93];
%Efficiency Values
%Plot
box off
grid off
contourf(S,T,Z,VL);
contourcbar
title('Contour plot');
xlabel('Speed');
ylabel('Torque');
Program Description:
- Consider the plot with respect to speed and Torque.
- Take the constant loss coefficients for copper, iron and windage losses.
- Plot speed and torque in 2-D and calculate the input and output power.
- Plot the efficiency and get the contour plot.
- The colour in the graph describes the range of efficiencies.
Conclusion:
The graph provides the range of efficiencies with respect to speed and torque. The lowest efficiency is 0.7 or 70% and the highest is 93.5. With this graph , we can find the various efficiencies for the speed and Torque.