Week - 4
State Flow Design of Washing Machine
Aim:
To design the control logic of Washing Machine using the state flow method with the below conditions.
- If the power supply is available, the system gets activated
- If the Water supply is not available, stop the process & indicate through LED
- Soaking time should be 200s followed by Washing time of 100s.
- Then rinsing happens for next 20s & dryer runs for 50s
Blocks Used In Model:
- Chart
- Constant
- Display
Simulink Model:
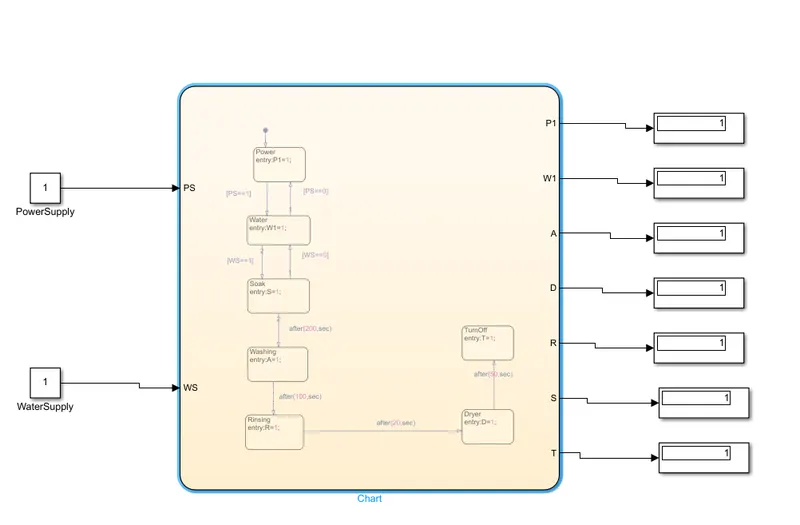
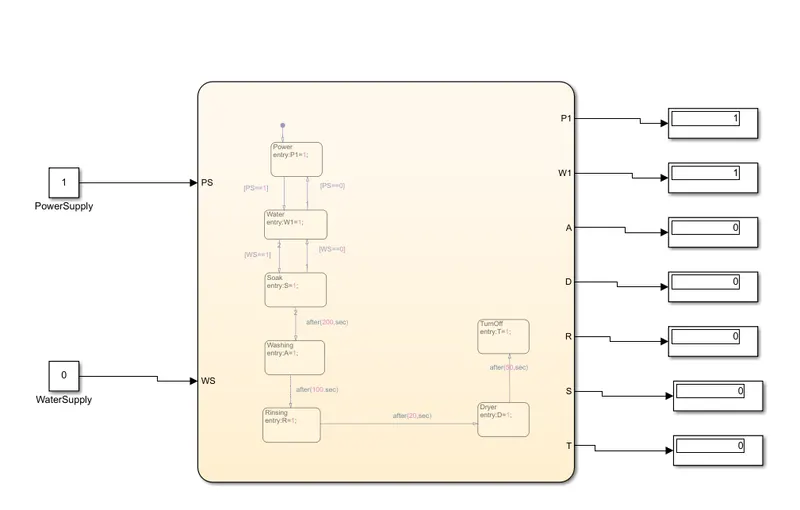
The Simulink model represents the state flow logic of washing machine. When the power supply is given , and the water supply is high, then the machine starts and the process of soaking , washing, rinsing, drying will be carried out. If any supply is low, then the rest of the steps will not be carried. The process will be looping in the initial stage.
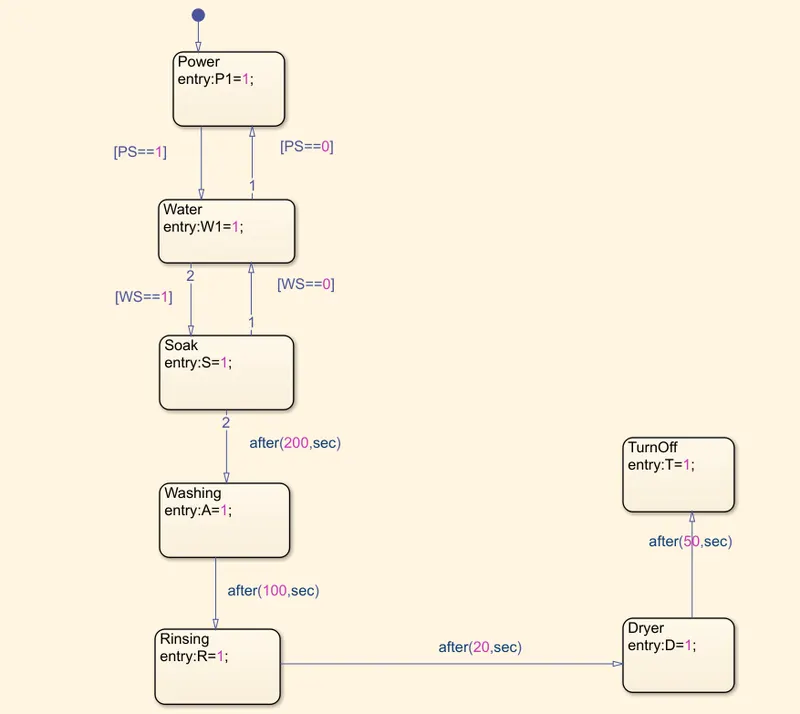
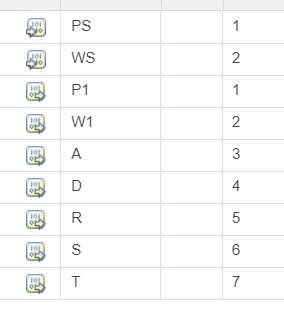
The control logic will be described in the chart. The input PS and WS will be given as the constants to the chart and the outputs are P1, W1, S, A, R, D, T.
Model Examples:
When both the supply is high(PS==1 and WS==1), then the process starts, then soaking will be taken place for 200 seconds. After 200 seconds, washing will taken place for 100seconds, then rinsing will be taken place for 20 seconds and dryer will be on for 50 seconds. After all the process carried out, then machine will be turned off.
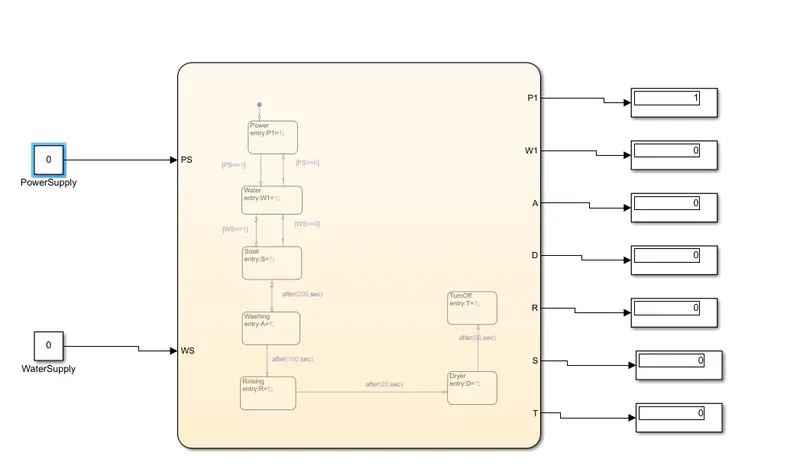
When one of the supply or both supply is low(PS==0 or WS==0), then the process will not started.
When WS=0
When both WS=0 and PS=0
Result:
When one of the supply is off or both the supply is off, then the machine will not be working. When both the inputs are high, then the overall execution of the washing machine will takes place.
Simulink chart for the Gear shift Logic
Aim:
To design Simulink chart for the gear shift logic using below conditions.
Speed Range(kmph) Gear
0 to 15 1
16 to 25 2
26 to 40 3
41 to 60 4
Above 61 5
Blocks Used In Model:
- Constant
- Slider Gain
- Chart
- Gauge
- Display
Simulink Model:
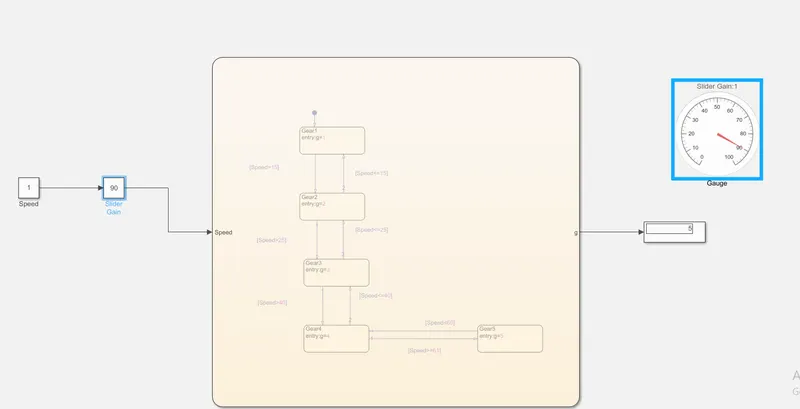
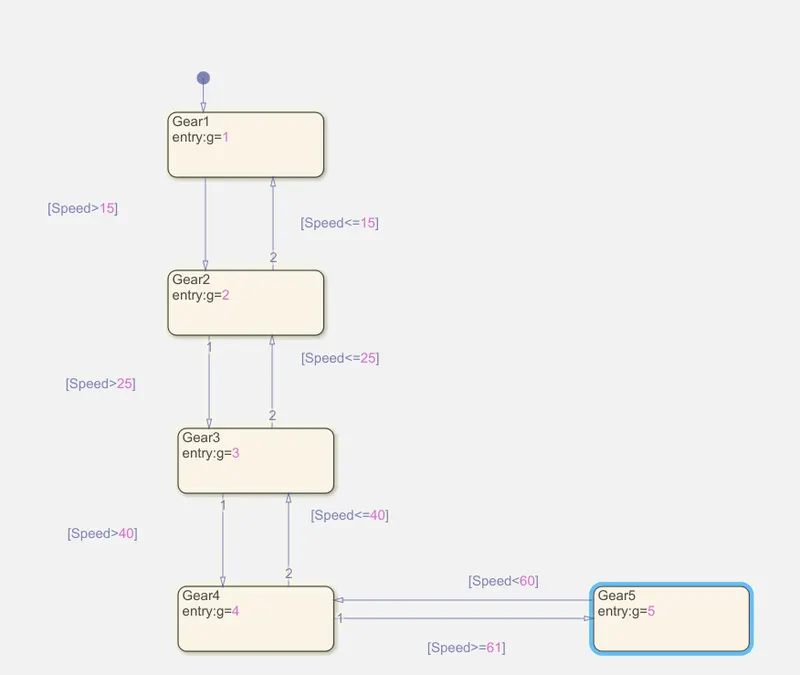
Model Explanation:
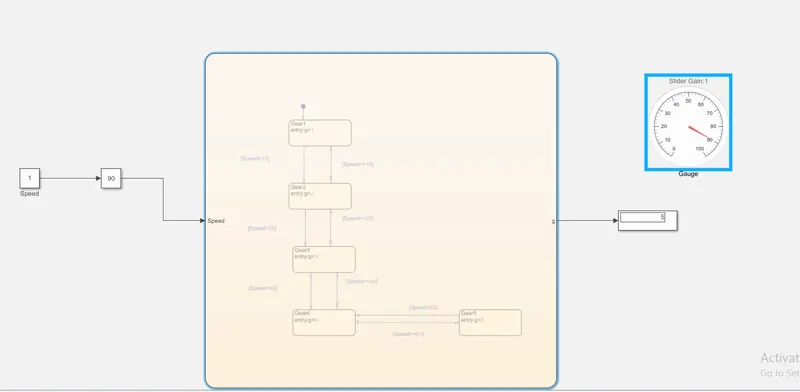
When the speed of the vehicle changes, then the gear should will be changed. If the speed of the vehicle is low, then the gear should be low. If the speed of the vehicle is high, then the gear will be high. The gear value varies from 1 to 5. 1 is Lowest and 5 is the highest. When the speed is continuously varied using slider gain, then the varied speed is given as the input to the chart. Then ,with respect to the speed, the gear changes. If the speed is less than or equal to 15, it will be in gear 1. If it crosses more than 15, then the gear changes to 2, till the speed ranges is 25. If speed goes more than 25 and less than 40, then shifts to gear 3. Between 41 and 60, then it will be in gear 4. If speed is greater than 60 or maximum speed, then it shifts to gear. The output connected will show the value of the gear. The Gauge will be connected to the slider gain, so that variation in the speed will be shown in the gauge.
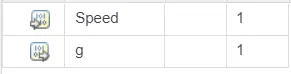
The inputs and outputs are given as:-
Results:
When the value in the slider gain varies, the gear will be varied in the chart, the final gear value will shown in output and value of the speed will be shown in analog gauge display meter.