Week-11 Challenge: Braking
AIM: To understand the braking of the vehicle and motor efficiency
OBJECTIVES:
- For a defined driving cycle, calculate the energy required for braking.
- Why electric motor can’t develop braking torque at a high speed similar to starting? How electric and mechanical brakes are coordinated?
- Make a MATLAB program that plots the contour of given motor speed, torque, and efficiency values. Attach the code as a .m file attach a screenshot of all the plots.
INTRODUCTIONS
Braking is a dynamic state of a vehicle where it slows down i.e decelerates from a certain velocity. The vehicle's velocity will decrease over a certain period of time and this can occur until the vehicle reaches rest or to another velocity level. In either case, the vehicle is still in motion and as a result, it possesses kinetic energy when a vehicle accelerates either from rest or while in motion, its kinetic energy will increase and the opposite occurs when a vehicle decelerates.
The kinetic energy carried by an object in motion of mass m and velocity v is given by
`E_k = 1/2 * m* v^2`
OBJECTIVE 1 - For a defined driving cycle, calculate the energy required for braking.
A drive cycle is a series of data points representing the speed of a vehicle versus time. Driving cycles are produced by different countries and organizations to assess the performance of vehicles in various ways.
In this calculation, UDDS drive cycle data is used. The total Braking energy for the UDDS drive cycle is calculated.
UDDS Drive Cycle - The EPA urban Dynamometer Driving Schedule is commonly called the "LA4" or the "the city test" and represents city driving conditions. It is used for light-duty vehicle testing. The UN/ECE regulation 53 refers to the EPA UDDS as the " Test equivalent to the Type 1 Test.
The UDDS cycle was taken from the ADVISOR tool library and for easy calculation, the mph values were converted to m/s.
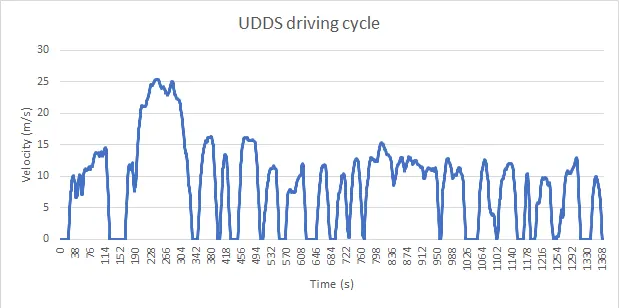
This Drive cycle was used for the calculation of the brake energy of the vehicle. The mass of the vehicle was assumed to be 2000kg and the 5% of inertia of the total weight was considered in the calculation.
clc
clear all
close all
%Input value
mass = 2000+0.05*(2000);
g = 9.81;
time_period = 1370;
num = xlsread('UDDS.xlsx');
time = num(1:time_period,1);
velocity = num(1:time_period,2);
decrease_in_velocity = zeros(1,time_period);
change_in_time = zeros(1,time_period);
deceleration = zeros(1,time_period);
instantaneous_braking_energy = zeros(1,time_period);

for i = 1:(length(velocity)-1)
    if velocity(i) > velocity(i+1)
        decrease_in_velocity (i) = velocity(i+1)-velocity(i);
        change_in_time(i) = time(i+1) - time(i);
        deceleration(i) = decrease_in_velocity(i)/change_in_time(i);
        instantaneous_braking_energy(i) = 0.5*mass*0.001*((velocity(i))^2 - (velocity(i+1))^2)/3600;
    end
end

figure

subplot(2,1,1)
plot(time,velocity,'g')
xlabel('Time(second)')
ylabel('Velocity (m/s)');
title('UDDS data')

subplot(2,1,2)
plot(time, deceleration)
xlabel('Time (S)')
ylabel('Deceleration (m/s^2)');
title (' Deceleration value for (UDDS)')

figure
plot(time,instantaneous_braking_energy,'r')
xlabel ('Time (s)')
ylabel ('braking energy (KWH)')
title ('Braking energy value for UDDS data')
EXPLANATION:
- First, we have considered all the inputs parameters and conditions that are required for the calculation. The Excel file was called using the command xlsread.
- The initiating the for loop for the calculations is done using the data provided in the above step.
- In the third step, the results were plotted in the first figure the UDDS cycle and the deceleration cycle was plotted and in the next figure, the braking energy is plotted.
RESULTS:
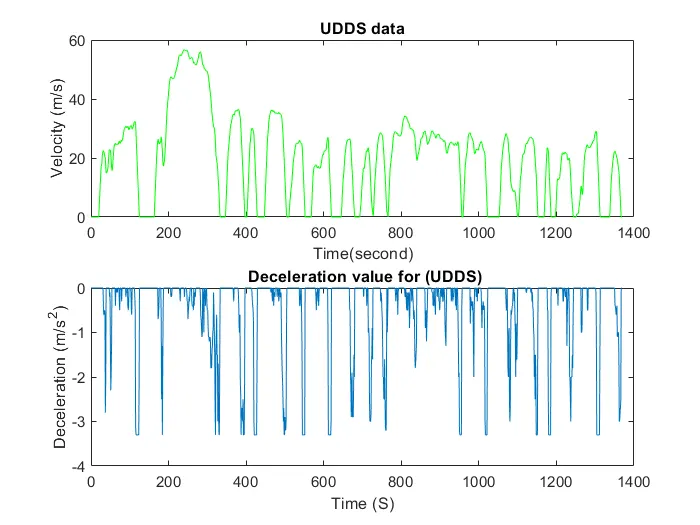
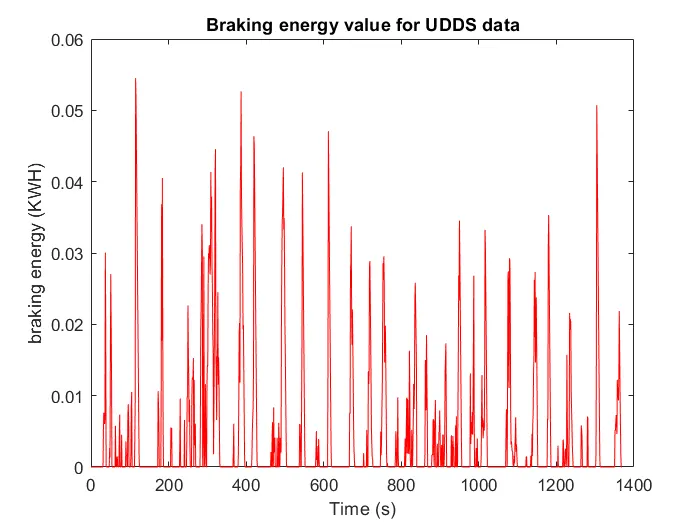
OBSERVATION:
In the first figure, we can see that as compared to the UDDS cycle, as the velocity reaches the peek the brake energy decrease and as the velocity decrease the brake energy increase.
OBJECTIVE 2 - Why electric motor can’t develop braking torque at a high speed similar to starting? How electric and mechanical brakes are coordinated?
Mechanical braking
In a conventional IC engine vehicle, there is only one physical braking mechanism that can be performed and that is done with the brake pads/discs. The braking pedal is pressed by the driver which results in the application of the brake pads/discs onto the wheels of the vehicle. The friction that arises between the rotating wheels and the stationary brake pads/discs will decrease the speed of the vehicles. Another method of braking in conventional vehicles is called engine braking. In this method, the throttle is released, and the gear is changed to a lower gear which will result in the deceleration of the vehicle. This occurs via the manifold effect whereby the releasing of the accelerator pedal leads to the shopping of the full flow to the engine cylinder. This also stops the sir follow resulting in a negative traction torque. In heavy-duty vehicles, the engine brake is very useful because it helps to were only used. So engine braking is useful as it allows for the desired control while reducing were and tear on the physical braking mechanism.
Electric Braking
In motor and HEVs /EVs various methods of braking exist. One method is using a brake motor which consists of a DC rectifier a magnet spring and a friction disc. The mechanism of the brake motor involved the rectifier giving a signal to disrupt a magnetic field which will influence the spring to expands and apply a force on the friction discs which will come into contact with the moving part that is in contact with the rotor. When the vehicle is accelerating or moving at constant speed the motor still receives its 3-phase AC supply from the inverter and so the brake is not applied. This DC rectifier relays no signal to the magnetic field so that the spring stays in their stationary position and do not force and contact on to the friction discs. However when a vehicle is not accelerating the 3 - phase AC supply from the inverter is cutoff causing the brake to be applied. The DC magnetic field is disrupted by an air gap which causes the spring to get excited and expand and apply force on the friction disc to produce braking action.
Evs and HEvs have the brilliant features of regenerative braking which is where during the act of braking the motor begins to operate as a generator and instead produce electrical energy. Essentially when a vehicle decelerates the change in the kinetic energy of that vehicle is used to produce a torque on the motor and thereby producing electrical energy via the generator effect which can be stored by the battery or be diverted from another powering purpose. The electricity generated by the battery or be diverted from another powering purpose. The electricity generated by the regenerative braking phenomenon is referred to as back emf because it produces a current that travels in the opposite direction rotates at a speed that is greater than the synchronous speed. This will result in the back emf being greater than the terminal voltage so that the potential difference is strong enough to influence the current to flow in the opposite directions. Using regenerative braking not only deceleration the vehicle but also increase the efficiency and the energy saving of EVs and the HEVs.
Another method of braking in EVs and HEVs is referred to as dynamic braking. In this method of braking the supply voltage powering the motor is disconnected and instead of a resistor is connected. The absence of the resistor would result in significant frictional and windage losses which would decrease the efficiency of the vehicle and lead to longer braking times. This is not desirable because a good brake needs to bring the vehicle to rest within a certain amount of time and done safely with the resistor fitted instead the braking tine can be reduced significantly.
Control strategies
From these various braking methods, it is obvious that both mechanical and electrical braking is useful and both have their benefits and drawbacks. In regards to a vehicular application depending on the type of vehicle, either one of both types is utilized. In the case of conventional vehicles, only mechanical braking consisting of friction braking and engine braking friction braking and engine braking is utilized whereas in HEVs/EVs both are utilized. In HEVs/EVs using both mechanical and electrical braking means that the braking application can get the advantages of both types and minimize the disadvantages as much as possible. HEVs and EVs use control strategies for controlling the braking methods and deciding which brakes to apply and when to apply them. These control strategies are referred to as breaking modes and they will find a compromise between the mechanical and electrical braking methods to see which is the most efficient at its job.
For instant, at a lower speed level, it may be more suitable to use the mechanical brakes i.e friction braking because these brakes will be more than capable to brake the vehicle and not generate too much heat and thus will not produce too much were and tear for the brake. However, at a higher speed level, it would be more suitable to use electrical braking. This is because electrical braking also is more effective, it won't generate nearly as much heat as mechanical brakes would. Electrical braking also is more efficient and energy-saving because at high speed more kinetic energy will be carried by the vehicle and thus regenerative braking can occur to convert that kinetic energy into electrical energy to be stored back in the battery. If a mechanical brake were used instead high amount of heat would be generated and would lead to wear and tear of the brake over time. The high heat generation also means that the dissipation of the kinetic energy is wasted into the energy that cannot be reused which reiterates its efficiency compared to the electric brakes. In addition, the electric brakes would also be smoother and more gradual, and not sudden like the mechanical brake which would make the braking action more comfortable and safer for the passenger.
OBJECTIVE - 3 Make a MATLAB program that plots the contour of given motor speed, torque, and efficiency values. Attach the code as a .m file attach a screenshot of all the plots.
The output power values are calculated by multiplying given speed and torque values. All these losses are added with output power to get the total input power provided. From these inputs and output, power values efficiency values are calculated. Then a contour plot is drawn for particular efficiency values alone.
The main losses that occur are
- Copper losses
- Iron losses
- Windage losses
- Conduction losses
These various losses depend on the speed and the torque of the motor. They each also have a characteristic constant of proportionality which are all assumed for the following calculation and represented as K. In each calculation the speed and the torque are represented respectively as `ω`and T.
- Copper losses = `K_Cu * ω^2`
- Iron losses = `Kf_e * T^2`
- Windage losses = `K_w * T^3`
- Conduction losses are assumed to be 20.
The output power of the motor can be calculated by multiplying the angular with the torque.
`p - out = T. ω`
Then we can calculate the input power supplied to the motor by adding the output power to the energy losses
`p_i = P_(out) + Cu_(loss) + Fe_(loss)+W_(loss) + Cond_(loss)`
The efficiency is given by
`η = p_(out)/(p_i + Cu_(loss) + Fe_(loss)+W_(loss) + Cond_(loss)`
Below is the code for the calculation of the efficiency and plot the efficiency contours of the motor.
clc
clear all
close all

omega = linspace(0,100);
torque = linspace (0,250);

%motor loss constant
%for copper loss
k_c = 0.2;
%for iron loss
k_i = 0.008;
%for winding loss
k_w = 0.00001;
%for conduction loss
c1 = 20;

%making 2D matrix
[T,W] = meshgrid(omega,torque);

% output power
out_power = (T.*W);

% Calculating losses
%copper loss
b = (W.^2)*k_c;
%winding loss
c = (T.^3)*k_i;
%iron loss
d = T*k_i;

% input power
in_power = out_power + b + c + d + c1;

% efficiency
E = out_power./in_power;

% creating countour
contourf(T,W,E);
colorbar
xlabel ('speed')
ylabel('Torque')
title('Contour for motor speed, torque efficiency')
OUTPUT
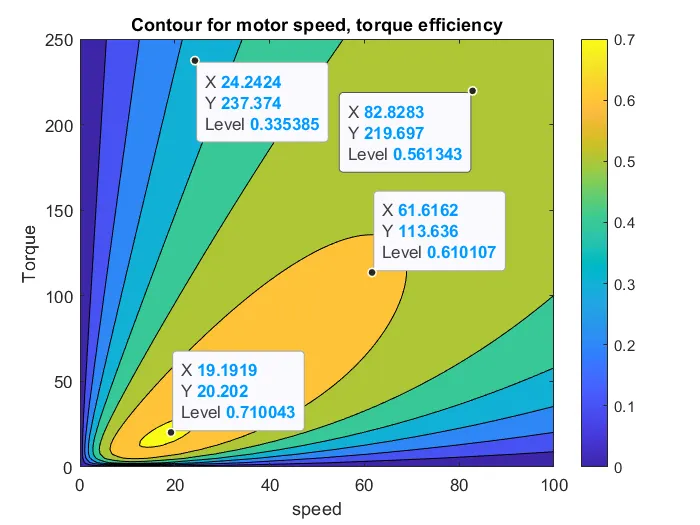
Observation
As we can see that the efficiency is maximum at the center of the plot and it gradually decreases as we go away from the center towards the outer plots.
CONCLUSION
From the above study, we successfully calculated the Braking energy required for a particular driving cycle, understood the difference between mechanical and electrical braking, plotted the efficiency contour for the motor, and observe the behavior of the plot.