Week-11 Challenge: Braking
1. For a defined driving cycle, calculate the energy required for braking.
Ans:
In this study we calculating various forces acting on a car. Then the amount of brake force required and the maximum decelerations possible is calculated. We also try to show the flow of energy from one form to another in terms of equations. The vehicle is modeled to resemble a mid-sized car. Car specs given in the table below are purely fictional. The motor-generator datas are derived from ADVISOR 3.0 for a electric machine.
Energy flow:
The kinetic energy of the vehicle during braking is used to rotate the motor in reverse direction. Thus the very same motor used for propulsion now acts as a generator, feeding the battery with power as represented by the equations below. The flow of energy takes place in the following order:
kinetic energy of the vehicle is transformed into electric energy produced by generator, which is transformed into energy input for battery.
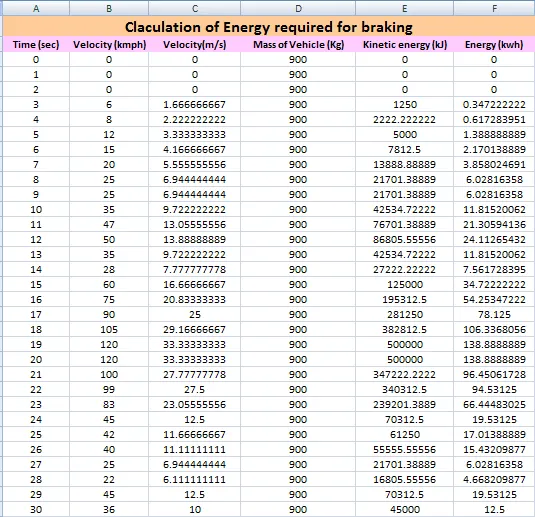
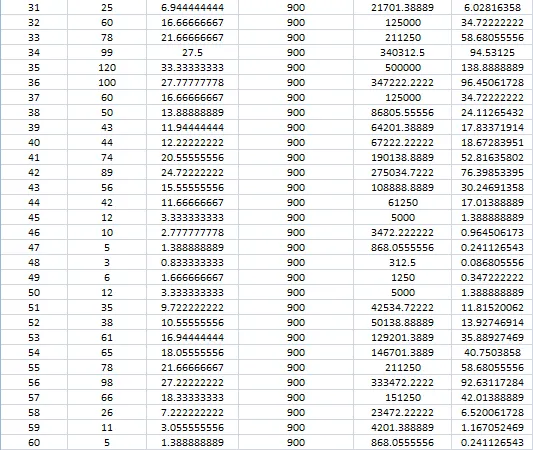
Kinetic energy of the vehicle
Ekin = (1/2)*M*(Vf-Vi)2
Where,
M is mass of the vehicle
Vf & Vi are the final and initial velocity
Energy calculation using Excel calculator:
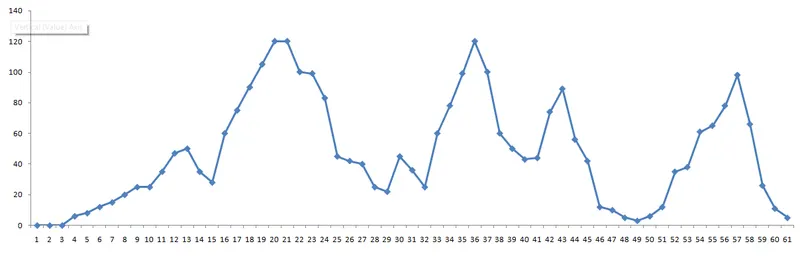
Drive Cycle for the above excel sheet:
----------------------------------x----------------------------------------------x-------------------------------
2. Why electric motor can’t develop braking torque at high speed similar to starting? How electric and mechanical brakes are coordinated?
Ans:
Why can't reach 100% torque:
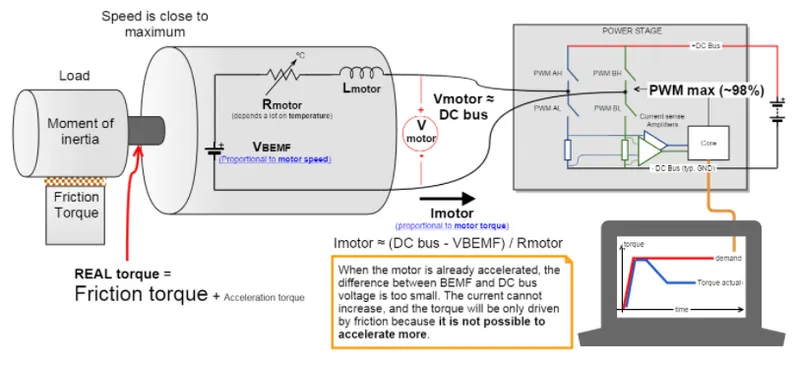
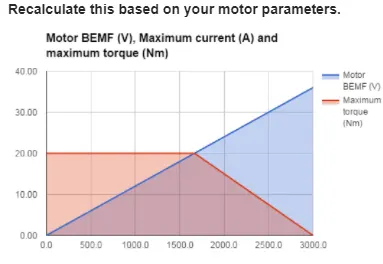
Sometimes after accelerating you can't reach the maximum torque. The reason is that no matter how much the current loop wants to increase current (proportional to torque) by increasing the PWM duty cycle of the power stage, the Vmotor is too close to Vbemf and therefore current can't increase more.
Whenever Friction torque + Additional loads = Motor Torque, the load remain in equilibrium (does not move, or moves under constant speed). Whenever Friction torque + Additional loads < Motor Torque, the load accelerates (Motor torque - Friction torque - Additional loads = Acceleration torque > 0). Al high speeds, the BEMF is so close to Vbus that the applicable Motor torque gets limited. Then, the bigger the Friction torque + Additional load is, the smaller the Acceleration torque becomes.
This situation does not occur at the beginning of an acceleration because most of the torque is used to increase the kinetical energy of the load (and motor). But when the speed is already high and no extra load is applied it is not possible to increase the torque.
Maximum achievable torque depending on motor speed:
How to prevent this:
Increase DC bus voltage.
Unlimit system acceleration.
Use a motor with less resistance and lower back EMF proportion.
Compensation for electric mobility throttles:
This situation creates a bad feeling that at high speeds the throttle does not work correctly.
The user feels that it releasing the throttle does not reduce motor force!
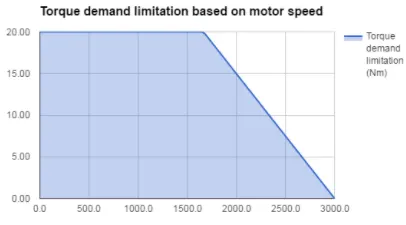
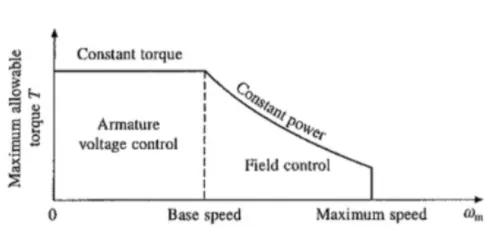
The proposed solution is to add a torque demand limitation based on speed.
- Will improve user feeling when releasing brake when the vehicle is already accelerated.
- Will limit vehicle top speed (safety)
Conclusion:
The torque reduction occurs because motor impedance increases with frequency increases. A VFD cannot increase the voltage above its supply voltage. This causes the current to decrease as frequency increases, thus decreasing the available torque.
Ans B:
Coordination of electric and mechanical brakes:
Electric brake:
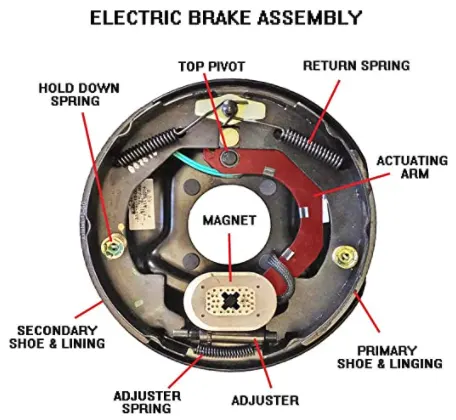
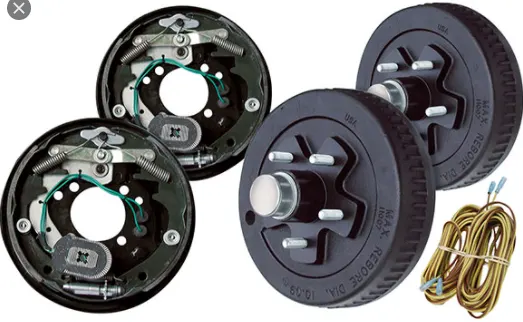
- Motor of electric vehicle is able to be used to brake regeneratively, so braking energy can be recycled. Braking stability of electric vehicles with electro-hydraulic hybrid braking system can be influenced by braking force distribution between hydraulic braking force and regenerative braking force.
- In order to research on braking stability and braking energy recovery, simulation platform of electro-hydraulic hybrid brake system based on Carsim and Matlab/Simulink is built, and a control strategy of electro-hydraulic hybrid brake were proposed.
- The vehicle simulation models with electro-hydraulic hybrid brake system and with conventional hydraulic braking system were applied the brake on different adhesion coefficient separately.
- The simulation results show when electric vehicle is in the conditions of low braking intensity, all vehicle braking force is provided by regenerative braking force, and braking energy can be not only recycled, but brake performance requirement can also be satisfied;
- When electric vehicle is in the conditions of moderate braking intensity, regenerative braking and hydraulic braking are coordinated with each other, electro-hydraulic hybrid brake can not only satisfy the same and better brake performance, but also braking energy can be recycled and demand of hydraulic pressure can be reduced.
Mechanical brakes:
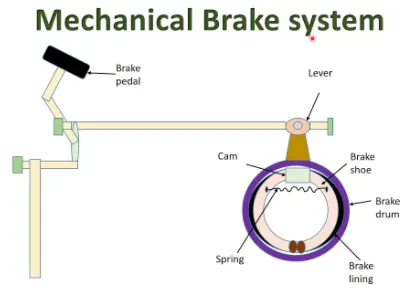
The mechanical braking system powers the hand brake or emergency brake. It is the type of braking system in which the brake force applied on the brake pedal is carried to the final brake drum or disc rotor by the various mechanical linkages like cylindrical rods, fulcrums, springs etc. In order to stop the vehicle.
Mechanical brakes were used in several old automobile vehicles but they are archaic nowadays due to their less effectiveness.
Types of Brakes:
Disk Brake
The disc brake is a mechanism for slowing or stopping the rotation of a wheel from its motion. A disc brake is normally made of cast iron, but in some cases, it is also made of composites such as carbon-carbon or ceramic -matrix composites. This is linked to the wheel and/or the axle. To stop the wheel, friction material in the form of brake pads is forced against both sides of the disc. Friction caused, on the disc wheel will slow or stop.
Drum Brake
A drum brake is a traditional break in which the friction is caused by a set of shoes or pads that press against a rotating drum-shaped part called a brake drum.
The term "drum brake" usually means a brake in which shoes press on the inner surface of the drum. Where the drum is pinched between two shoes, similar to a standard disk brake, it is sometimes called a "pinch drum brake", although such brakes are relatively rare.
Conclusion:
- The coordination control strategy of type one was achieved by controlling the change rates of the clutch hold-down force and the motor braking force. By comparing the characteristics of the motor and the hydraulic braking systems, it was found that the dynamic response of the hydraulic braking system is slow and stable, while the response of the motor braking system is fast and accurate.
- Therefore, the strategy of type two was coordinated by modifying the target braking torque during the braking mode switch.
- Meanwhile, control of the motor braking system was utilized to actively improve the torque fluctuation and a motor torque PID control algorithm was designed for this purpose.
- Finally, a coordination control strategy simulation was performed on the MATLAB/Simulink platform; the simulation results showed that the coordination control strategy can effectively reduce the vehicle jerk under specific road conditions during a typical.
-------------------------------x---------------------------------------------x-----------------------------------
3. Make a MATLAB program which plots contour of given motor speed, torque and efficiency values. Attach the code as a .m file attach a screenshot of all the plots.
Ans:
Matlab script:
clear all
close all
clc

% Creating speed and torque matrices
Speed = linspace(0,1000);
Torque = linspace(0,250);

% Inputs for losses coefficients
Kc = 0.2;
Ki = 0.008;
Kw = 0.00001;
cons = 20;    % constant losses

% creating a mesh of speed and torque values and calculating losses at
% every point along with output power available
[X,Y] = meshgrid(Speed,Torque);
output_power = X.*Y;
A = Kc.*(Y.^2); %copper losses
B = Ki.*X; %iron losses
C = Kw.*(X.^3); %windage losses

% input power calculation and plotting of contour of efficiency
Input_power = output_power + A + B + C + cons;
n = output_power./Input_power;

% creating a matrix for efficiency values for which the contours are to be
% plotted
v = [0.7 0.8 0.85 0.88 0.90 0.92 0.94 0.96 0.98 1];

% plotting the contour
contour(Speed,Torque,n,v,'ShowText','on');
box on
grid on
colorbar
xlabel('Speed(rad/sec)');
ylabel('Torque(N-m)');
title('Efficiency contour of electric motor');
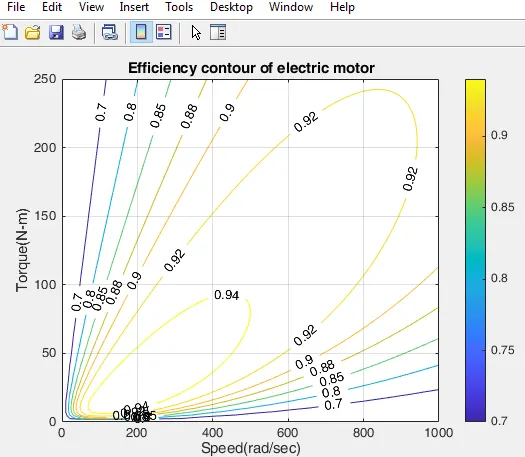
Output:
Conclusion:
- Here the contour represents the group of efficiencies at certain characteristics of motor.
- The inner contour having the highest efficiency because where the height is maximum and height reduces if you keep on going outside.
- The brown and yellow graph indicates 8kw and 10kw of power.
-----------------------------x-------------------------------------------------x-------------------------------