Week-11 Challenge: Braking
1. To calculate energy required for braking
The kinetic energy E of a vehicle is given by the formula
E = 1/2mv^2
where m is the mass of vehicle, v is the speed speed at the start of braking
If the vehicle speed decreases from initial velocity Vi to final velocity Vf then the required braking energy is given by the formula
1/2m(Vi^2−V^2)
Here I have given my own Drive cycle data to calculate the braking energy
matlab code
clc

% Input values

mass = 2500;      % mass of vehicle
g = 9.8;
time_period = 150;
num = xlsread('drivecycle.xlsx');  % reading the drive cycle
time = num(1:time_period,1);
velocity = num(1:time_period,2);
decrease_in_velocity = zeros(1,time_period);
change_in_time = zeros(1,time_period);
deceleration = zeros(1,time_period);
instantaneous_braking_energy = zeros(1,time_period);
for i= 1:(length(velocity)-1)
    if velocity(i)>velocity(i+1)
        decrease_in_velocity(i) = velocity(i+1)- velocity(i);
        change_in_time(i) = time(i+1) - time(i);
        deceleration(i) = decrease_in_velocity(i)/change_in_time(i);
        instantaneous_braking_energy = 0.5*mass*0.001*(velocity(i))^2-(velocity(i+1))^2/3600;
    end
end

figure
subplot(2,1,1)
plot(time,velocity)
xlabel('Time(seconds)')
ylabel('Velocity(m/s)')
title('Drive cycle')

subplot(2,1,2)
plot(time,deceleration)
xlabel('Time(seconds)')
ylabel('Deceleration(m/s)')
title('Deceleration value of Drive cycle')

fprintf('The total braking energy required for drive cycle for a time period of %d seconds is %.3f Wh',time_period-1,sum(instantaneous_braking_energy))
the mass of the vehicle is 2500kg
the plot of the abive matlab code
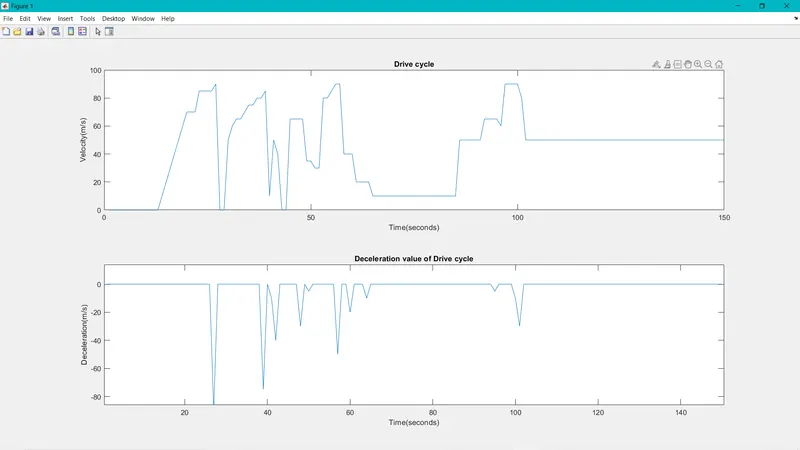
In this the first plot is the Drive cycle given and the second plot is the deceleration values which are in negative
Now displaying the total energy required for braking

2. Why electric motor can’t develop braking torque at high speed similar to starting?
When the motor is at rest and it has to operate from stand still position to reach the moderate speed the higher torque is required to bring the motor in operation .Whereas when the vehicle is already at high speed the capping or the limit is reached by the motor operation and thus any further higher torque could not be obtained while braking .The braking operation happens in the motion which is been distributed as per proportion in the brake energy and regenerative braking .
How electric and mechanical brakes are coordinated?
In mechanical braking which we usually see and experience in all vehicles the brake pedal in the vehicle cabin helps us to engage and disengage the brakes. Currently the braking technology have done woders by inventing technology such as ABS,EBD,BA and many more. All these technologies play vital role in stopping the vehicle and coming back to rest from a high speed. In all these vehicle when the driver applies the brakes the brake pads come close to the disc connected with the driving disc.
There are two generic methods by which the vehicle could be braked in the electric vehicle.
Series:- The regenerative braking or mechanical braking both are applied one after another
Prallel:- The regenerative braking or mechanical braking both are applied parallely.
When the brake pedal is pressed the hydraulic fluid reaches the brake piston and creating the braking pressure on the wheel and the same kinetic energy is been used by the regenerative braking for generating more power using the Bidirectional motor which operates as generator while braking.
3. MATLAB program to plots contour of given motor speed, torque and efficiency values.
matlab code
% Matlab program to plot contour of Motor speed,Torque
clc

% Speed array
w = linspace(0,1000);

% Torque array
t = linspace(0,300);

% Loss coefficient
kc = 0.18;    % copper loss
ki = 0.006;    % iron loss
kw = 0.000015;  % windage loss

% Meshgrid
[X,Y]= meshgrid(w,t);
copper_loss = (Y.^2)*kc;
iron_loss = X.*ki;
windage_loss = (X.^3)*kw;
cons = 20;
o_p = X.*Y;
input_power = (copper_loss)+(iron_loss)+(windage_loss)+(o_p);
eff = (o_p)./(input_power);
n = linspace(0.65,0.95,10);
contour(X,Y,eff,n)
title('CONTOUR PLOT OF MOTOR SPEED,TORQUE')
xlabel('speed rad/s')
ylabel('Torque N/m')
Contour plot
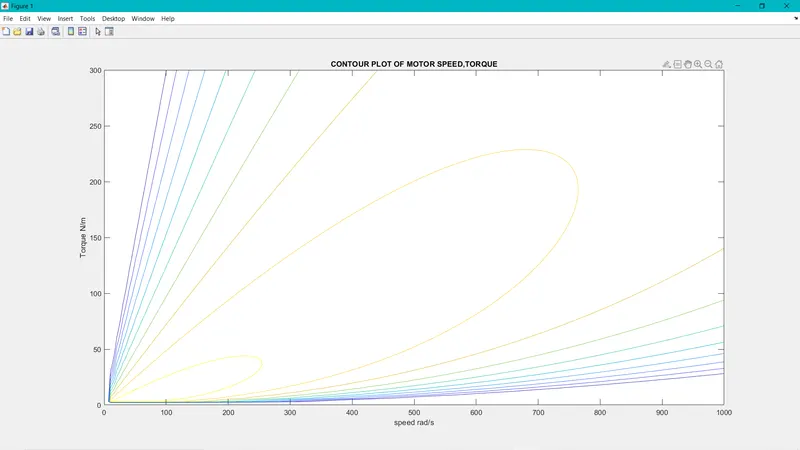
copper loss - these are generated as a result of armature resistance
Iron loss - Changes according to speed as speed are changed back emf of different values are generated
Windage loss - Due to the size and shape of motor
A meshed grid is formed with X as rotational speed and Y as Torque