Week-4 Challenge WOT Condition Part-2
1. Mapped engine:
- It is a default setting in powertrain blockset. It is used to measure performance parameter fo the vehicle by using standard lookup table which are prefeed to the system.
- This type of medelling is less accurate .
- The lookup table values are based on the values of brake torque, commanded torque and engine speed.If any other parameter like input engine temperature is selected then lookup table values are also a functionof the temperature parameter.
- The data extracted from lookup tables are: air mass flow, fuel flow emission data exhaust temperature and efficiency. This data is used to find out other parameter which are needed by the end user.
Dynamic engine:
- This type of model uses real time data fed by the user at run time for modelling.
- This model is more accurate than mapped engine model.
- This type of model is used when the data of sub system of a vehicle is required.
- We can calculate Brake torque, fuel flow, port gas, mass flow, exhaust temperature, exhaust mass flow rate and exhaust emissions.
Mapped motor:
- The mapped motor works in torque control mode.
- This type of motor is used when the user requires a faster simulation and doesn't have the knowledge of motor parameter.
- The output torque and reference torque is compared and changes are made.
- Input torque or speed can be specified electrical losses and maximum motor power and torque can be defined.
Dynamic motor:
- In the dynamic motor a three phase interior permanent magnet synchronous motor (PMSM) is used.
- The block uses three phase input voltages to regulate the individual phase currents, allowing control of the motor torque or speed.
- This block is used when the user knows what parameter are to be used in that particular simulation.
- This motor is more accurate.
Mapped generator:
- The mapped generator block is also similar like other blocks. Most of the data required is taken from the lookup table corresponding to the given input parameter.
- Its simulation time is less.
Dynamic generator:
- It involves user entering the parameter manually during the run time for their particular application.
- The results take time and are more accurate.
To change the model type
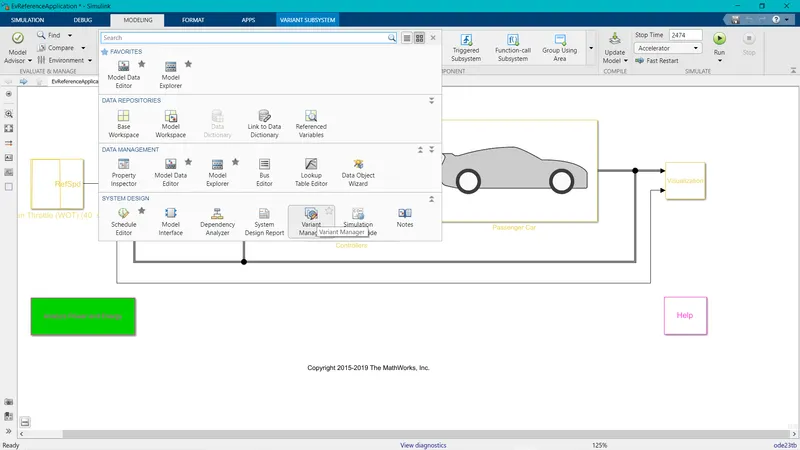
Go to modeling then go to varient manager
If we want to change the generator block from mapped to dynamic . Select GenDynamic and right click on it and select 'Set as Label model Active choice' and then double click.
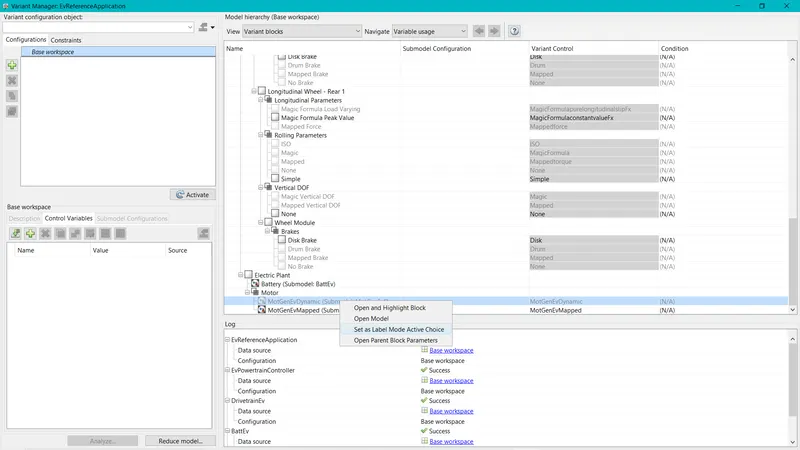
Now the dynamic model will be activated.
2. MPGe stands for Miles per Gallon equivalent. It has been found that 1 gallon of gas has same amount of energy as 33.7kwh of electricity
this above rating is given by EPA(Environmental protection agency)
Example : A battery propells for 3.5miles per kwh capacity of the battery
3.5m/kwh * 33.7kwh = 118MPGe
in the model it is calculated from the block
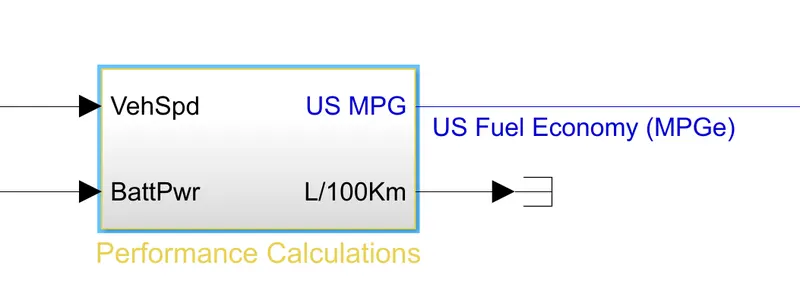
The inputs are vehicle speed, battery power
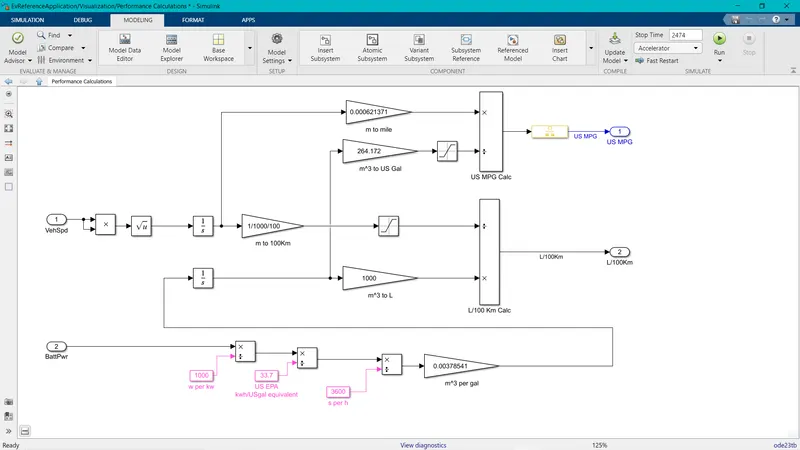
we can see from the above image inputs are given.As mentioned in the above 1 gallon of gas equal to 33.7kwh electricity.
So battery power is first converted into KW(w/1000) then it is divided by 33.7kwh. Then the fuel equivalent of battery is added to the fuel flow.Using the vehicle speed and time the distance is calculated. Then distance is converted to miles by conversion. Now we have fuel flow m^3 and distance in miles we can calculate the efficiency.
3. HEV reference application with WOT drive cycle
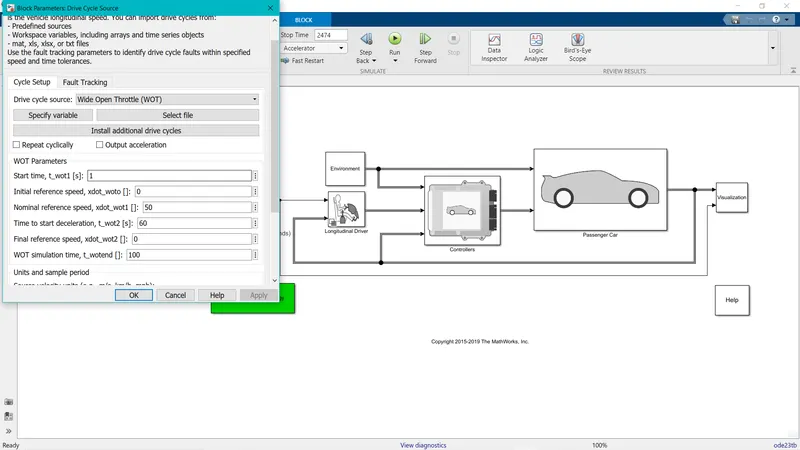
open the Hevreference appliction and double cliclk on drive cycle source and select WOT drive cycle as shown below and make necessary changes for speed, time.
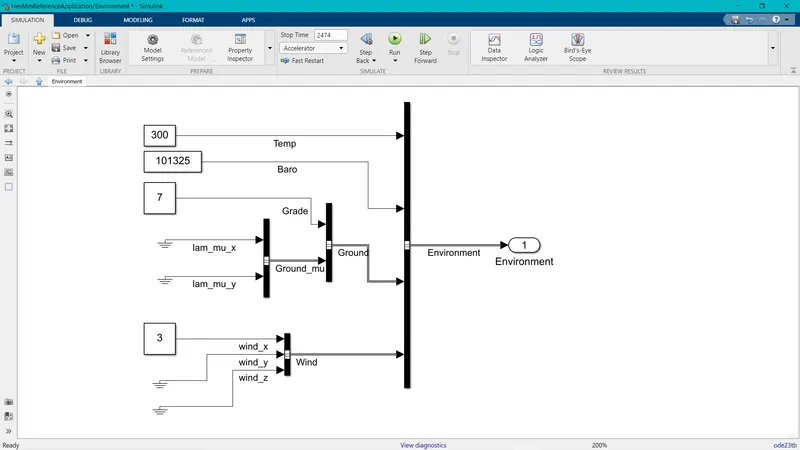
now change the wind speed and grade value from the environment block. I have taken the grade value as 7 and wind speed as 3
Now click on run to simulate the model the following output is observed
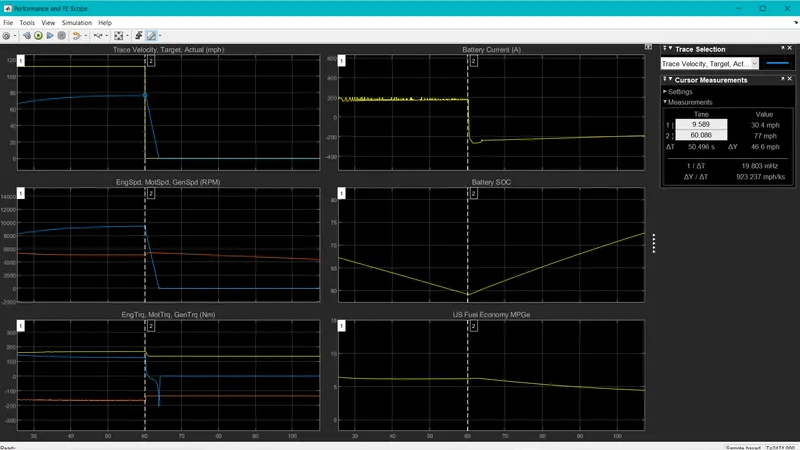
from the above graph we can see that
Trace velocity: the yellow line indicates the desired path and the blue line indicates the target. From this graph we can say that the battery power is not enough to meet the requirement of grade and wind velocity.
Battery current: In this graph we can see the battery current is increasing as the acceleration is increasing while deaccelerating we can see that the battery current is goining to negative which indicates the regenerative braking power.
Battery SOC : In this graph we can see that the battery state of charge keeps on depleting until deacceleration. In deacceleration again the SOC starts increasing.
4. Simulating the Ev with WOT drive cycle keeping the grade as 7 degree and wind speed as 3m/s .And every other parameter is kept same as the Hev model
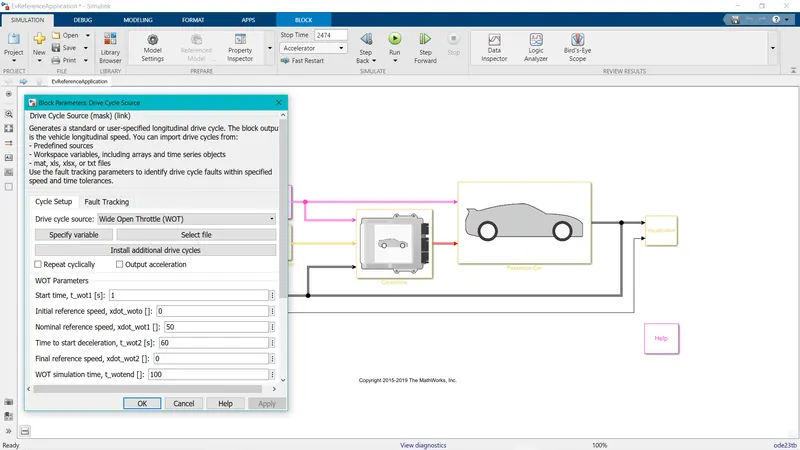
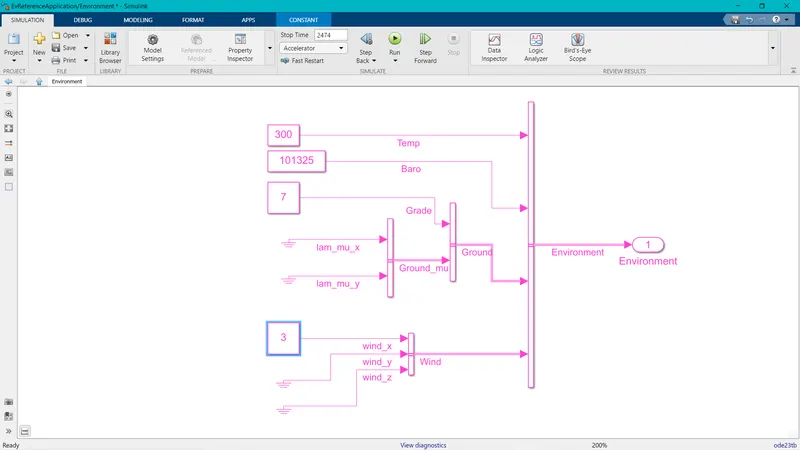
After simulating the model we get the following performance graph.
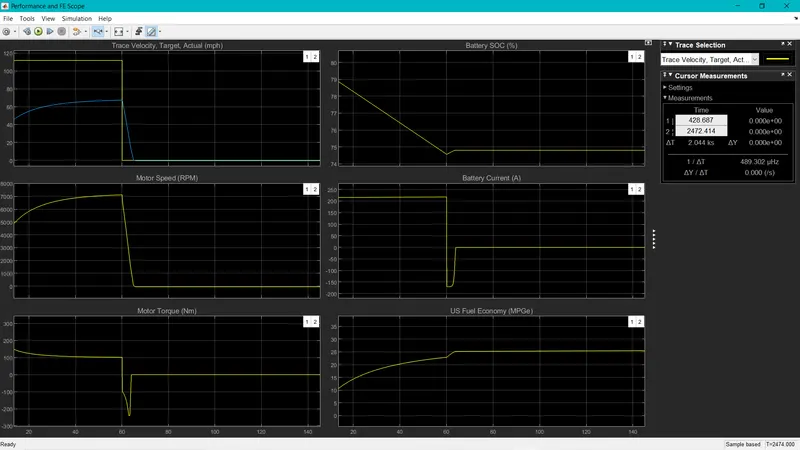
Comparing both EV and HEV graph following observation are seen
- The frist graph we can see that from both graph the performance is alomost same.Because in that region only motor is operating hence the performance is almost same.
- The battery current drawn by the EV is around 220A later decreases during deacceleration. Goes to negative indicating the regenerative breaking.
- The battery state of charge in EV is depleting during acceleration and a slight increase is seen during deacceleration.But in HEV we can see that there is gradual increase in SOC during deacceleration.