Week-11 Challenge: Braking
AIM:
- For a defined driving cycle, calculate the energy required for braking.
- Why electric motor can’t develop braking torque at high speed similar to starting? How electric and mechanical brakes are coordinated?
- Make a MATLAB program which plots contour of given motor speed, torque and efficiency values. Attach the code as a .m file attach a screenshot of all the plots.
1.For a defined driving cycle, calculate the energy required for braking:
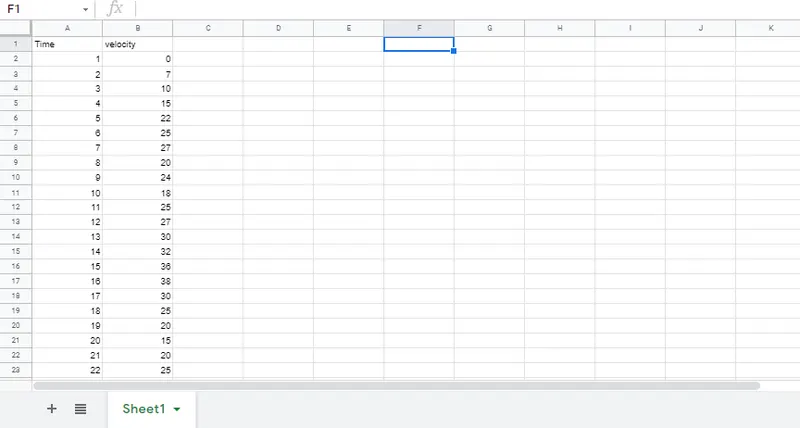
From the above drive cycle lets take 3 different situations of deccelaration of which energy has to be calculated
First braking : 27 kmph - 20 kmph
Second braking :24 kmph -15 kmph
Third braking :38 kmph - 30 kmph
Using excel we can calcuate the energy requried for braking:
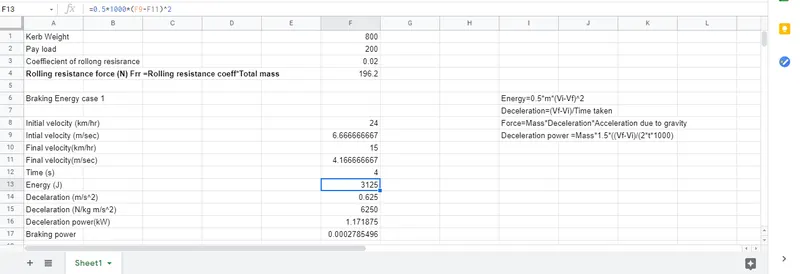
You can view this document using the LINK
https://docs.google.com/spreadsheets/d/1C2DoC3JvcMsGy0s_D2gj4qhJ2jCKHodgMmUzF-OaSoM/edit?usp=sharing
2.Why electric motor can’t develop braking torque at high speed similar to starting? How electric and mechanical brakes are coordinated?
The braking torque in an electric motor is not as high as that of the accelaration torque at higher speed this can be attributed to many different reasons the rate of discharge of the battery is higher than the charging rate it can be said that the discharge rate can be twice as the rate of charging rate. There are other limitations to the motors in the form of power converters too. This power converter is customised 3 phase inverters which are bi directional as it need to convert regenerative braking energy back to DC current for the battery as this reduces the effiency of the power converter at low speeds regenerative braking is very high speed increases the regenerative breaking reducesas the effictiveness of the inverter plays the imporatant role and the overall efficiency reduces resulting in the reduced braking torque hence for effective braking at high speeds we use aa combination of hydraulic brake and regenerative brake.
There sre different ways of coordinating between the hydraulic brakes and regenrative brakes one of the control startegies involves series connection of brakes where both brakes are connected together implies that in this scenario both brakes are used together and next ne in the parellel connection where either of the brakees is operated individually without relying is operated individually without relying on one another on the braking requriements.
When the brake pedal is applied it supplies the hydraulic fluid to disc to slow down the tires at high speed since the braking force is requried is high large amount of hydrulic brakes are applied and once the speed is reduced and the torque value is so high the electric brakes become predominant so the battery charging occurs efficiently the ECU system with a feedback system to find the torque region and regenerative braking predominates in the high torque region.
3.Make a MATLAB program which plots contour of given motor speed, torque and efficiency values. Attach the code as a .m file attach a screenshot of all the plots.
close all
clear all
clc
omega=linspace(0,1000); % RPM
T=linspace(0,300); %torque Nm
kc=0.2;
ki=0.008;
kw=0.0001;
[x,y]=meshgrid(omega,T);
copper_losses=(y.^2)*kc;
iron_losses=x.*ki;
windage_losses=(x.^3)*kw;
con=20;
o_p=x.*y;
input_power=(copper_losses)+(iron_losses)+(windage_losses);
eff=(o_p)./(input_power);
n=linspace(0.7,0.95,10);
grid off
box off
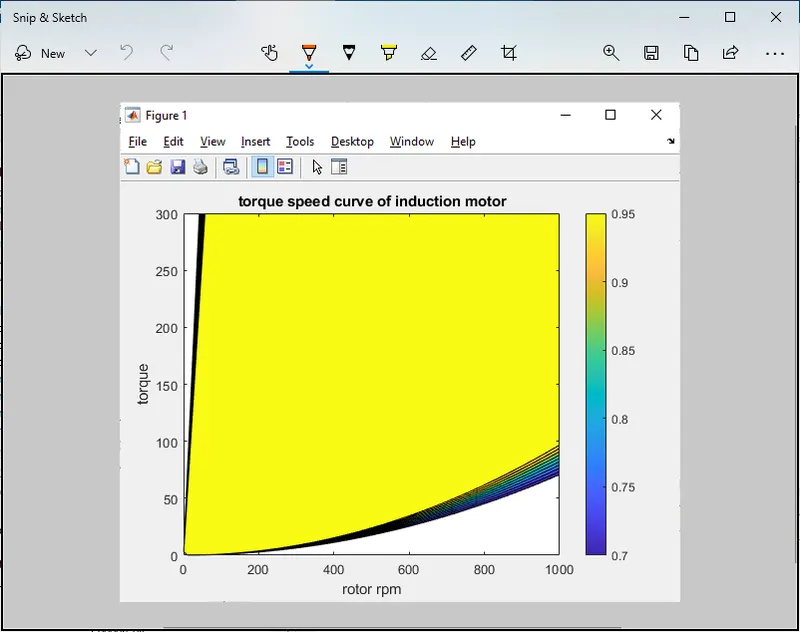
contourf(x,y,eff,n);
colorbar
xlabel ('rotor rpm')
ylabel('torque')
zlabel('efficiency')
title ('torque speed curve of induction motor')
figure
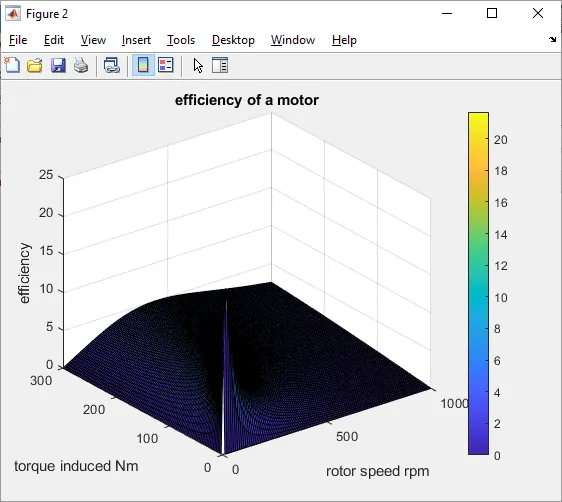
surf(x,y,eff)
colorbar
xlabel('rotor speed rpm')
ylabel('torque induced Nm')
zlabel('efficiency')
title('efficiency of a motor')
Outcomes of this Challenge are:
- For a defined driving cycle, calculated the energy required for braking.
- Gave reasons for why electric motor can’t develop braking torque at high speed similar to starting and how electric and mechanical brakes are coordinated with detailed examples
- Made a MATLAB program which plots contour of given motor speed, torque and efficiency values. Attached the code as a .m file attach a screenshot of all the plots.