Week-11 Challenge: Braking
1 FOR A DEFINED DRIVING CYCLE,CALCULATE THE ENERGY REQUIRED FOR BRAKING
Braking is the process of controlling the velocity of an object by inhibiting its motion. An object in motion possesses kineticenergy and to bring the object to a stop this kinetic energy must be removed. Removing the kinetic energy can be accomplished by dissipating the energy to the atmosphere through friction or by converting it into another form of energy. The most common type of braking is a mechanical brake which inhibits motion through friction brake pads. A mechanical brake applies a friction force to convert the kinetic energy of the vehicle into thermal energy which then dissipates into the atmosphere.Braking systems which don't use friction are referred to as regenerative braking systems (RBSs). In RBSs, the kinetic energy is converted into other forms of useful energy, which can be stored for later use, increasing the fuel efficiency.
Equation for Braking forces = .5*mass*(finalvelocity-initialvelocity).
Calculations of Braking Energy
A Matlab program is developed to calculate the brking energy and plot its graphs.
Firstly a driving cycle is fed in an excel sheet and that is imported to matlab program.
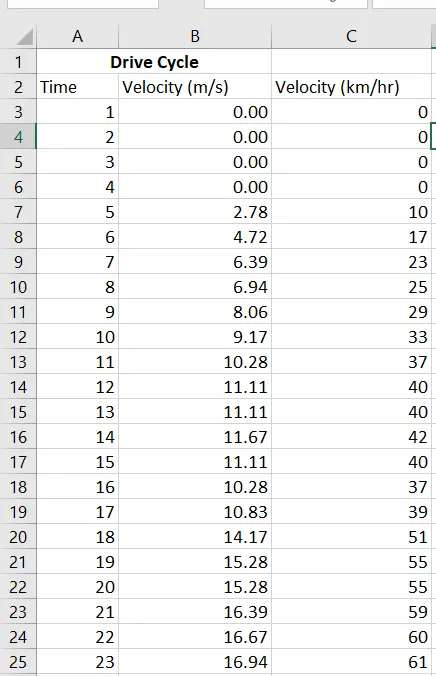
MATLAB PROGRAM
%total mass of vehicle
mass=1000;
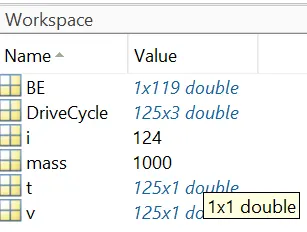
 t = DriveCycle(:,1);
v = DriveCycle(:,2);
for i =1:(length(DriveCycle)-1)
    if v(i)>v(i+1)
        BE(i) = .5*mass*(v(i)-v(i+1)^2);
    end
end
fprintf('total brake energy is %d',sum(BE));
fprintf('Average brake energy is %d',mean(BE));
%plotting the results
figure(1)
subplot(2,1,1)
plot(t,v,'linewidth',3,'color','g')
xlabel('time(s)')
ylabel('velocity(m/s)')
title('drivecycle')
subplot(2,1,2)
plot(BE,'linewidth',3,'color','r')
xlabel('time(s)')
ylabel('brakingenergy')
All the inputs are described in the program only.
t and v are the time and velocity which are taken from the drivingcycle in excelsheet.
By using a for loop the brake energy is calculated.
The drive cycle and braking energy are plotted in graph by plot command
outpiut graph
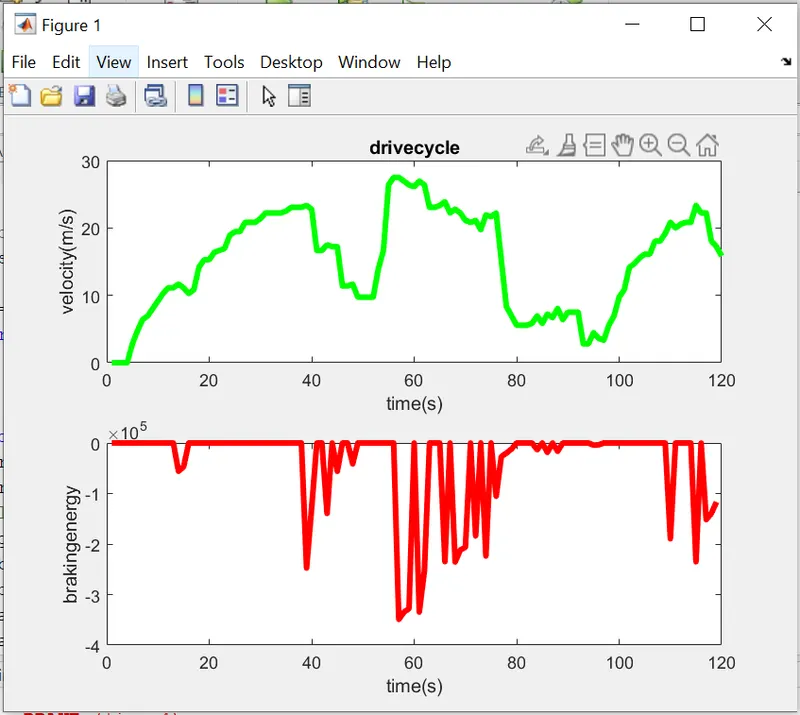
The first graph reresents driving cycle and the second braking energy forces.

The average braking energy is displaye din command window.
2 WHY ELECTRIC MOTOR CANNOT DEVELOP BRAKING TORQUE AT HIGH SPEED SIMILAR TO STARTING?
The given figure explains about the torque speep characteristics in contour.
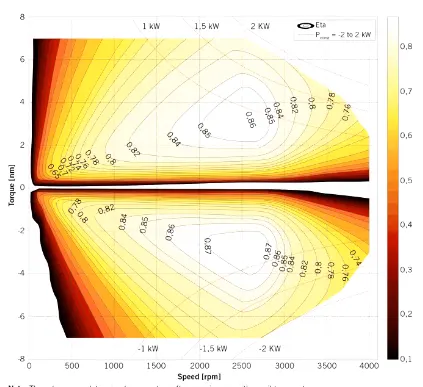
the graph explains the speed torque characteristics with efficiency in two quadrant1(forward motoring) and quadrant2(forward braking).
Value of torue from low speed the torque required are almost constant.therefore it has higher power.
The vehicle reaching to 100kmphr the torque is not constant but the speed region is constant.
Its easy for a vehicle to reach 0 to 100 however when it comes to braking part where torque is negative.
The second quadrant which indicates negative torque characteristics at this point(high speed) the braking torque which is around -4 compare to the peak torque at 7Nm.so the motor cannot develop the braking torque at high speed.
The peak acceleration and peak deceleration Torque are not equal for electric vehicle motor.
The Braking torque of electricvehicle is not higher as acceleration torque.therfore the regenerative braking cannot happen so effectively that all the power back to the battery.
HOW ELECTRIC AND MECHANICAL BRAKES ARE COORDINATED?
Braking is used to stop the vehicle at required time and position.The total braking force must be sufficient to meet vehicle deceleration commanded by driver.To meet the sufficient braking forces the brake control strategies are built.
Brake control strategies
Series brake control - The mechanical braking and electric braking are done one after other.
Parallel brake control - Both the mechanical and electric brakes are applied at same time.
Bothe the mechanical and electric braking are required for perfect braking system.
Mechanical braking - This are the disc and drum brakes which are used to slow doen the vehicle by friction loss.
Electric Braking -Reducing the speed of motor by varying flux and torque.The types of electrical braking are regenerative braking,plugging braking and dynamic braking.
3 MAKE A MATLAB PROGRAM WHICH PLOTS CONTOUR OF GIVEN MOTORS SPEED,TORQUE AND EFFICIENCY VALUES.
TYPES OF LOSSES
1 COPPER LOSS = Kc*T^2
I^2*R , where R is the armature resistance and we say that torque is proportional to current,this copper loss can be consider as to take care of resistance of brushes and also take care of flux and its effect.
2 IRON LOSS = Ki*w
These are the magnetic losses where factor is based on the magnetic field effect.For permanent magnets have constant magnetic field and this iron losses is based on the value of this are ging to change according to the speed. at various speed have different value of back emf and that is going to effect the iron loss.
3 WINDAGE LOSS = Kw*w^3
This is a mechanical friction of windage losses.this is based on size of shape of motor and the amount of windage losses that the motor is going to experience
4 CONSTANT LOSSES = C
TOTAL LOSSES = Kc.T^2+Ki.w+Kw.w^3+C
These losses are applicable for permanent magnet DC motors but other motors as well like induction motors.
MATLAB program developed for plotting efficiency in countour.
clear all
close all
clc
w = linspace(0,1000);
t = linspace(0,250);
%motor constants.
%copper loss
kc = .2;
%iron loss
ki=.008;
%windageloss
kw=.00001;
%constant losses
conl=20;
%making mesh
[x,y] = meshgrid(w,t);
outputpower = (x.*y);%torque*speed=power
b=(y.^2)*kc; %copper losses
c = (x.^3)*kw %winding losses
d = x*ki %iron losses
inputpower = outputpower+b+c+d+conl;
z = outputpower/inputpower
% set the efficiencies for which the contors will be plotted
v = [.70,.75,.80,.82,.85,.87,.89,.90,.92];
box off
grid off
contour(x,y,z,v);
xlabel('speed(rad/sec)');
ylabel('torque(Nm)');
hold on
v = [8000,10000];
contour(x,y,outputpower,v);
The program is developed in logic based on the equations for losses as described.
Two linspace values are given for speed and torque.
All the variables in the program are defined in the code section only.
contour is used two plot 3 dimensional polts in 2D.
At the ending of program the 8000 and 10000 watts are given to check the torque in specified power.
Output contour plot
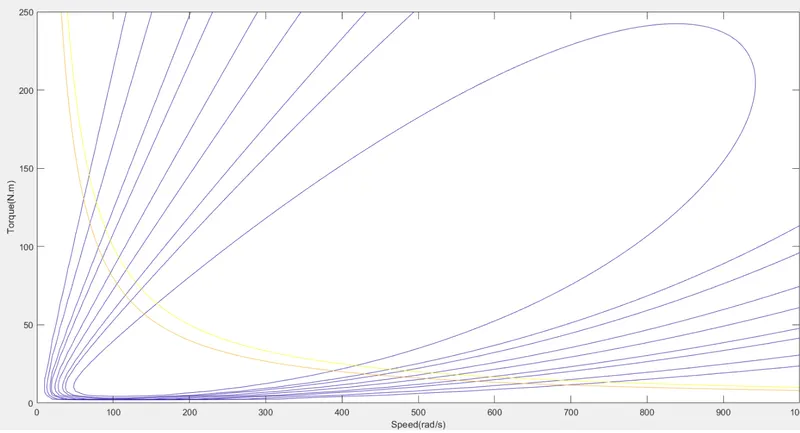
It is clear from the graph that contours are group of efficiencies
Inner cotours have high efficiency and going outwards decreses the efficiency.
The yellow graph represents the torque speed charecteristics to produce 8 and 19 kw respectively