Week-11 Challenge: Braking
Question 1: For a defined driving cycle, calculate the energy required for braking.
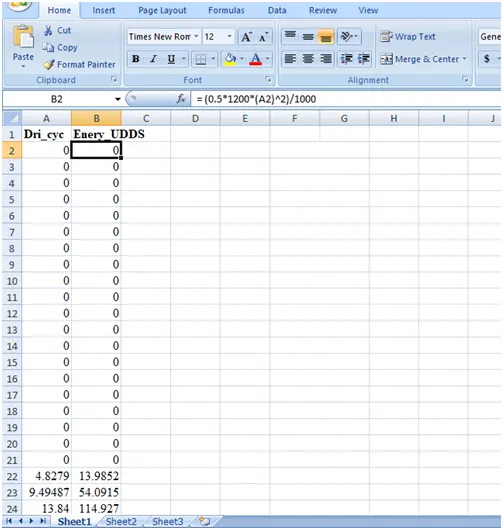
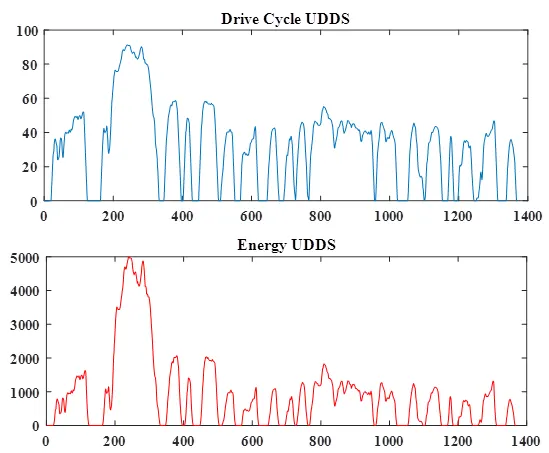
Solution 1: Drive cycle date shown in excel sheet is of UDDS drive cycle. Formula used to calculate drive cycle is given below:
`E=((1/2*m*v^2)/1000)`
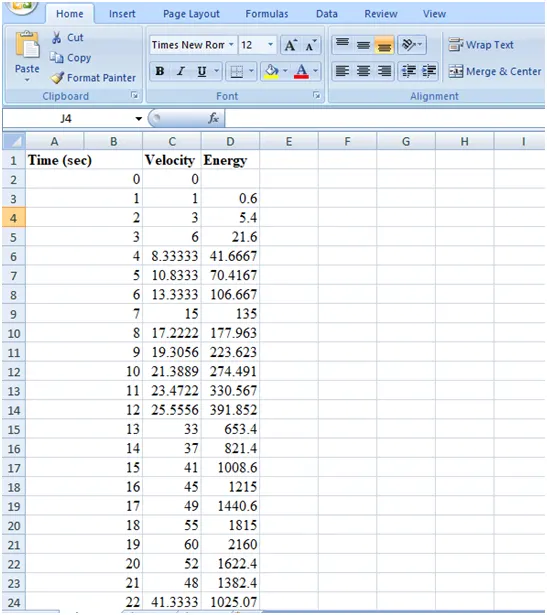
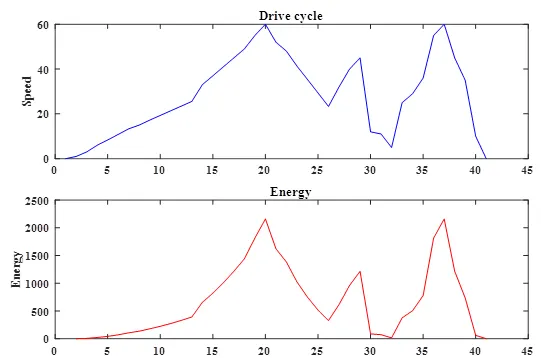
Another random drive cycle is taken and energy is calculated with respect the drive cycle.
Question 2: Why electric motor can’t develop braking torque at high speed similar to starting? How electric and mechanical brakes are coordinated?
Solution 2: Sometimes after accelerating we can't reach the maximum torque. The reason is that no matter how much the current loop wants to increase current (proportional to torque) by increasing the PWM duty cycle of the power stage, the motor voltage is too close to battery voltage (Vbemf) and therefore current can't increase more.
This situation does not occur at the beginning of acceleration because most of the torque is used to increase the kinetic energy of the load (and motor). But when the speed is already high and no extra load is applied it is not possible to increase the torque.
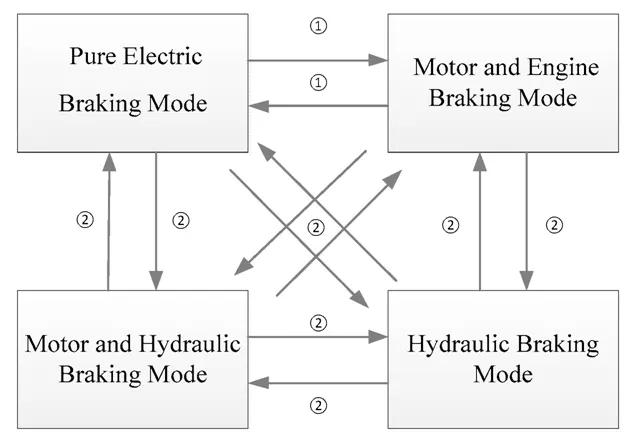
There are four main braking modes: pure electric braking mode, motor and engine braking mode, motor and hydraulic braking mode, and hydraulic braking mode
Hybrid vehicles usually have several braking systems, and braking mode switches are significant events during braking. It is difficult to coordinate torque fluctuations caused by mode switches because the dynamic characteristics of braking systems are different. The control strategy is achieved by controlling the change rates of clutch hold-down and motor braking forces. The control strategy is achieved by simultaneously changing the target braking torque during different mode switch stages and controlling the motor to participate in active coordination control.
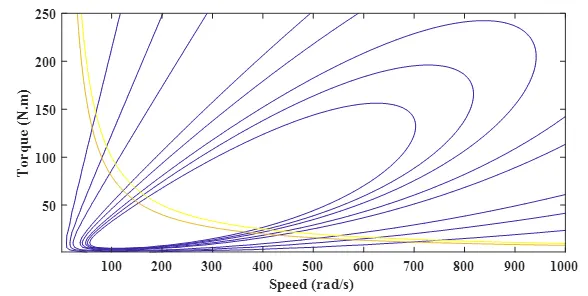
Question 3: Make a MATLAB program which plots contour of given motor speed, torque and efficiency values. Attach the code as a .m file attach a screenshot of all the plots.
Solution 3:
x=linspace(1,1000); %speed, N.B rad/s not rpm
y=linspace(1,250); % 0 to 40 N.m
%% allocate motor loss constants
kc=0.2; % for copper losses
ki=0.008; % for iron losses
kw=0.00001; % for windage losses
ConL=20; % for constant motor losses
%% Now make mesh
[X,Y]=meshgrid(x,y);
Outputpower=(X.*Y); % torque=x speed=y
B=(Y.^2)*kc; % copper losses
C=X*ki; % iron losses
D=(X.^3)*kw; % windage losses
Inputpower=Outputpower + B + C + D + ConL;
Z=Outputpower./Inputpower;
%% We now set efficiencies for which countour will be ploted.
V=[0.70,0.80,0.85,0.90,0.91,0.92,0.925,0.93];
box off
grid off
contour(X,Y,Z,V);
xlabel ('Speed (rad/s)'), ylabel ('Torque (N.m)');
hold on
%%Now plot a contour of power output
% The array power output has already been calculated. We draw contours at 3
% and 5 kW.
V=[8000,10000];
contour(X,Y,Outputpower,V);