Week-11 Challenge: Braking
`Fa = ma = - 832.8 N`AIM:
- For a defined driving cycle, calculate the energy required for braking.
- Why electric motor can’t develop braking torque at high speed similar to starting? How electric and mechanical brakes are coordinated?
- Make a MATLAB program which plots contour of given motor speed, torque and efficiency values. Attach the code as a .m file attach a screenshot of all the plots.
OBJECTIVE:
Energy required for braking, braking torque Vs Starting torque and cordination of mechanical and electrical brakes, Contour plots of efficiency with torque and speed.
AIM 1:
For a defined driving cycle, calculate the energy required for braking.
To get the idea of braking energy we will keep our driving cycle very simple with following events:
1) 0 to 50 kmph in 20 seconds (acceleration)
2) constant speed of 50 kmph for 5 minutes (cruise)
3) 50 to 0 kmph for in 20 seconds (deceleration, where the actual braking energy is to be calculated).
With many such events a larger drive cycle can be created and excel sheet with calculations can be plotted accordingly. But that will make the procedure unclear, so we will do calculation theoritically to observe formulas working behind it.
Vehicle parameters and force constants:
`rho= 1.2 kg/m3, Cunderset(D)() = 0.35, A= 2.5 sqm, mu = 0.013, weight = 1200 Kg, Gradient=0overset(0)()`
For first 20 sec:
V = (13.89/20)t = 0.694 t
`Fd = 0.525*v^2 = 0.364t^2N`
`Frr = 153.036 N`
`Fa = ma = 832.8 N`
`Funderset(trac)() = Fd + Frr + Fa = 0.364t^2+ 984.84`
Energy consumed(Wh)= `Punderset(trac)()*(dt/3600) = (0.252t^3+ 683.47 t)/3600`
Total energy consumed in 20 sec= `int_0^20 (0.252t^3 + 683.47 t)/3600dt = 40.77` Wh
For next 5 min:
`v = 13.89` `ms^-1`
`Fd = 0.525*v^2= 101.29 N`
`Frr = 153.036 N`
`Fa = ma = 0 N`
`Funderset(trac)() = Fd + Frr + Fa = 254.32 N`
`Punderset(trac)() = Ftrac*v = 3532.58 N`
Energy consumed(Wh)= `Ptrac*(300/3600) = 294.38` Wh
For last 20 sec (Braking period):
The aero drag and rlling resistance remain same as first 20 sec
`Fd = 0.525*v^2= 0.364t^2 N`
`Frr = 153.036 N`
`Fa = ma = - 832.8 N`
`Funderset(trac)() = Fd + Frr + Fa = (0.364t^2- 679.76)`
`Punderset(trac)() = Funderset(trac)()*v = (-0.252t^3+ 471.75t)`
Braking Energy (Wh)= `Punderset(trac)()*(dt/3600) = ((-0.252t^3 + 471.75t))/3600`
Average Braking energy required in 20 sec= `int_0^20 (-0.252t^3 + 471.75 t)/3600dt = 23.41` Wh
Hence the braking energy required by vehicle to come to rest is 23.41 Wh. Which can be supplied back to battery using regenerative braking.
=============================================================================
AIM 2:
Why electric motor can’t develop braking torque at high speed similar to starting? How electric and mechanical brakes are coordinated?
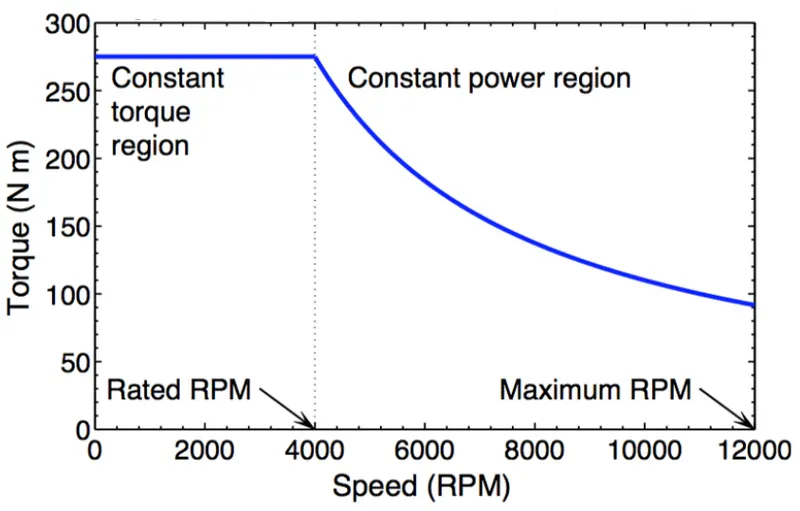
Motor characterstics shown above has two regions constant torque region and constant power region. At starting motor has low speed so it is able to develope high torque and as speed reaches to the rated value the motor enters constant torque region. This same char. is applicable when motor is running as generator. simply putting motor/generator follows the rule of low speed-High torque and High speed-low torque.
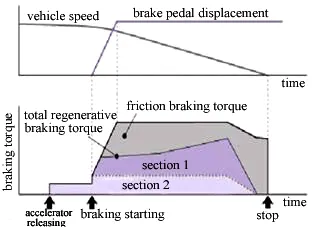
Electric and mechanical brakes coordination:
=============================================================================
AIM 3:
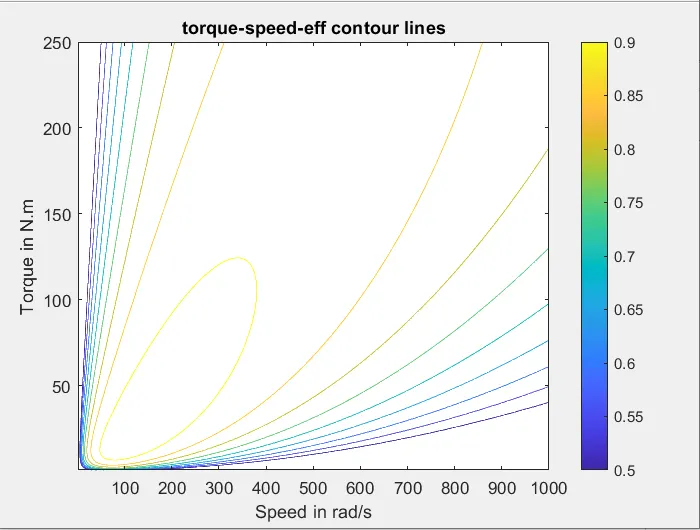
Make a MATLAB program which plots contour of given motor speed, torque and efficiency values.
close all
clc

x = linspace(1,1000,250); %speed
y = linspace(1,250,250);  %Torque

kc = 0.2;     %Copper Loss constant
ki = 0.006;   %Iron Loss Constant
kw = 0.00004; %Windage Loss Constant
CL = 30;      %Constant loss

[X,Y] = meshgrid(x,y);
Pout = X.*Y; %o/p power

Cu_loss = kc*(Y.^2);     %Copper loss
Ir_loss = ki*X;          %Iron loss
Win_loss = kw*(X.^3);    %Windage loss

Pin = Pout + Cu_loss + Ir_loss + Win_loss + CL;    %i/p power
eff = Pout./Pin;                                   %Efficiency

%plot
N = [0.5,0.55,0.6,0.65,0.7,0.75,0.8,0.85,0.9,0.95];
box off;
grid off;
contour(X,Y,eff,N);
colorbar;
xlabel('Speed in rad/s');
ylabel('Torque in N.m');
zlabel('efficiency');
title('torque-speed-eff contour lines');
Plot results: