Week 10 - Simulating Combustion of Natural Gas.
Aim: Battery Thermal Management System
Problem Statement:
Perform the heat transfer analysis using ANSYS-Fluent software for the cylindrical Lithium-ion Battery with heat generation boundary conditions. Create an enclosure and use air as the working fluid for cooling the battery back system (4 x 2).
Take the air inlet temperature as 26°C and the space between the batteries as 2 mm / 4mm / 6mm.
Property of the Lithium-ion Battery :
Nominal Voltage = 3.6 V
Nominal capacity = 2.2 A
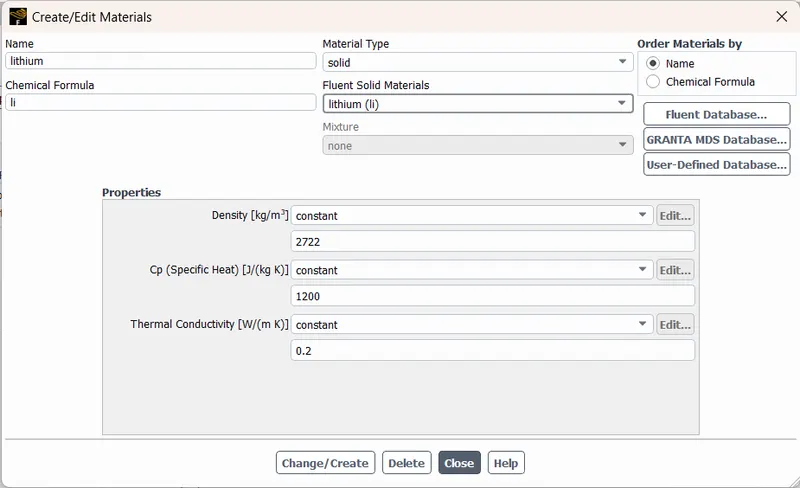
Density = 2722 kg/m3
Specific heat = 1200 J/kg.K
Thermal Conductivity = 0.2 W/m.K
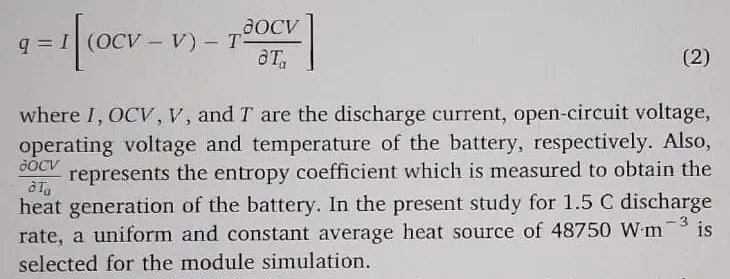
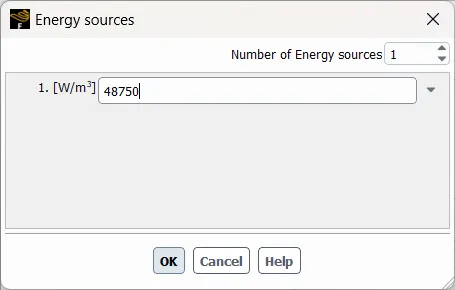
Heat Source = 48750 W/m3 (1.5 C discharge rate)
Size of the Battery = 18 mm diameter and 65 mm height.
Expected results:
• Explain why battery cooling is needed. And give a brief description of various
techniques for battery cooling.
• Perform Mesh independent study for any one case and based on your judgment
use the more suitable model for further cases.
• Simulate by varying the velocity of air as 3, 5, and 10m/sec and discuss
the results.
• Find out the maximum temperature and heat transfer coefficient obtained by the
battery.
• Based on the results and on your judgment, select one case (3, 5, or 10 m/s) and
vary the space between the batteries as 2, 4, and 6 mm, then discuss the results.
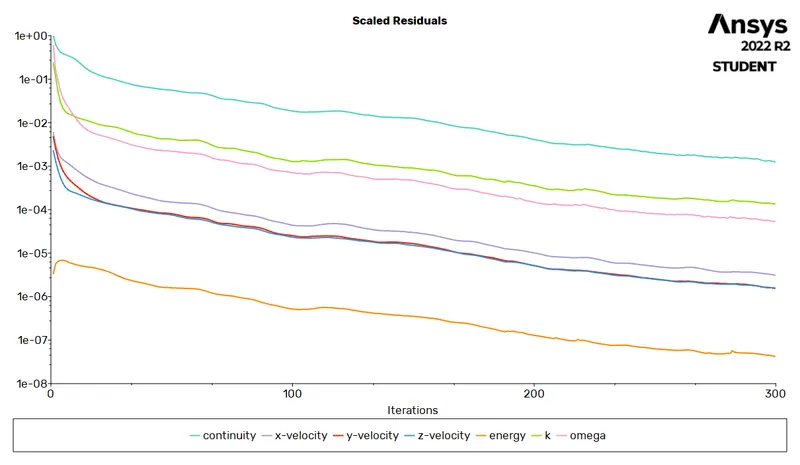
• Prove that the simulation has achieved convergence with appropriate images and
plots (Velocity and temperature contour plots on the cut planes).
• Create the animation to observe the temperature distribution and velocity vector.
• Summarize the results in tabulation/ graphical form.
• State the inferences based on the results
THEORY OF BATTERY THERMAL MANAGEMENT SYSTEM(BTMS):
Battery thermal management system(BTMS) is a design approach of cooling technologies. Before studying BTMS we should know the application and main usage of battery management systems.
As we know conventional vehicles use petrol and diesel which indeed cause environmental pollution and energy scarcity which are the two major problems faced in the world. Considering the above situation we have come up with electric vehicles where the vehicle's main power source depends on the battery. The market of electric vehicles consists of different types of batteries such as lead-acid, nickel-cadmium, Lithium-ion, Plastic lithium, etc, and their energy source are shown below.
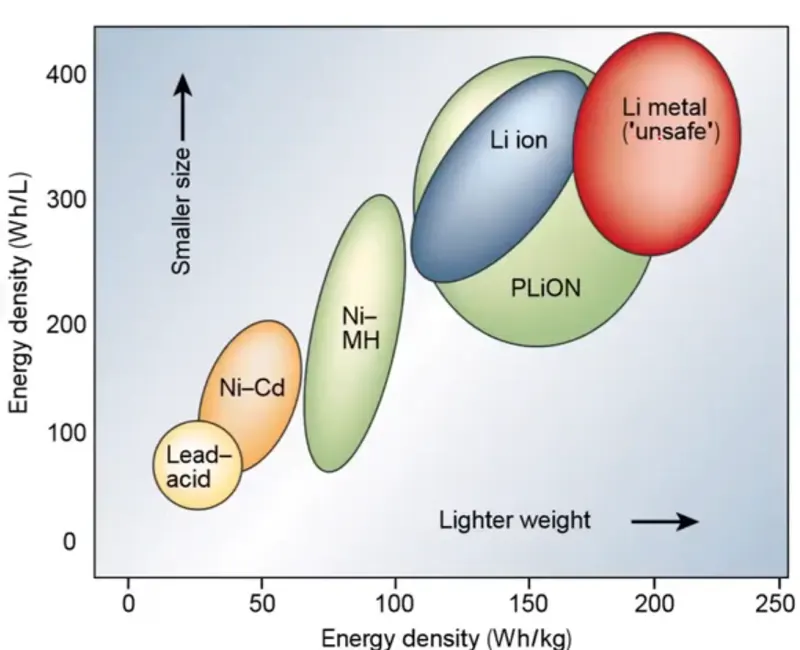
By comparing to all other batteries Lithium-Ion battery has a good energy density of around 350Whr/L(in terms of size) or 200Whr/kg(in terms of weight).
PRINCIPLE OF LITHIUM-ION BATTERY
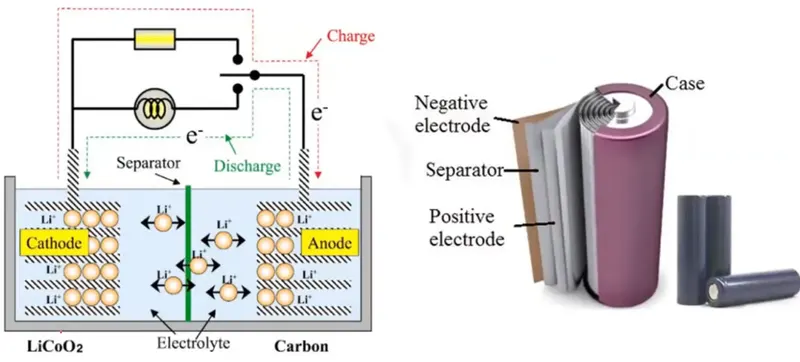
The construction of Lithium-ion batteries consists of the positive(cathode) and negative(anode) electrodes. Here the cathode consists of lithium-ion-based (LiCoO2) and the anode consists of graphite (carbon). A thin plastic membrane called a separator separates both the cathode and anode. The above entire setup is put into the electrolyte called lithium salt-based electrolyte. The working principle is that ions are exchanged between the cathode and anode during the charging or discharging electrons move in the external circuit. During charging elections move from cathode to anode similarly during discharging electrons move from anode to cathode through the external circuits. The battery comes in different shapes such as a cylinder, circle, etc.
Difference between the cell, module, and pack
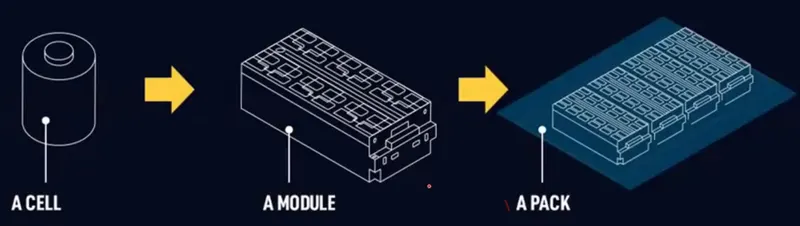
CELL: A single-cell unit device that converts chemical energy to electrical energy.
MODULE: A module is a collection of cells connected in series or parallel. The application of modules is in two-wheeler vehicles.
PACK: A pack is a series of individual modules and protection systems organized in a shape that will be installed in the vehicles. For heavy vehicle applications, we use pack systems.
Types of connections in battery pack/module system
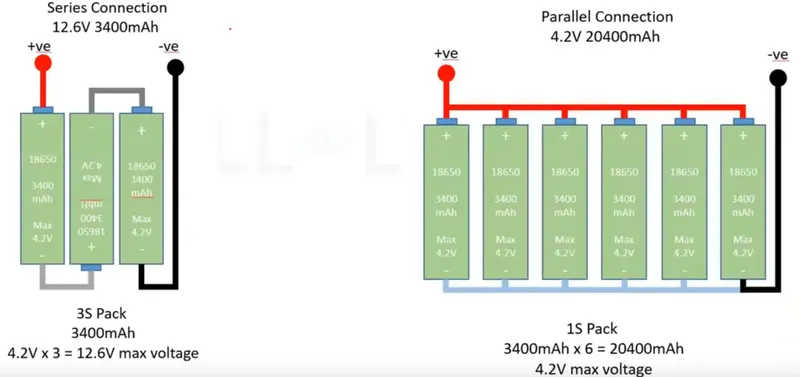
SERIES: Each battery has milliamp hours and volts as specifications, Here each battery has 4.2Volts and 3200mAh so most applications have 12V. Hence 4.2V is not sufficient in order to increase the voltage we connect the batteries in series(we can multiply the voltage hence we get 12V but I can discharge 3400mampH for an hour) which is a positive side to another end and a negative side to another end of the battery as shown in the above figure. Similarly in the PARALLEL connection if we want to increase the amp rating that is 3400mAh is a very small current rating in order to increase the current flow then we have to connect the batteries in parallel which is 3400mAh multiplied by 6 is 20400mAH with a max voltage of 4.2V.
So here I am considering a 4 by 2 Lithium-Ion battery where 2 batteries are connected in series and 2 batteries are connected in parallel.
C-rating is a unit to declares a current value that is used for estimating or designating the expected sufficient time of the battery under variable charge or discharge conditions. As the C-rating increases, the heat generation of the battery increases due to the flow of electrons from the charging or discharging of the battery.
THERMAL RUNAWAY
Thermal runaway is the condition in which the battery catches the fire due to rapid propagation from one damaged cell to another cell. The process of thermal is shown below.
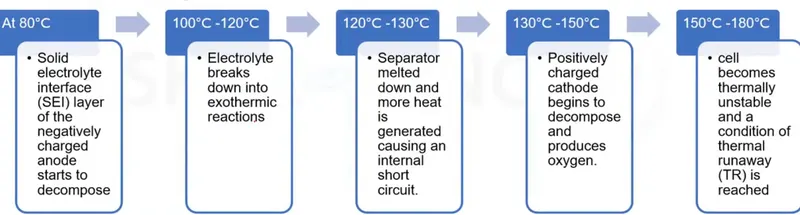
Battery temperature varies due to internal heat generation during the charging and discharging process. The uneven temperature distribution causes temperature non-uniformity which leads to a reduction in the life cycle and performance. It is recommended that the maximum temperature difference inside the battery pack does not exceed 5 degrees. BTMS is necessary to maintain the battery temperature in the desired range and it plays a crucial role in the battery pack life and its overall performance. It is difficult to maintain 15-35 degrees unless we use water/air as the cooling medium we can maintain at least 40 degrees. It all depends on the design of the battery. Hence convection(newton's law of cooling) plays an important role in cooling the system. Here we are using forced convection for cooling the battery system and calculating the heat transfer coefficient.
TYPES OF COOLING LITHIUM_ION BATTERY
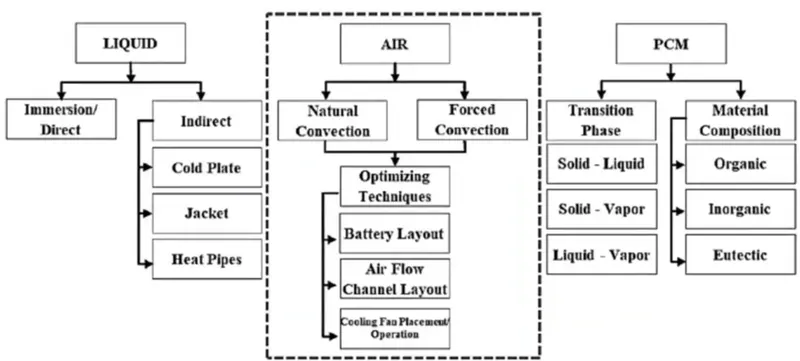
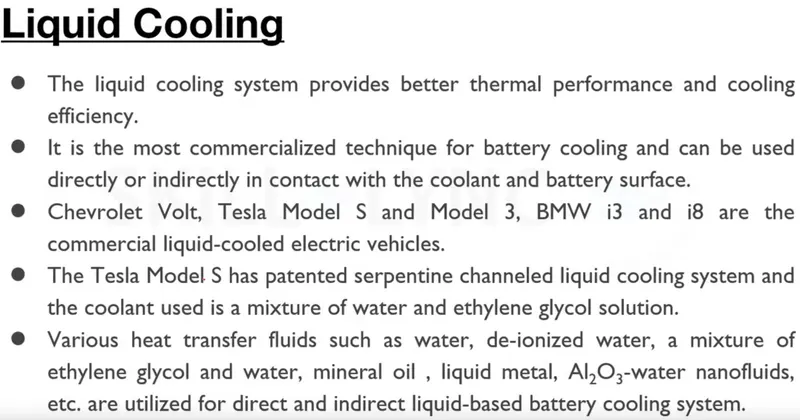
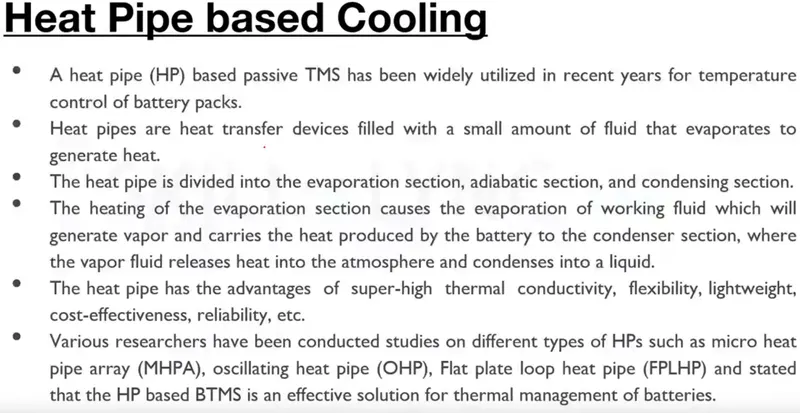
Case 1 :
space between the cells 2 mm & 3 m/sec of inlet fluid velocity :
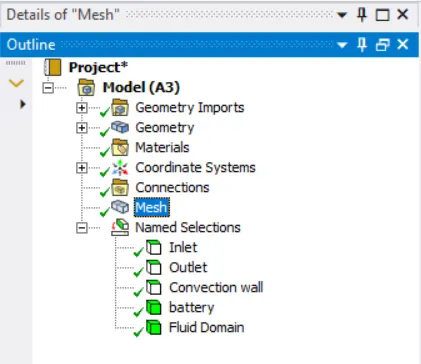
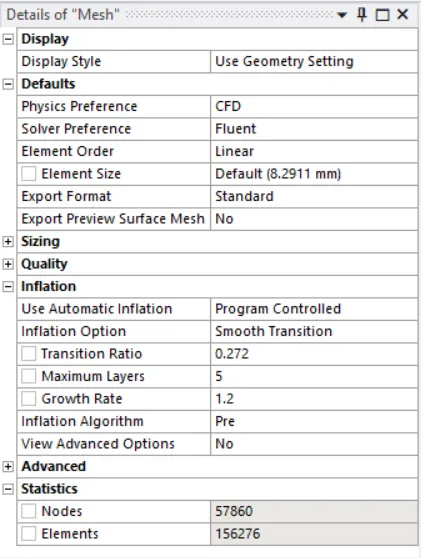
mesh details:
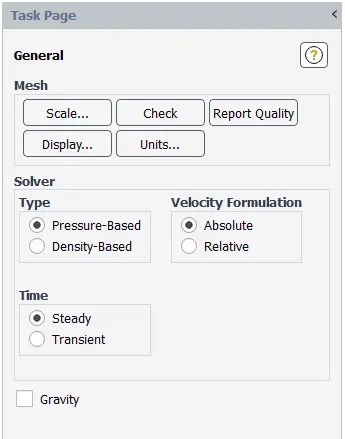
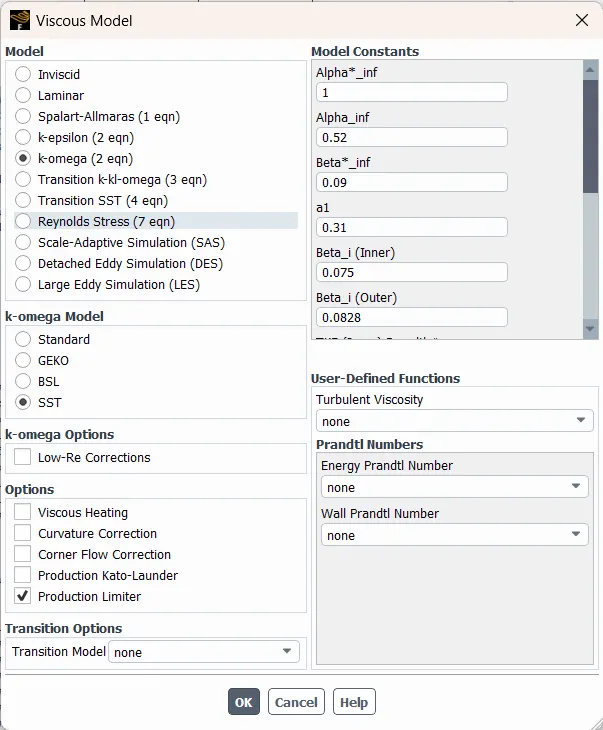
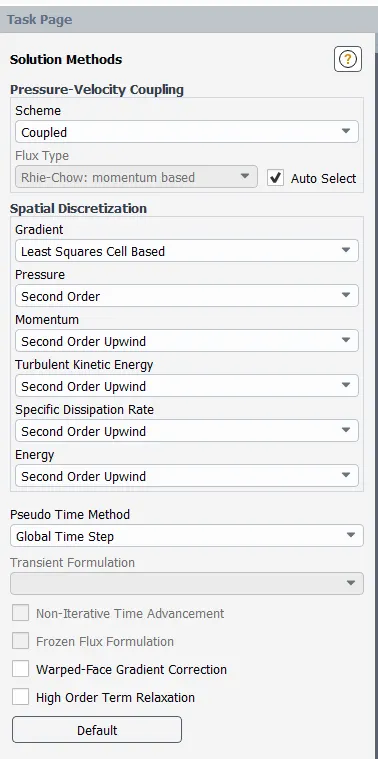
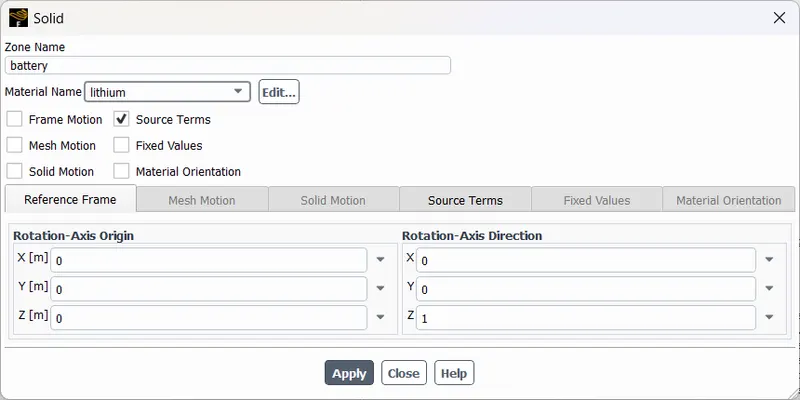
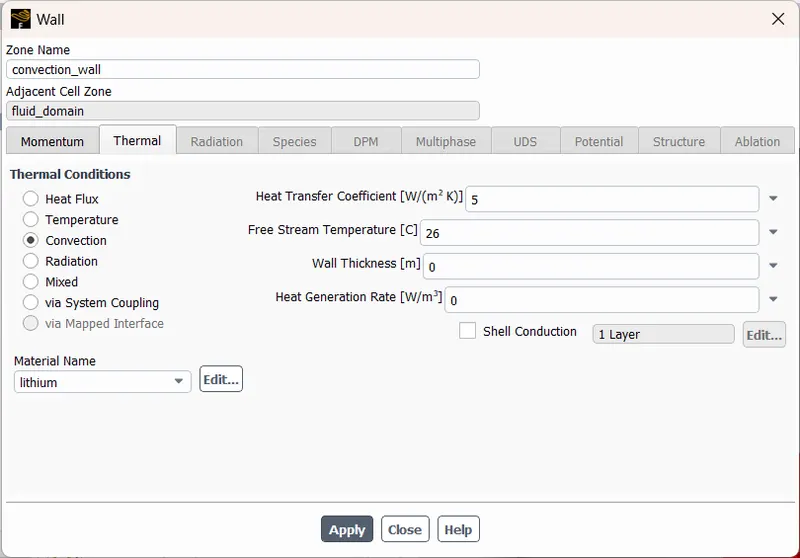
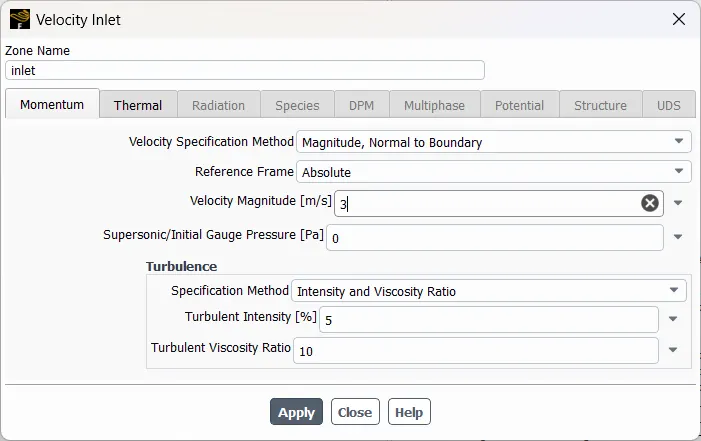
Fluent setup:
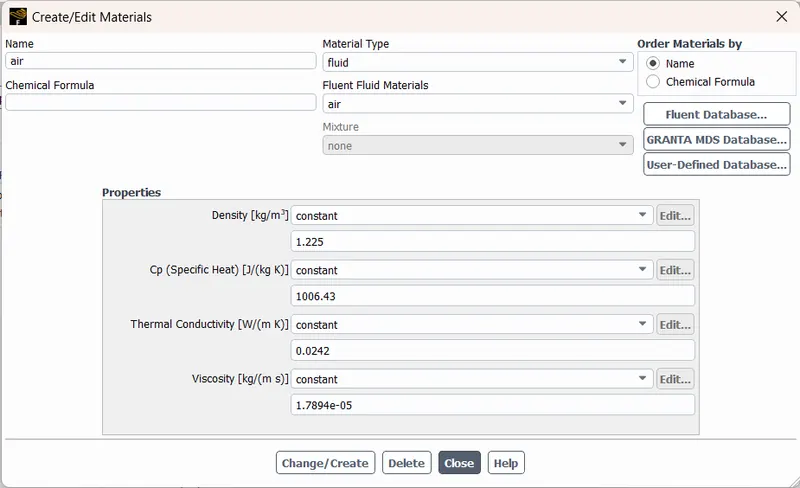
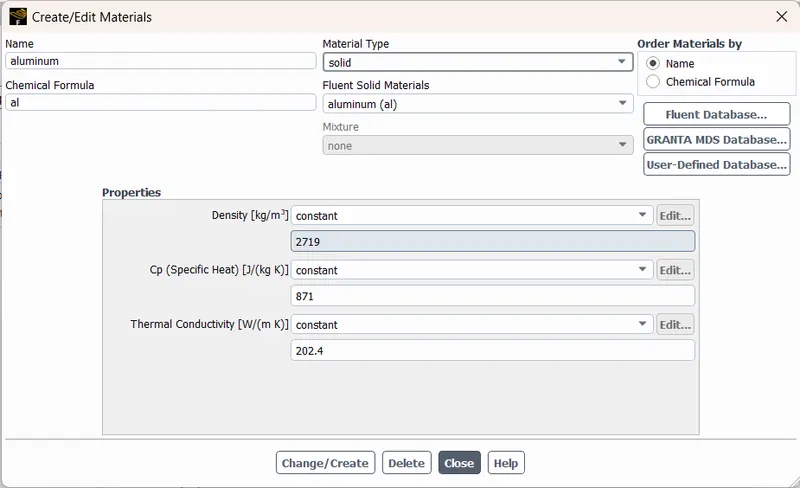
Material:
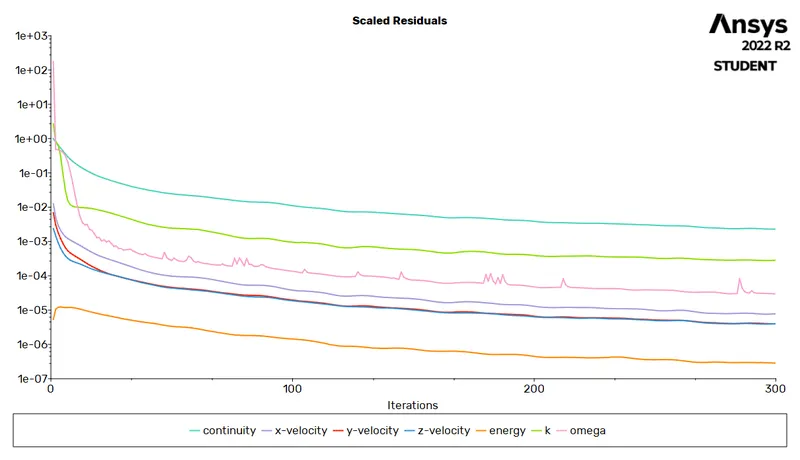
- Residual plot
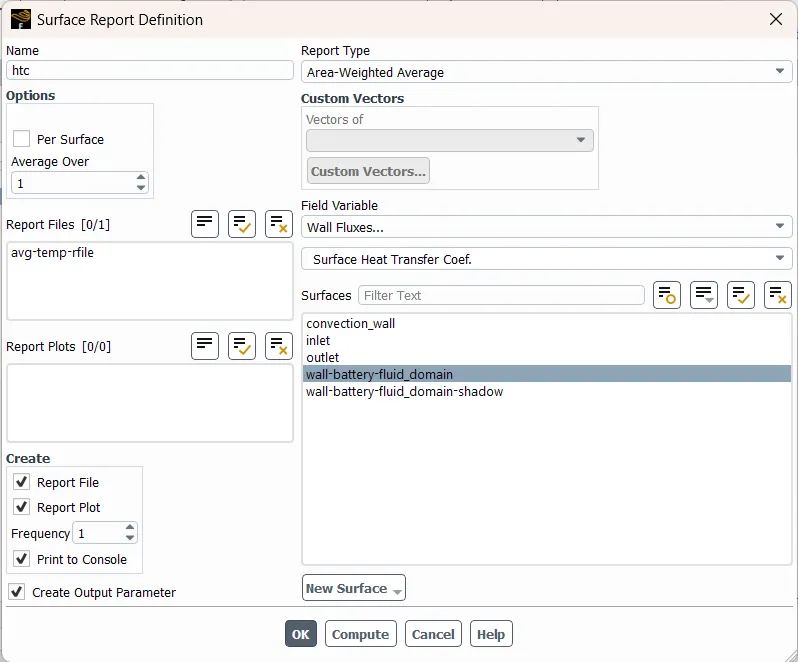
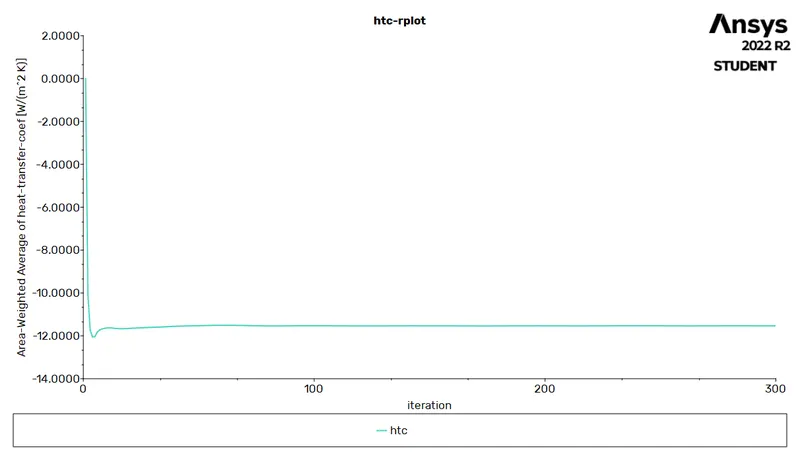
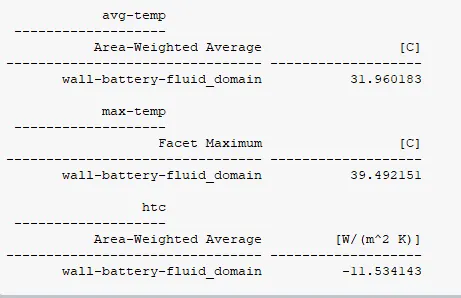
- Heat Transfer Coefficient Plot
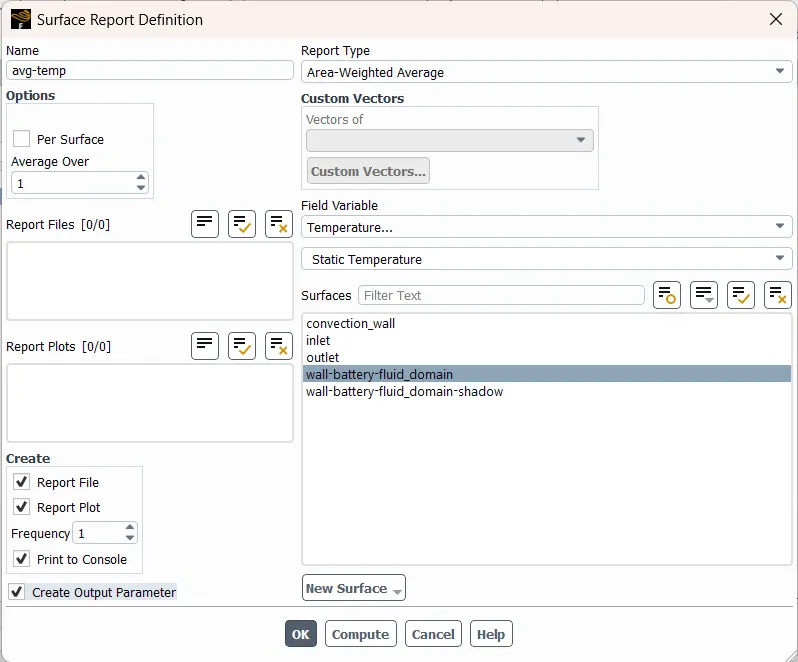
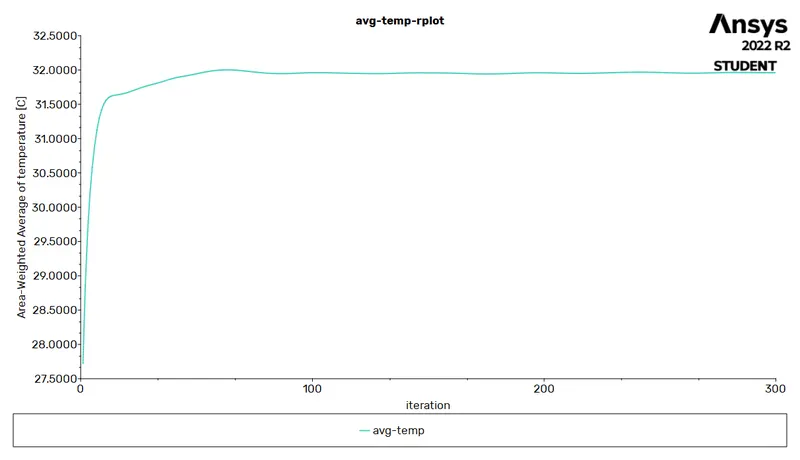
- Average Temperature Plot
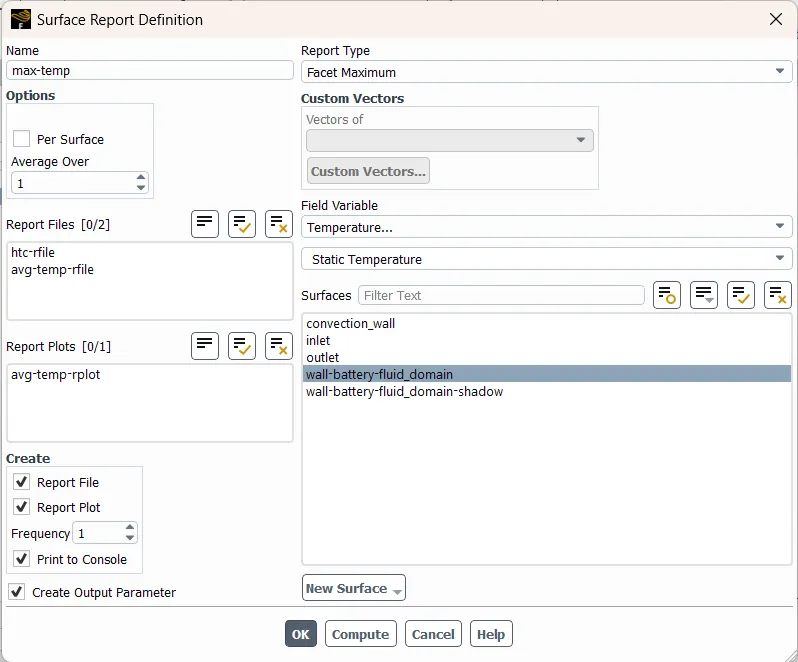
- Maximum Temperature Plot
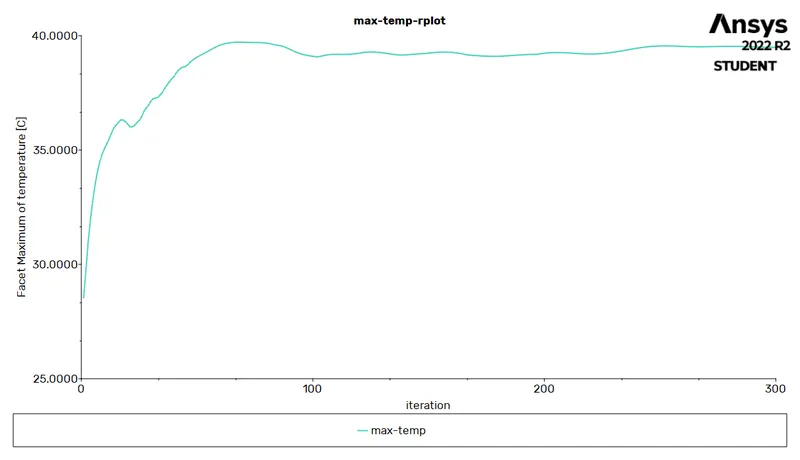
Results:
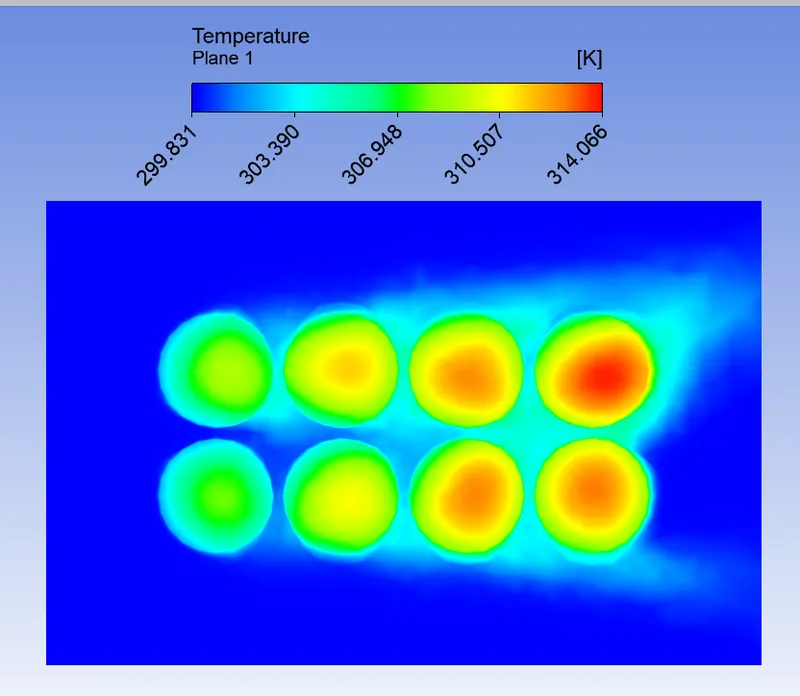
- Temperature Contour
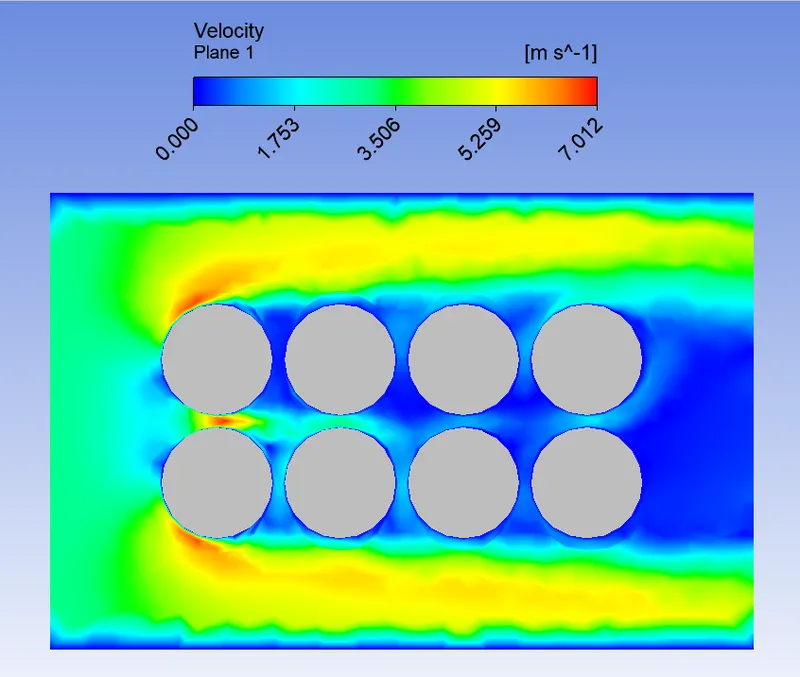
- Velocity Contour
- Vector Plot
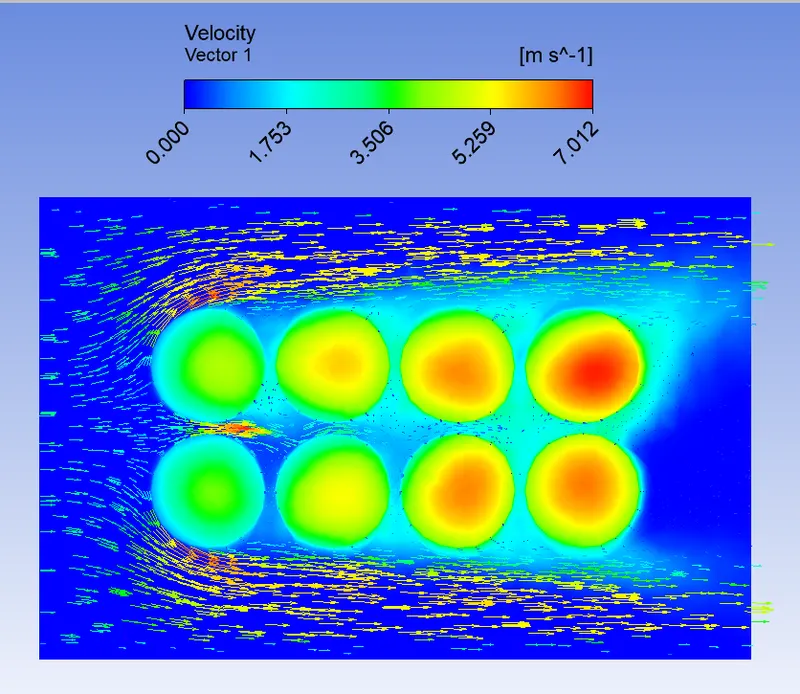
==============================================================================
Case 2 :
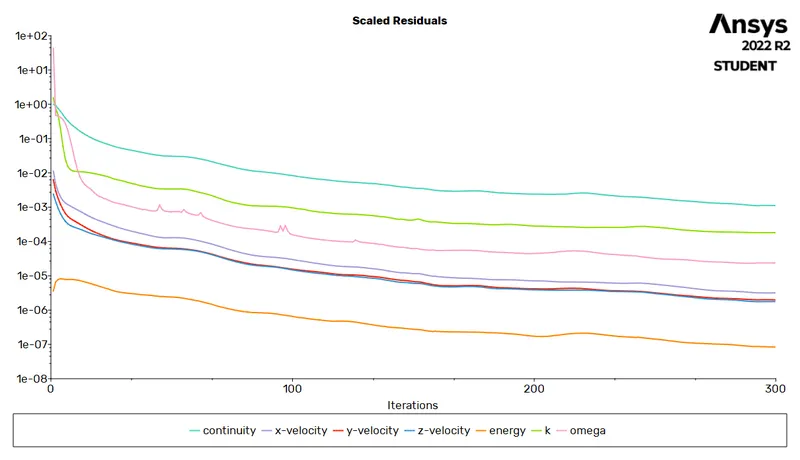
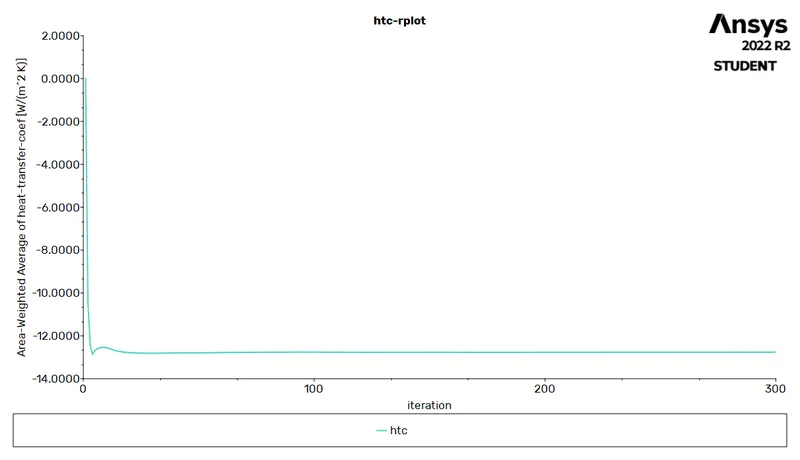
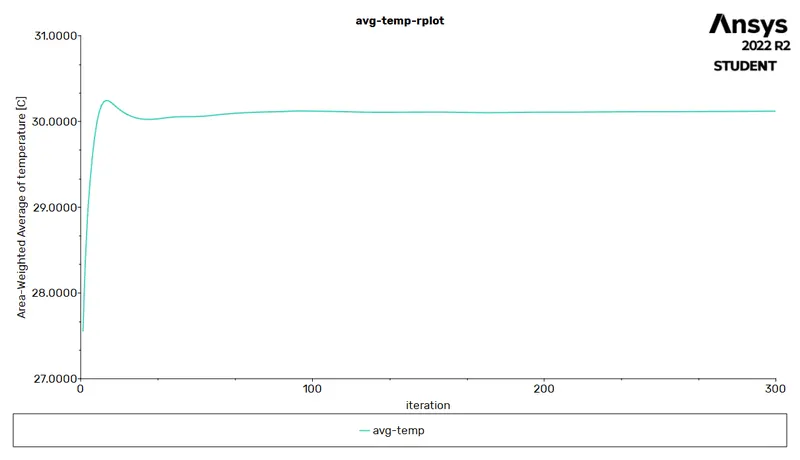
space between the cells 2 mm & 5 m/sec of inlet fluid velocity :
- Residual plot
- Heat Transfer Coefficient Plot
- Average temperature Plot
- Maximum temperature plot
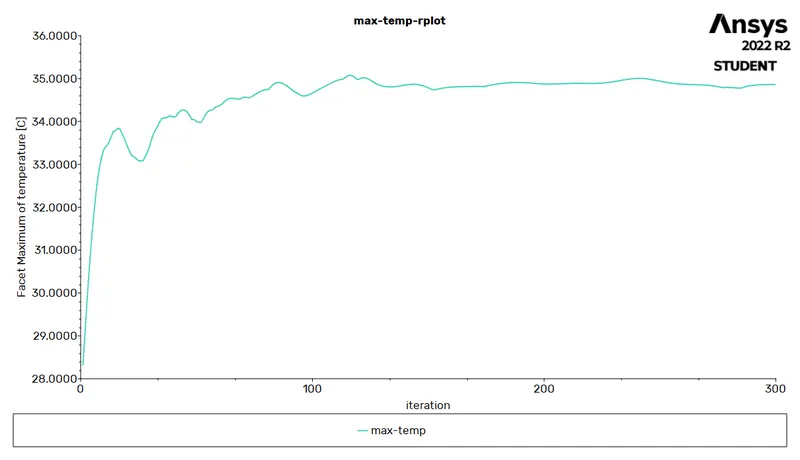
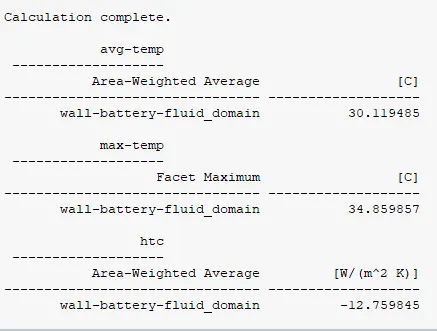
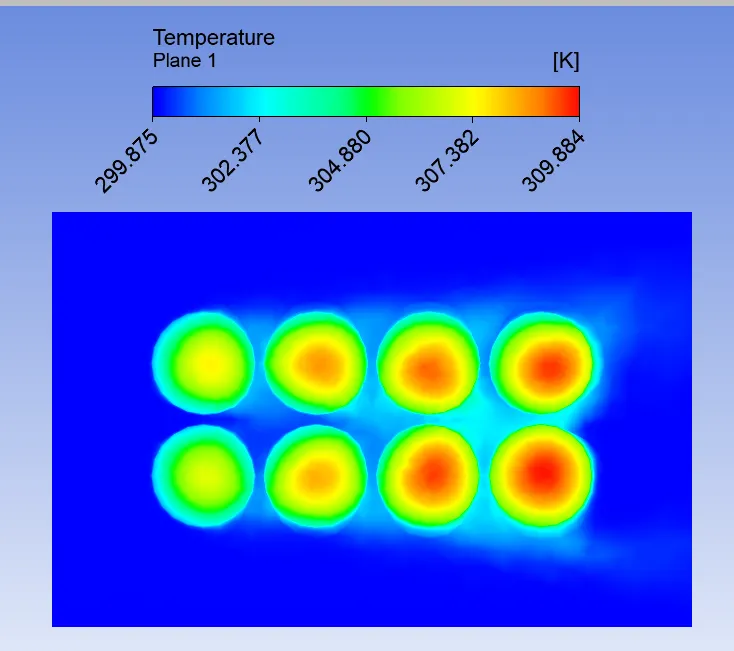
- Temperature contour
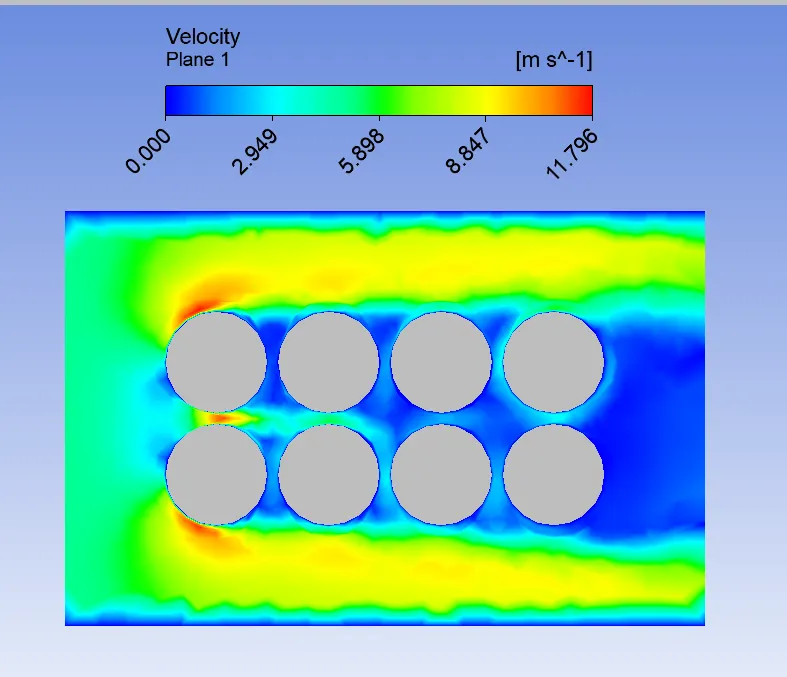
- Velocity Contour
- Vector Plot
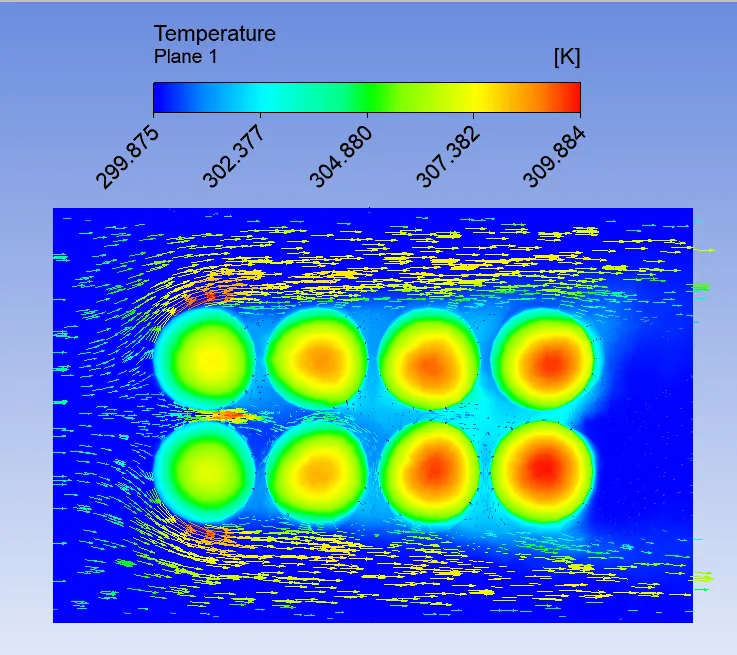
=============================================================================
Case 3 :
space between the cells 2 mm & 10 m/sec of inlet fluid velocity :
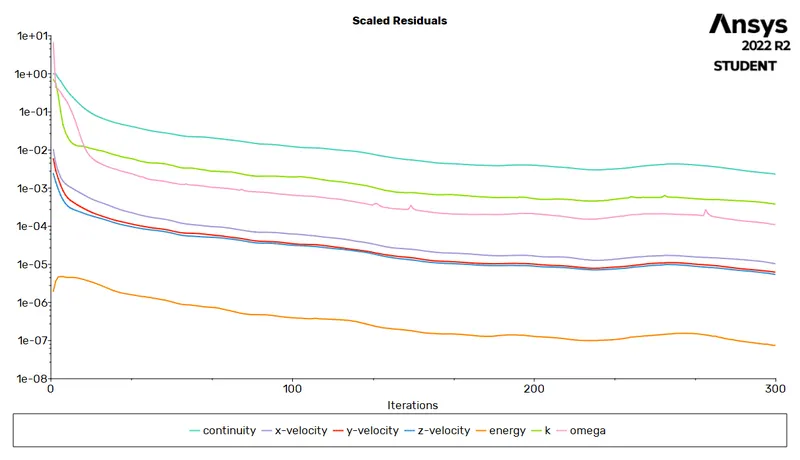
- Residual Plot
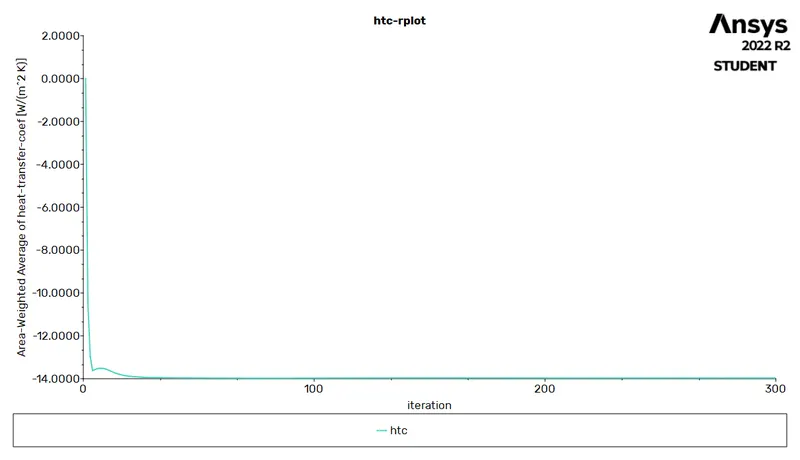
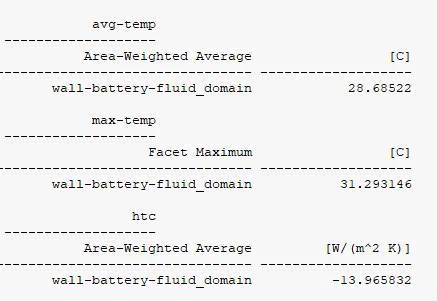
- Heat Transfer Coefficient Plot
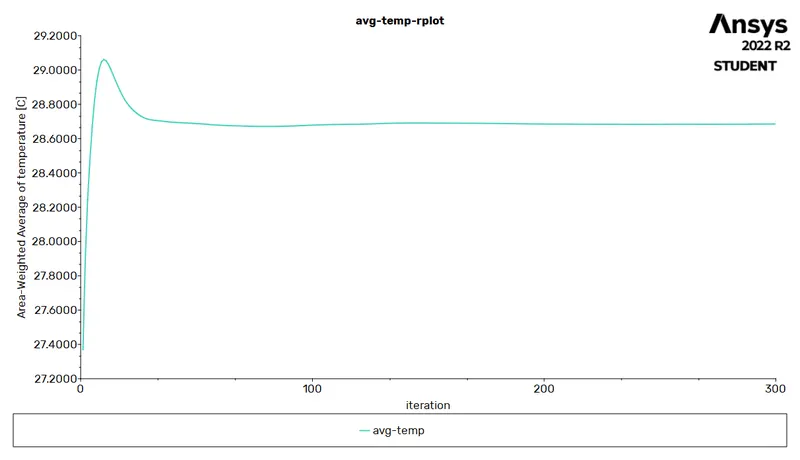
- Average Temperature Plot
- Maximum Temperature Plot
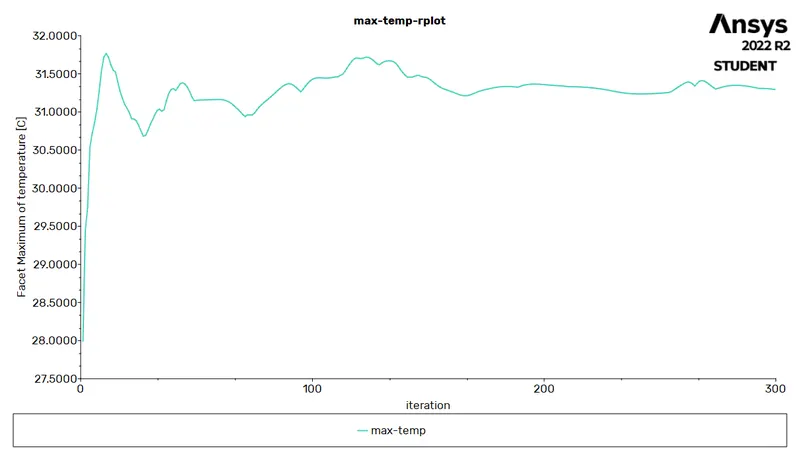
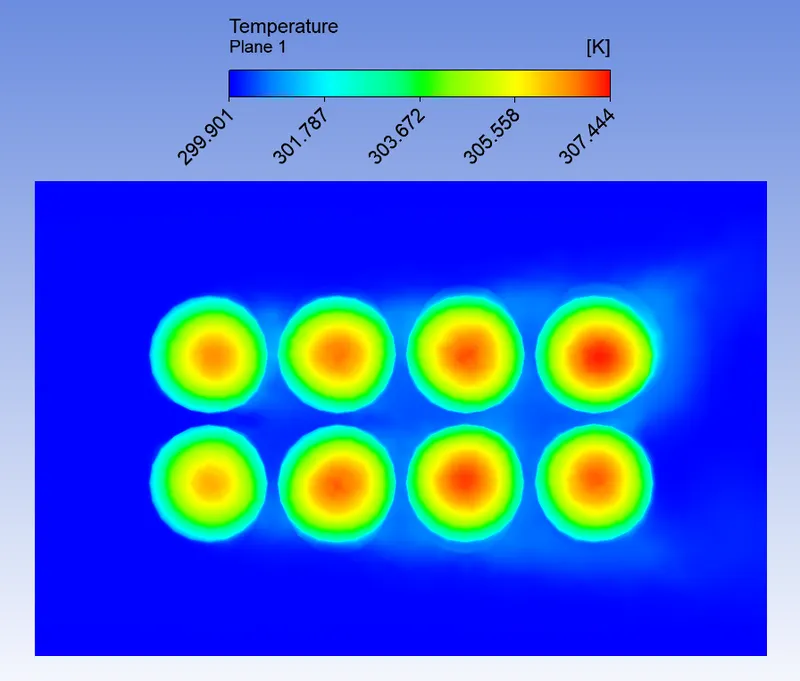
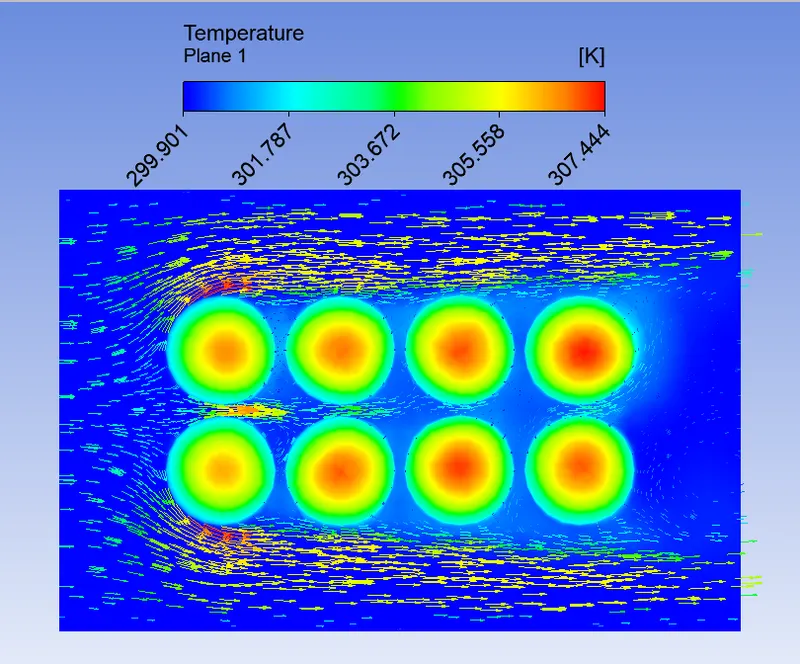
- Temperature Contour Plot
- Velocity Contour Plot
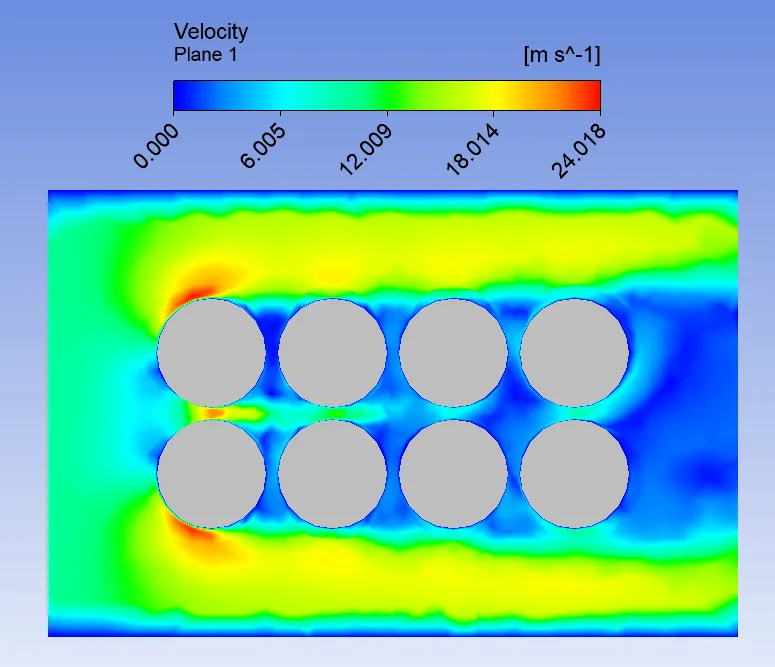
- Vector Plot
==========================================================================
Case 4 :
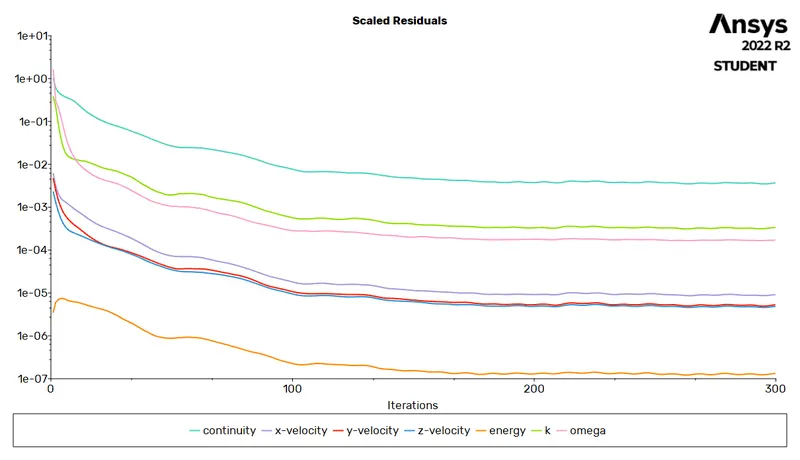
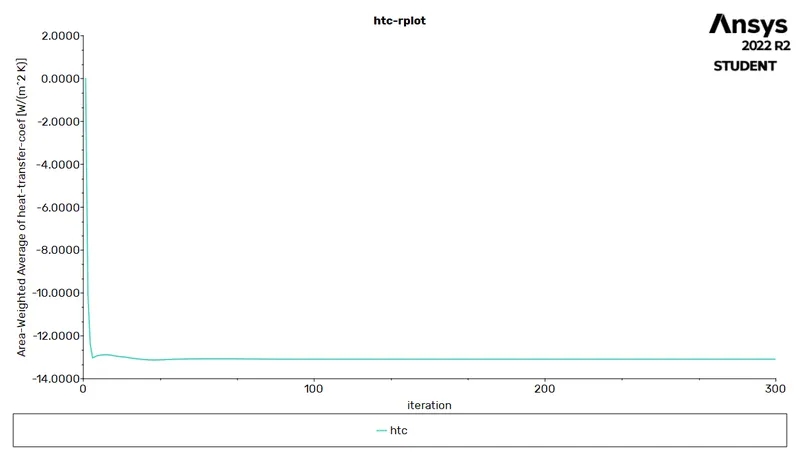
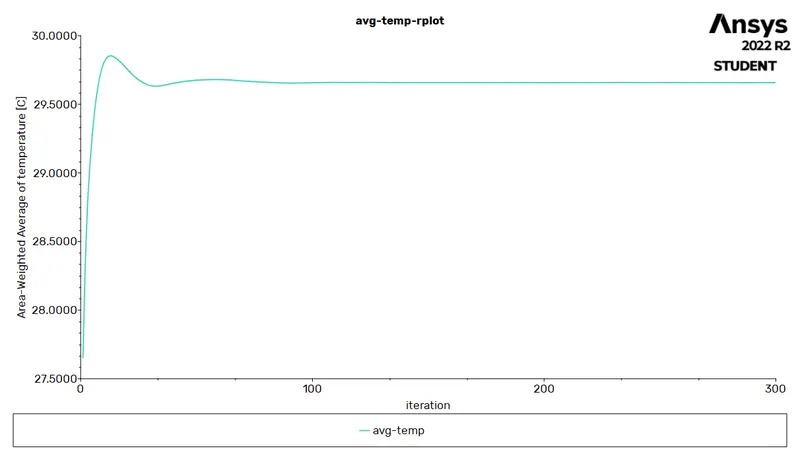
space between the cells 4 mm & 5 m/sec of inlet fluid velocity :
- Residual Plot
- Heat Transfer Coefficient Plot
- Average Temperature Plot
- Maximum Temperature Plot
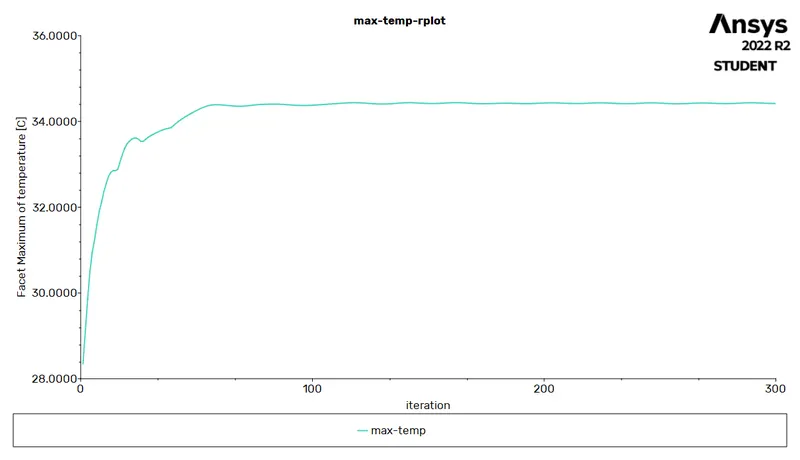
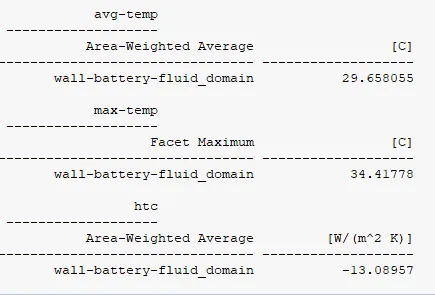
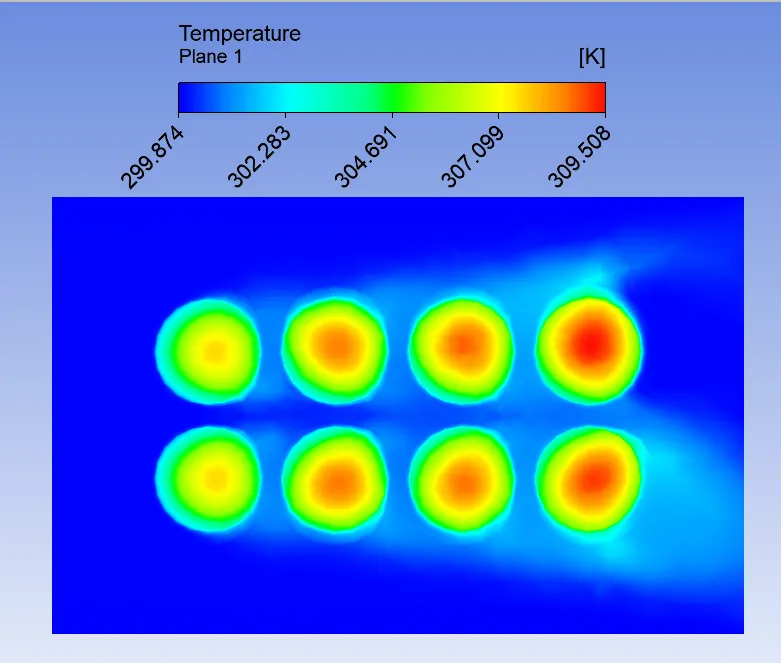
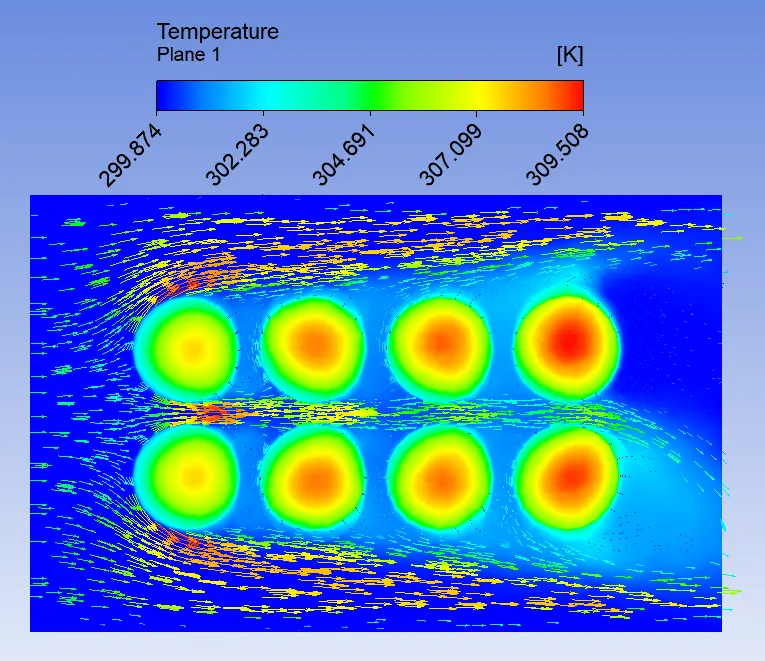
- Temperature Contour
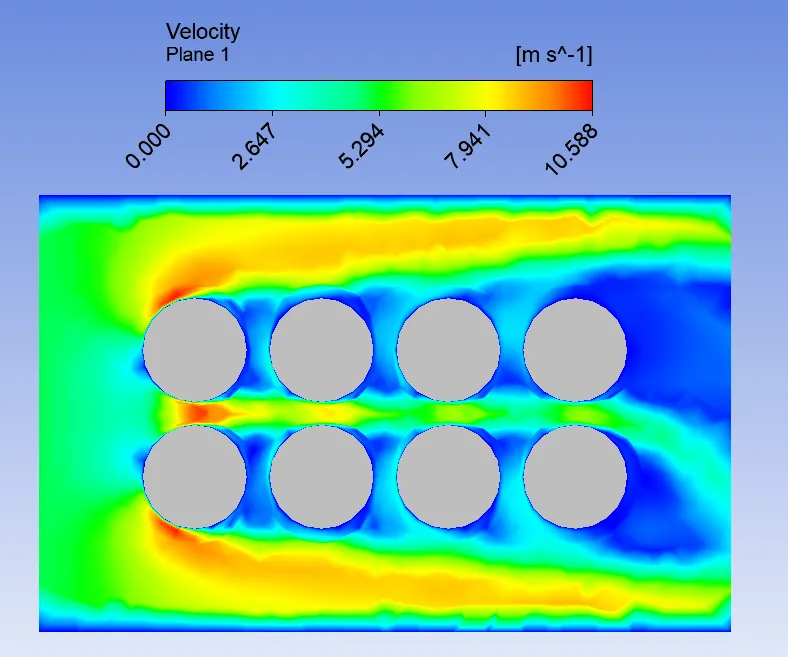
- Velocity Contour
- Vector Plot
================================================================================
Case 5 :
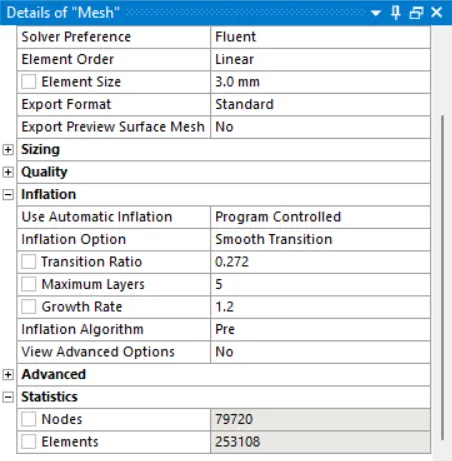
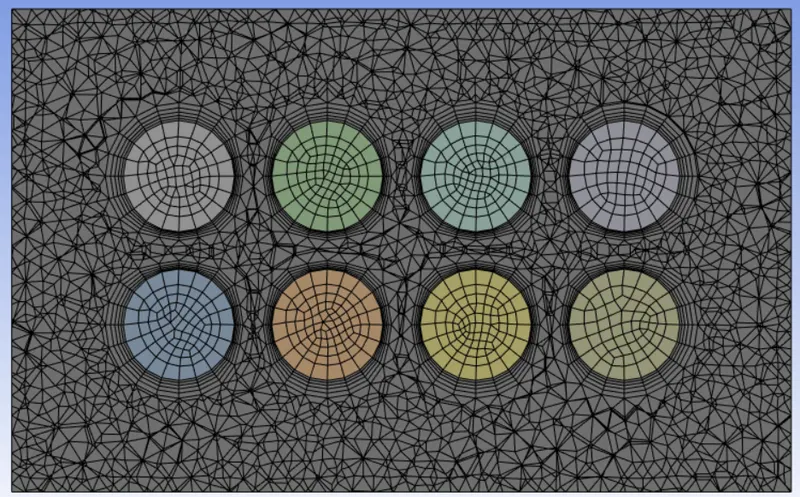
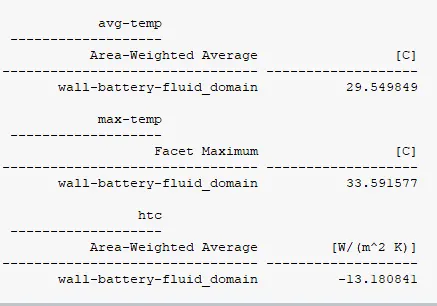
space between the cells 6 mm [fine mesh 3mm] & 5 m/sec of inlet fluid velocity :
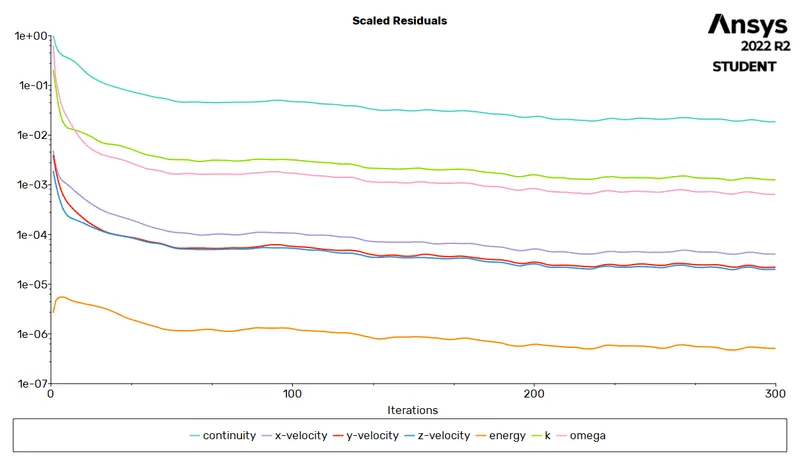
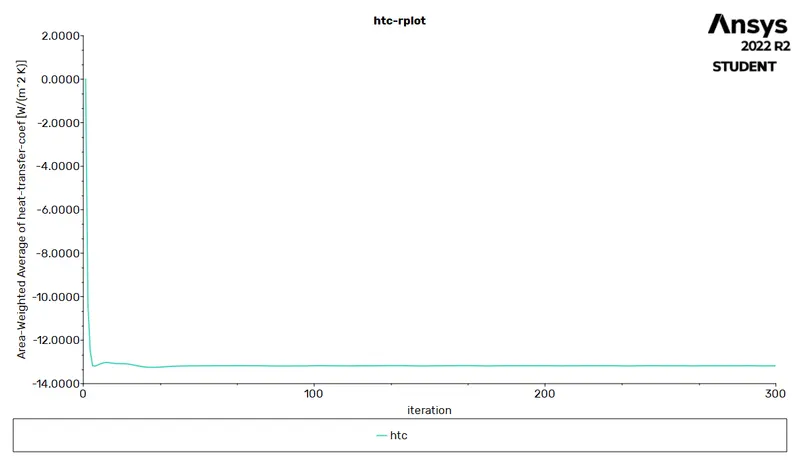
- Residual Plot
- Heat Transfer Coefficient Plot
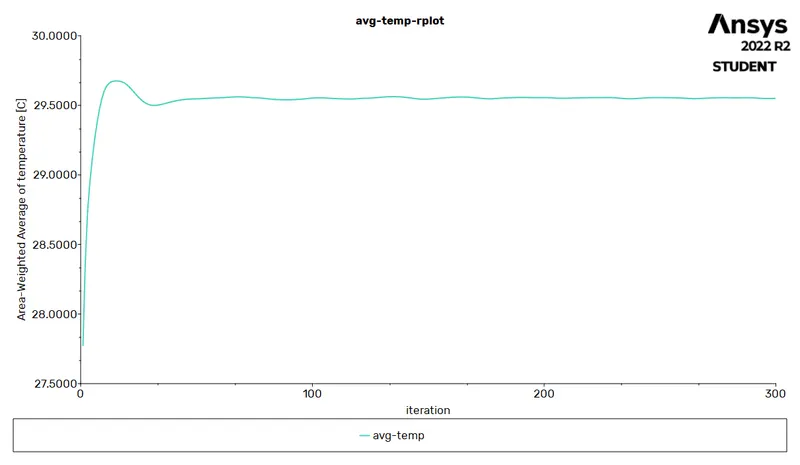
- Average Temperature Plot
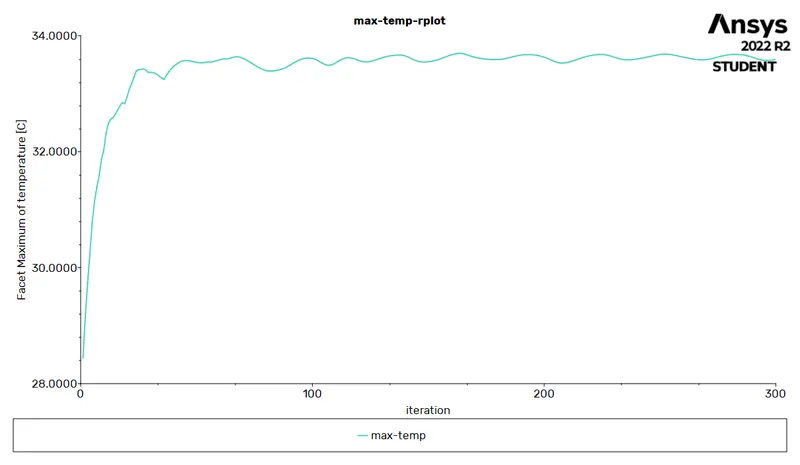
- Maximum Temperature Plot
- Temperature contour
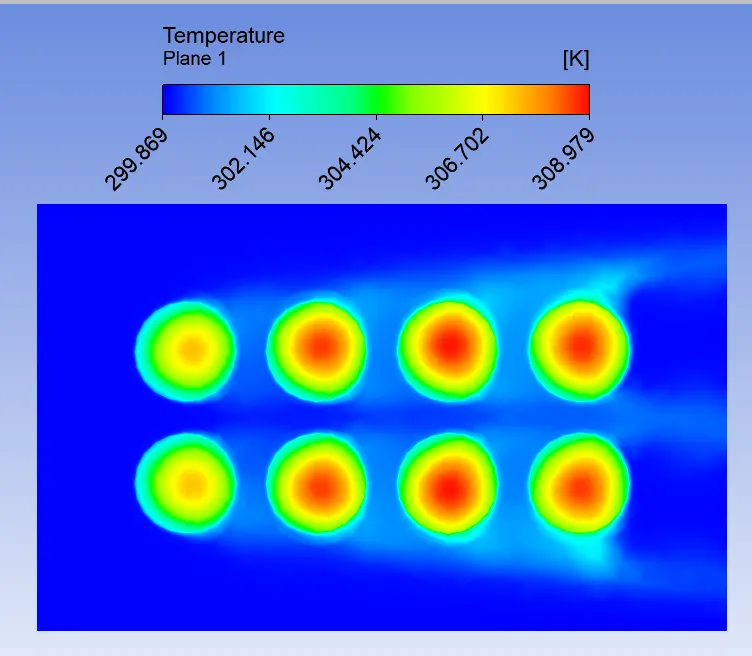
- Velocity contour
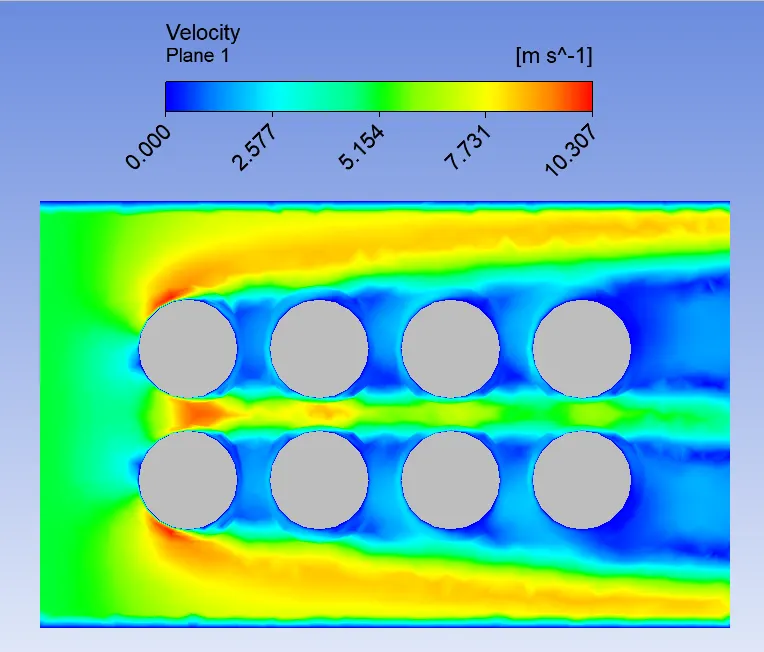
Vector plot
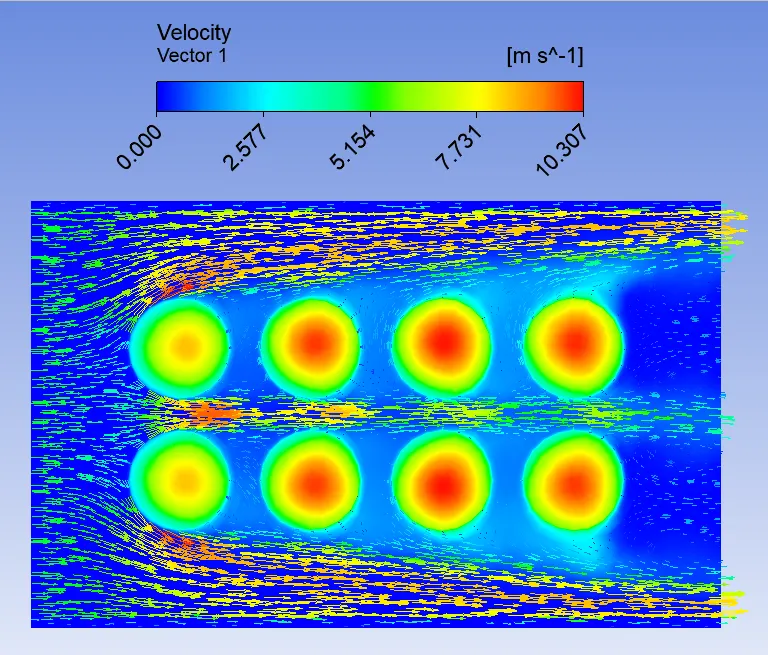
============================================================================
Case 6 :
space between the cells 6 mm [Default mesh] & 5 m/sec of inlet fluid velocity :
- Residual plot
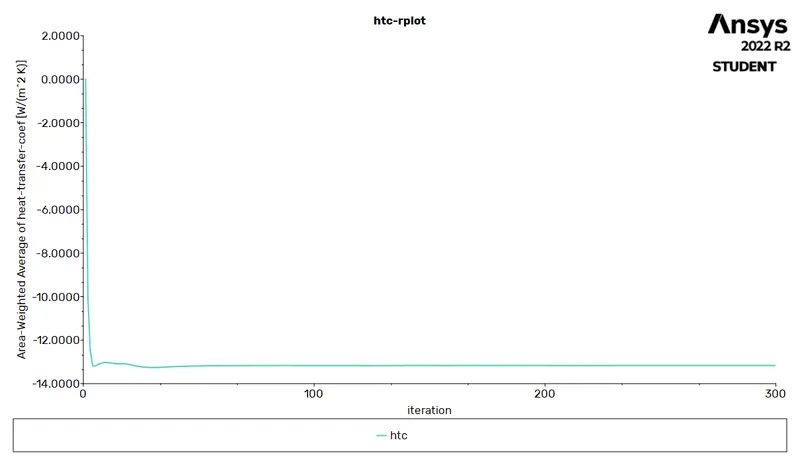
- Heat transfer coefficient plot
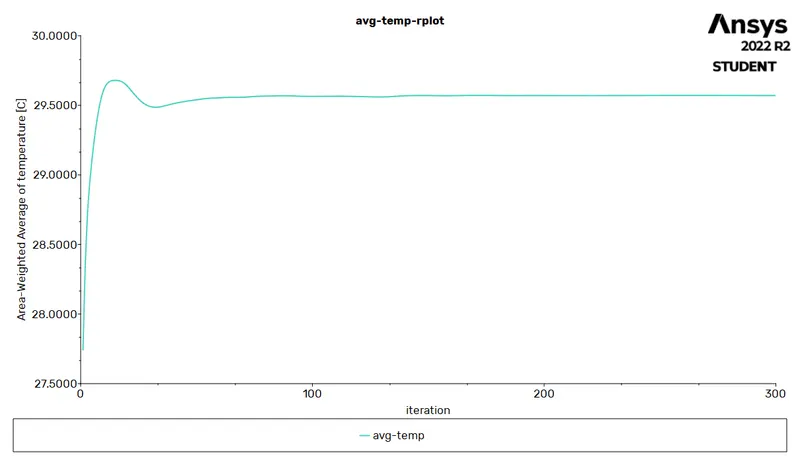
- Average temperature plot
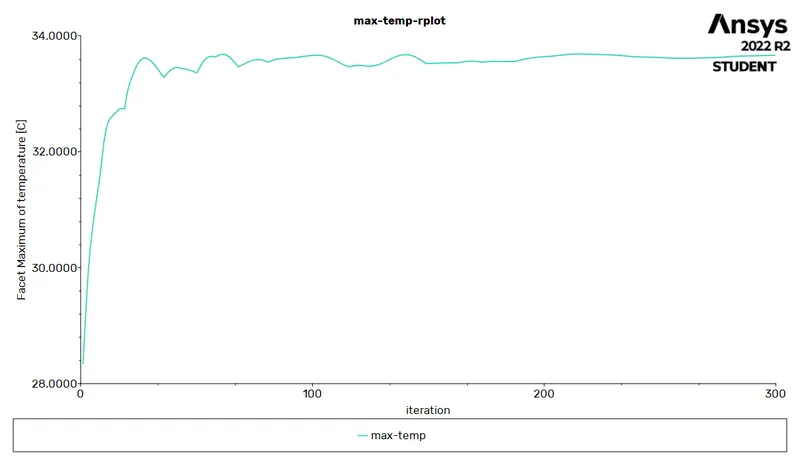
- Maximum temperature plot
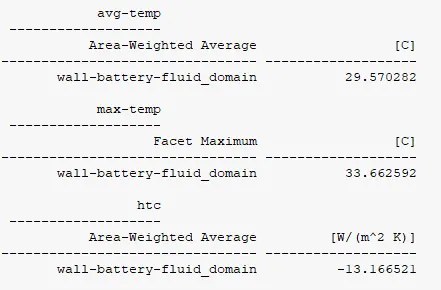
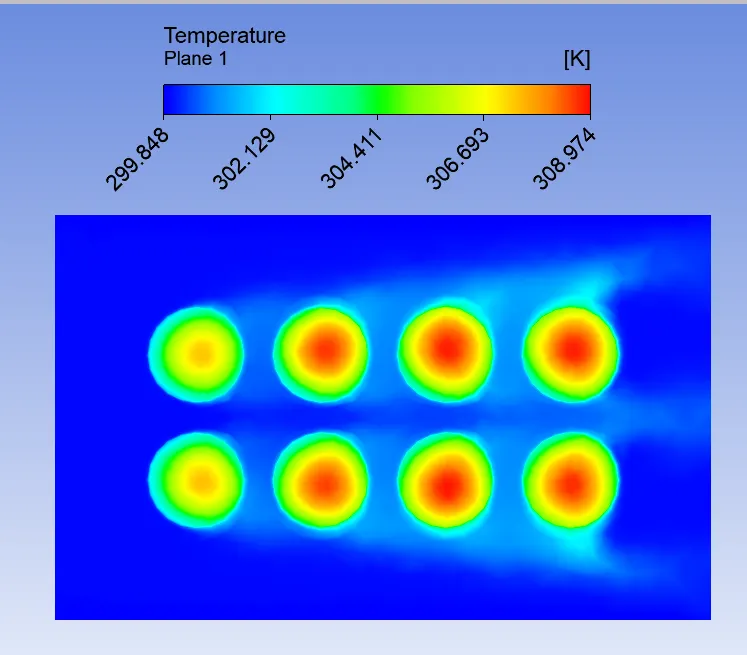
- Temperature contour
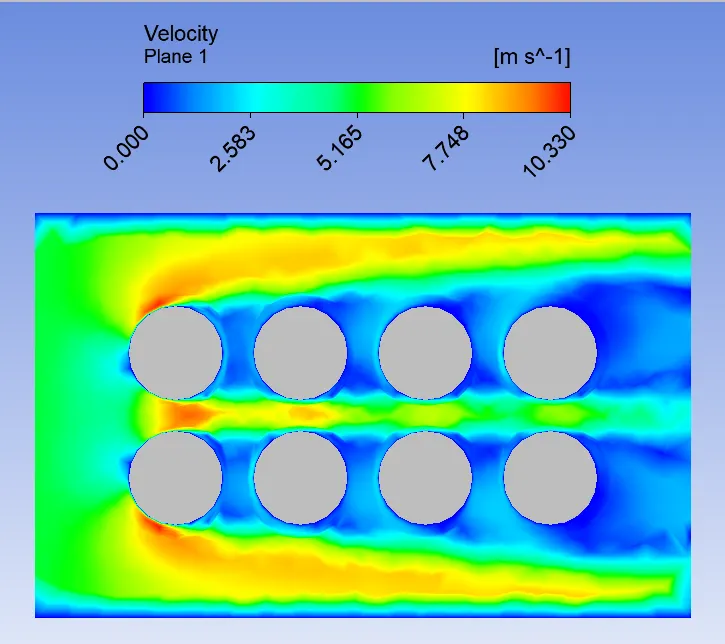
- Velocity contour
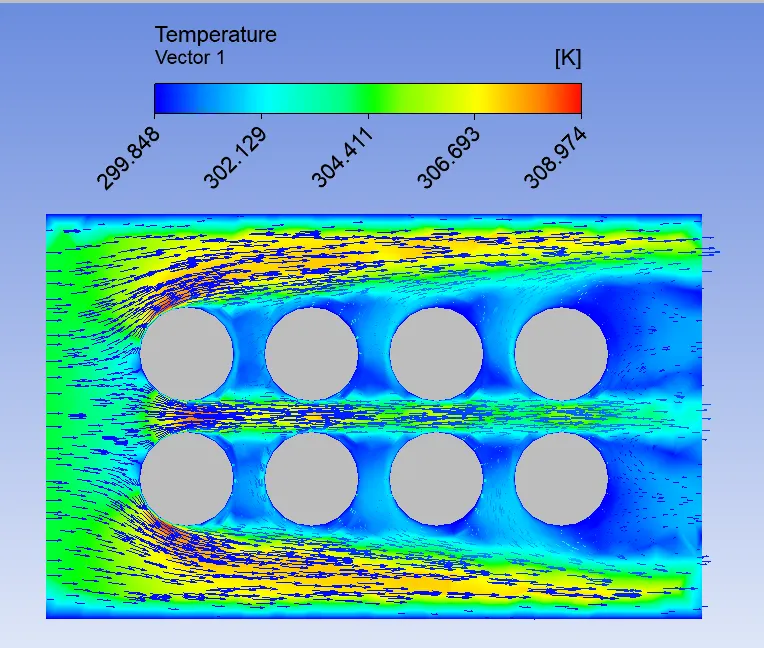
- Vector Plot
====================================================================================
- Results
| Space between two cells | Velocity Inlet | Heat Transfer Coeficient [W/m^2.K] | Average Temperature [°C] | Maximum Temperature[°C] |
| 2 mm | 3 m/sec | -11.5341 | 31.9601 | 39.4921 |
| 2 mm | 5 m/sec | -12.7598 | 30.1194 | 34.8598 |
| 2 mm | 10 m/sec | -13.9658 | 28.6852 | 31.2931 |
| 4 mm | 5 m/sec | -13.0895 | 29.6580 | 34.4177 |
| 6 mm [fine mesh 3mm] | 5 m/sec | -13.1808 | 29.5498 | 33.5915 |
| 6 mm | 5 m/sec | -13.1665 | 29.5702 | 33.6625 |
- Conclusion:
- The batteries situated near the inlet are maintained at a much lower temperature than the ones near the outlet.
- For the same gap between batteries, we can observe that with higher velocity, the average temperature decreases.
- The average temperature values are less when the gap is 6mm compared to 2mm.