Week 10 - Simulating Combustion of Natural Gas.
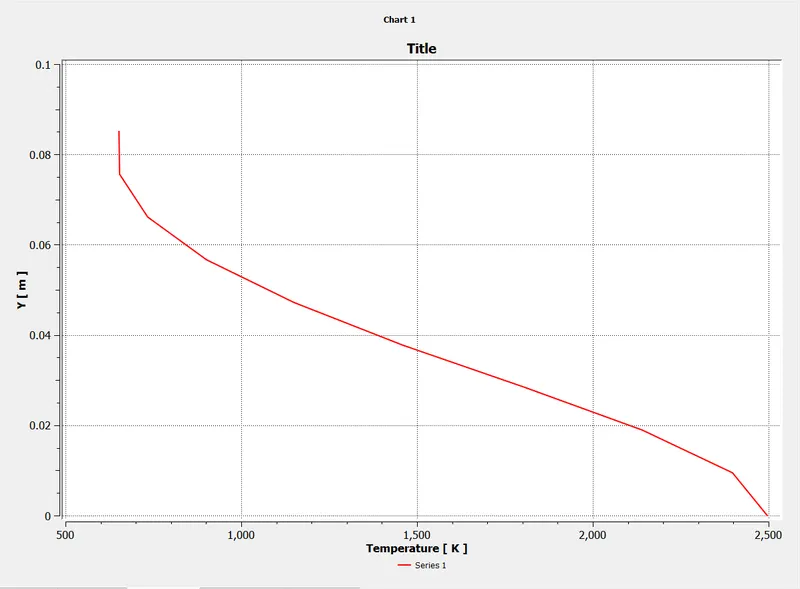
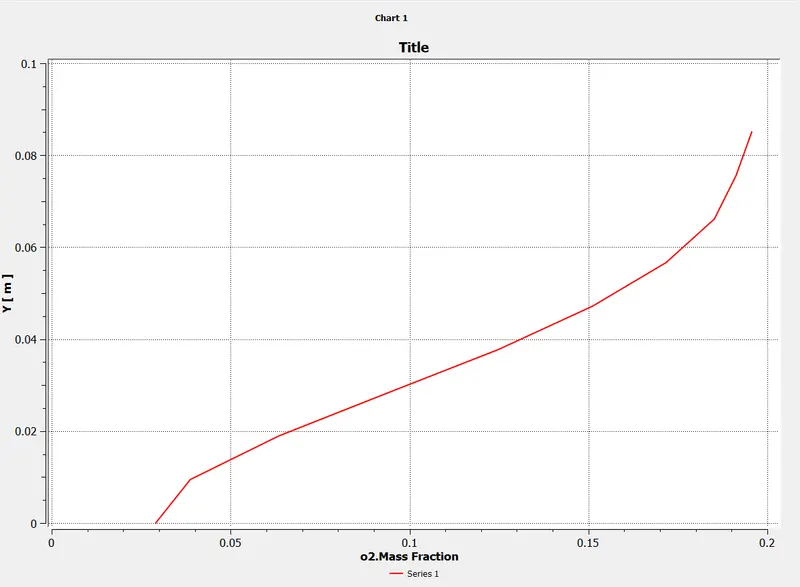
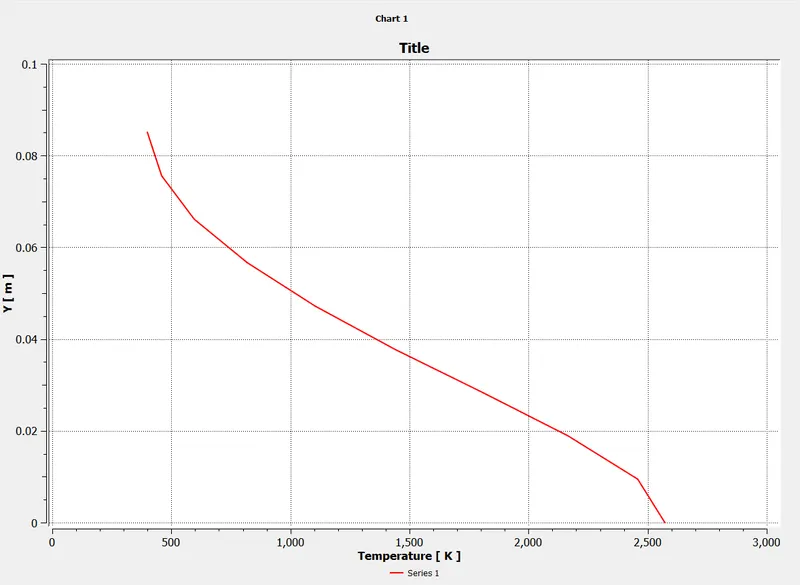
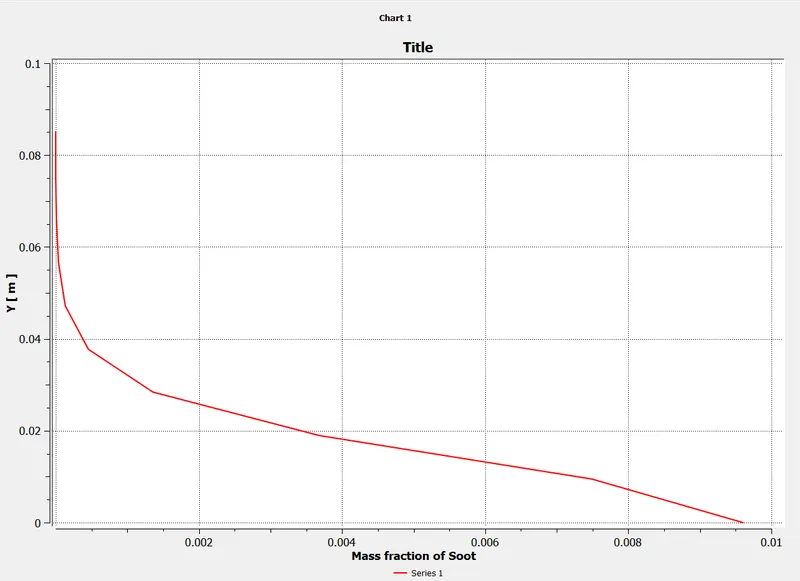
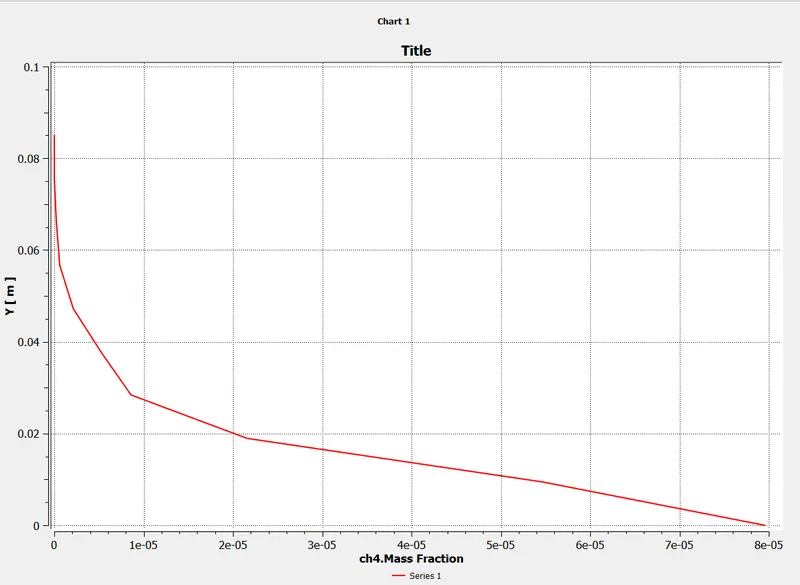
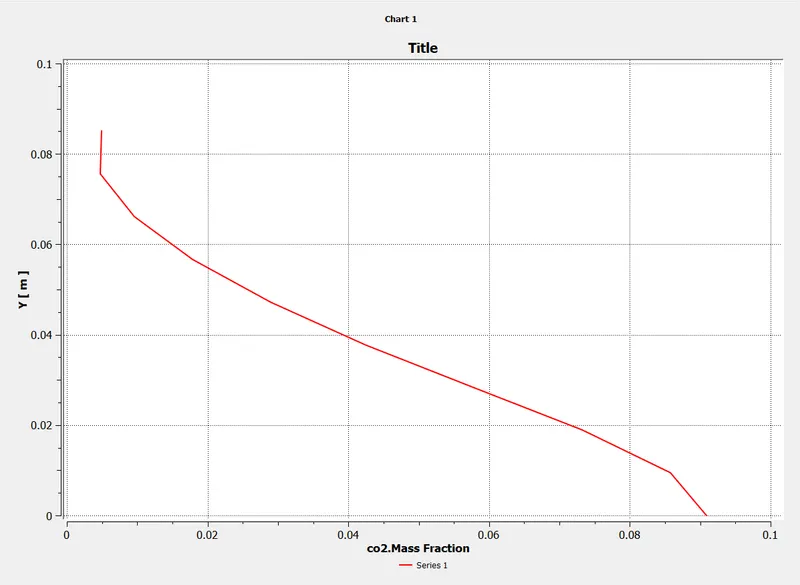
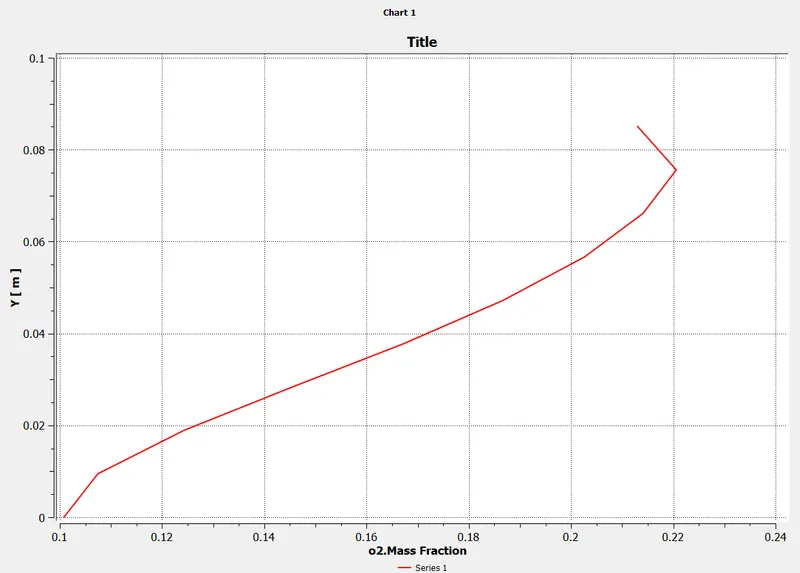
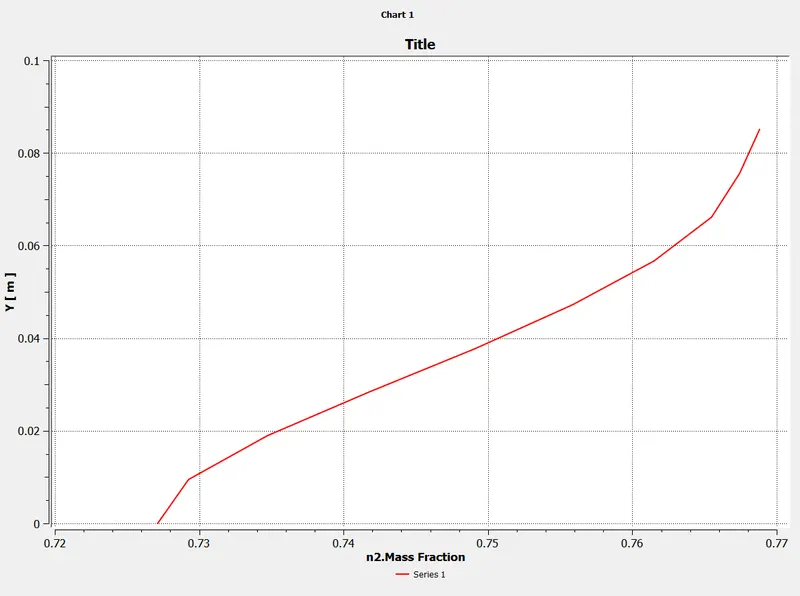
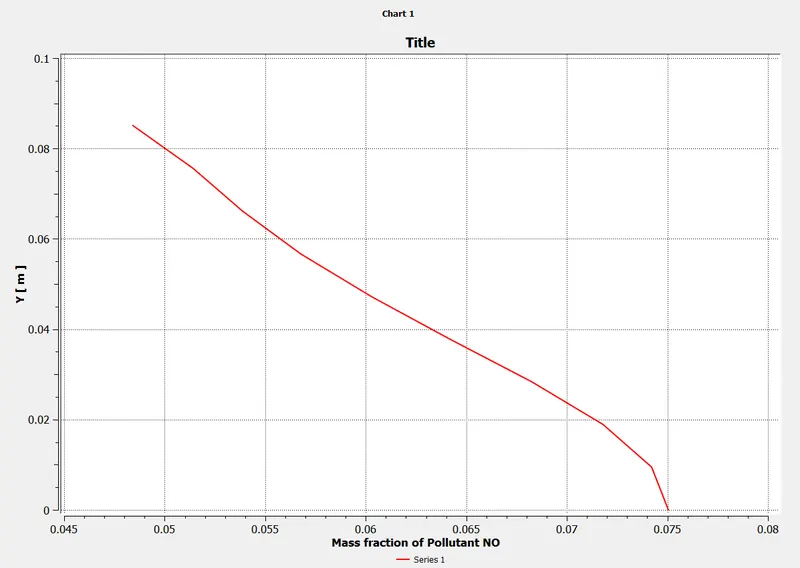
- Aim - Perform a combustion simulation on the combustor model and plot the variation of the mass fraction of the different species’ in the simulation using line probes at different locations of the combustor as shown in Fig. You need to plot for CO2, H2O, CH4, N2, O2, NOx emissions & Soot formation.
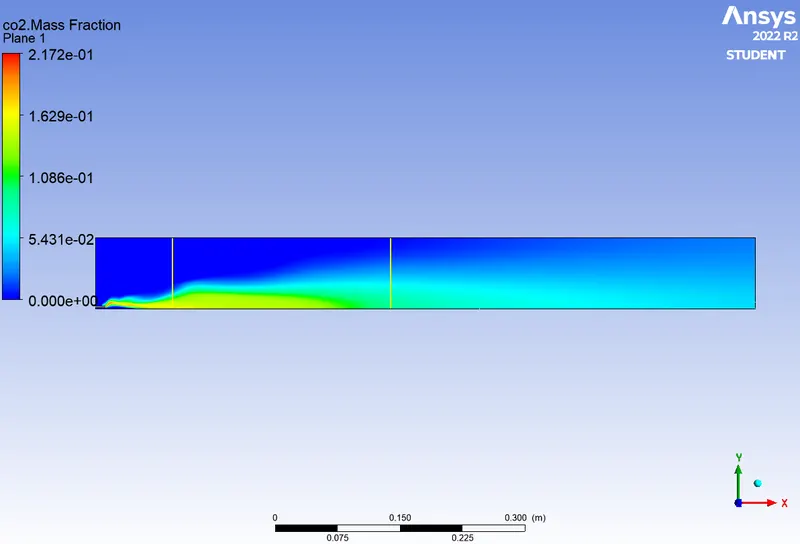
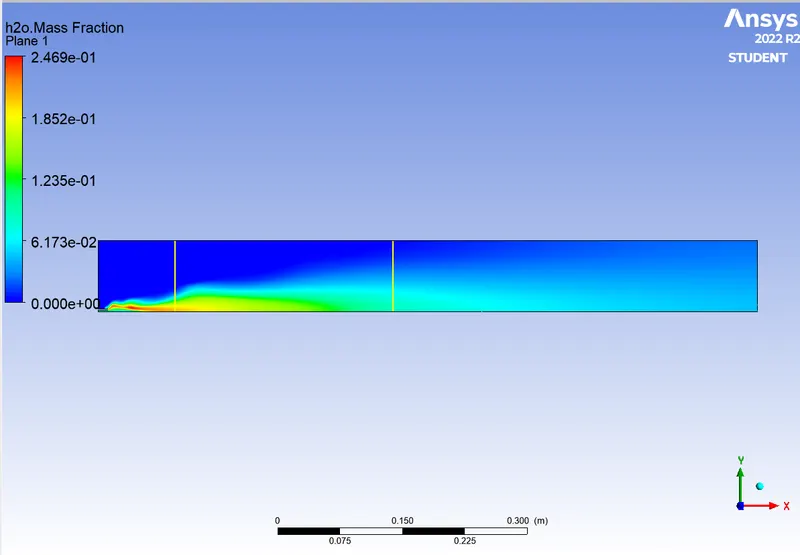
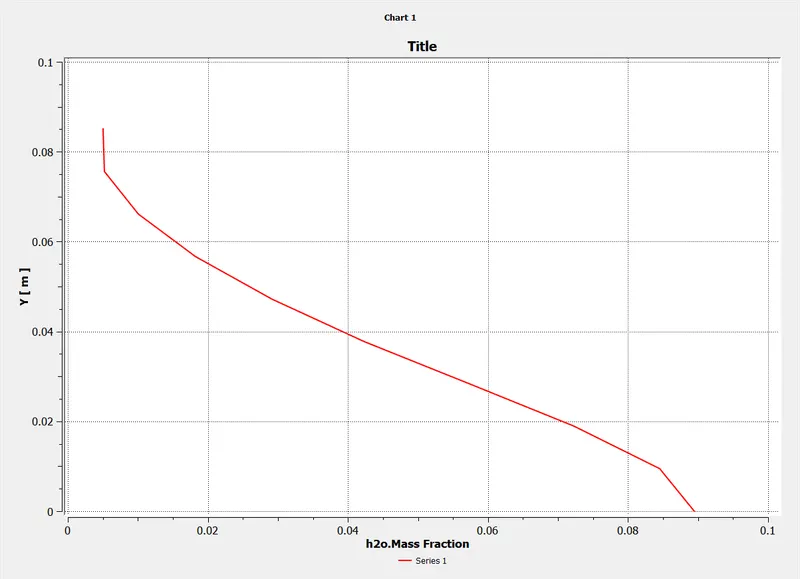
- To add the water content in the fuel from 5% to 30% by mole and observe the effect of it on the results. It is necessary to provide line plots and contours to prove your claim.
- Objective -
- To Perform a combustion simulation on the combustor model and plot the variation of the mass fraction of the different species in the simulation using line probes at different locations of the combustor.
- To observe the effect of adding water content in the fuel by 5 % to 30 % by mole.
- Combustion:
Combustion or combustion is a fundamental chemical process that releases energy from a mixture of air and fuel. - Combustion, a chemical reaction between substances, usually containing oxygen, that involves the production of heat and light, usually in the form of a flame.
- When fuel burns in a combustion reaction, useful thermal energy (heat) is released. Combustion reactions are used to heat our homes, power most cars, and generate much of our electricity.
- As a product, it produces gas in the form of smoke. Complete combustion is the stoichiometric combustion of fuel, with no fuel left and ideally no oxidizer left. Thermodynamically, the chemical equilibrium for combustion in air is primarily on the product side. However, chemical equilibrium is not always achieved and may contain uncombusted products such as carbon monoxide, hydrogen, and even carbon (soot and ash), thus achieving complete combustion. is almost impossible to do. High temperature combustion in an atmosphere of 78% nitrogen also produces small amounts of nitrogen oxides, commonly referred to as NOx. The smoke produced is therefore usually toxic and contains unburned or partially oxidized products.
- Soot Particles
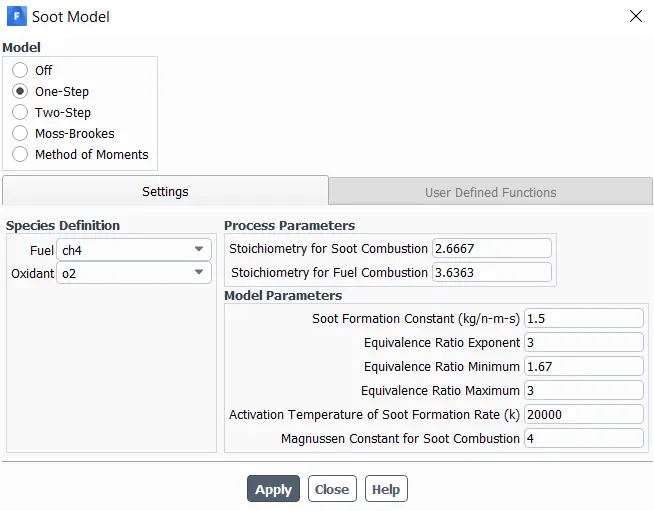
- Soot particles are generally produced by incomplete combustion or thermal cracking of hydrocarbon fuel-rich mixtures with steep temperature gradients in the combustion chamber. Soot observed from house fires and chimneys contains few aggregates but large amounts of coke and charcoal particulate debris.
Soot particle formation is a complex phenomenon: nucleation, surface growth, coalescence and agglomeration
hydrocarbon + oxygen → carbon dioxide + water + heat energy
Combustion stimulus type:
1.Based on mixture:
- Non-premixed combustion (direct injection, delayed injection)
- Premixed combustion (carburetor)
- Partially premixed.
2.Phase - Fluid phase (volume reaction)
- Walls (surface reaction)
- Particles (surface reaction)
- Based on porous region.
Non-Premixed Combustion:
In non-premixed combustion, the fuel and oxidant enter the reaction zone in separate streams. This is in contrast to premixed systems where the reactants are mixed at the molecular level prior to combustion. Examples of non-premixed combustion include pulverized coal furnaces, diesel internal combustion engines and pool fires. -
Combustion Reaction-
-
The general reaction of combustion is given as follows-

Where, 1= a,
4 = 2b therefore b=2,
2 ar = 2a+b therefore ar = 2,
ar*7.52=2C therefore C =7.52.
Air has 2 moles of oxygen + 7.52 moles of nitrogen
Mole fraction = Moles of the substance/Total moles of the mixture.
- Mole fraction of Oxygen = 2/9.52 = 0.21
- Mole fraction of Nitrogen = 7.52/9.52 = 0.79
- Mass fraction:
Mass fraction = Mass of the substance / Total mass of the mixture
Mass fraction of Oxygen = (16*0.21)/((16*0.21)+(14*0.79)) = 0.23
Mass fraction of Nitrogen = (14*0.79)/((16*0.21)+(14*0.79)) = 0.76
- Procedure
-
Topological Clean-up:
-
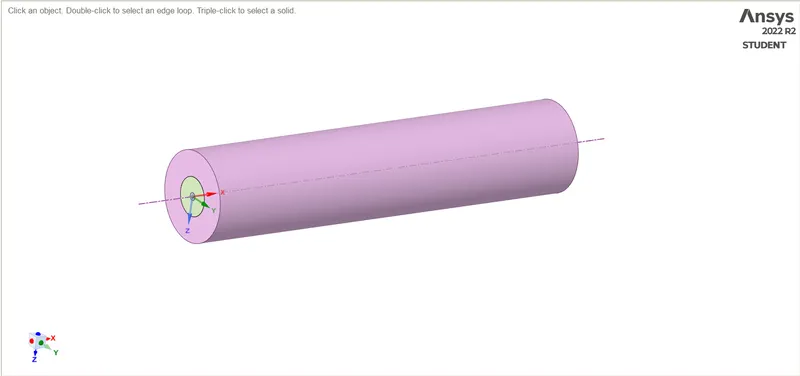
Importing CAD file into AnsysSpaceClaim: Open Ansys ⇒ Geometry ⇒ drag and drop the file.
- Meshing
- Stepwise Explaination
- Isometric view of the specified combustor model.
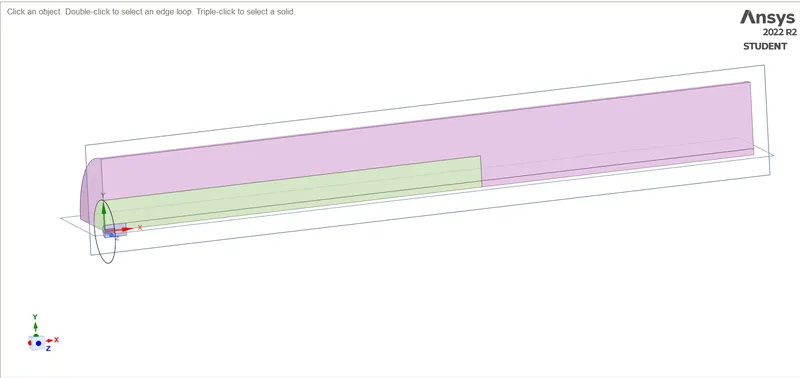
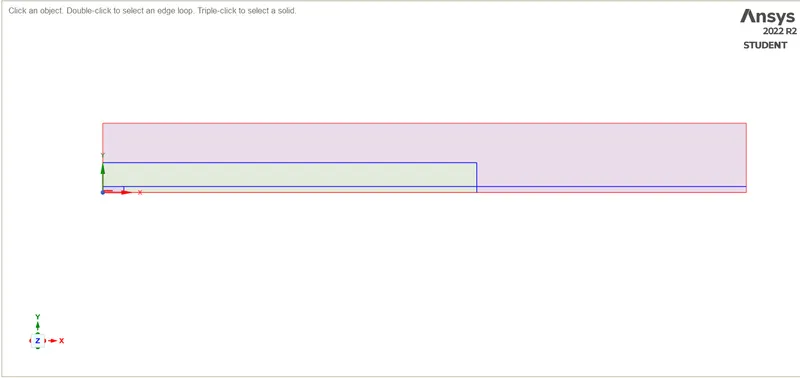
- Split the body into spaceclaim commands using slpit body. Convert a 3D model to a 2D model by copying surfaces and pasting them into a new design.
- Join all the surfaces using Spaceclaim's join command.
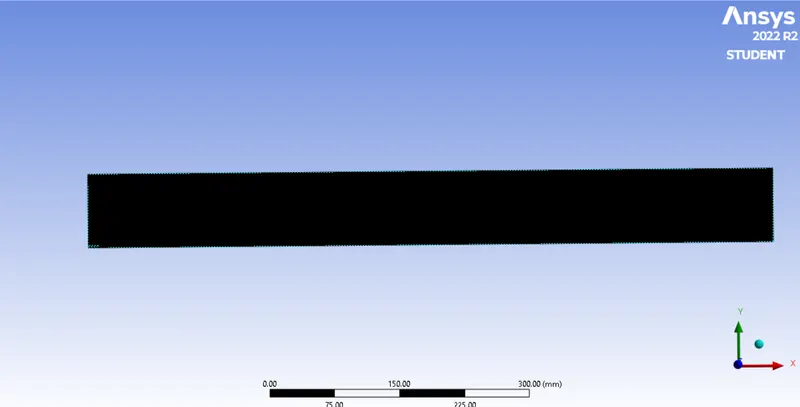
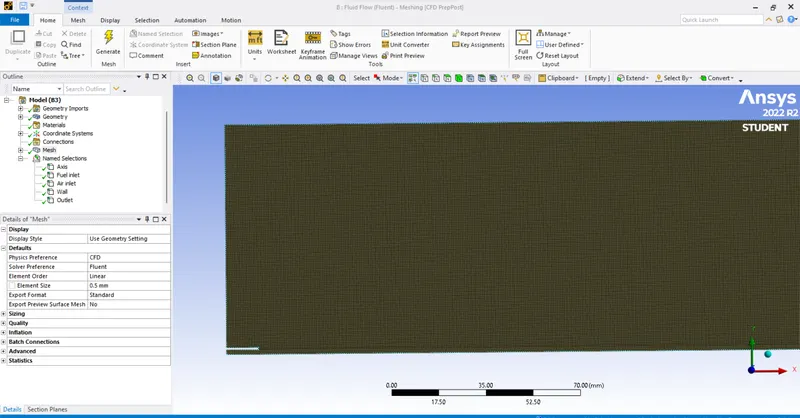
- The mesh is generated with an element size of 0.5 mm.
- The generated geometry and mesh and housing structure remain the same for part 1 and part 2, but the air and fuel inlet species mass fractions are different.
- Due to certain limitations in the academic version of ANSYS, the given combustor model is imported into spaceclaim and converted to 2D geometry.
- The k-ε model is chosen for turbulence modeling because the overall reaction rate is controlled by turbulent mixing.
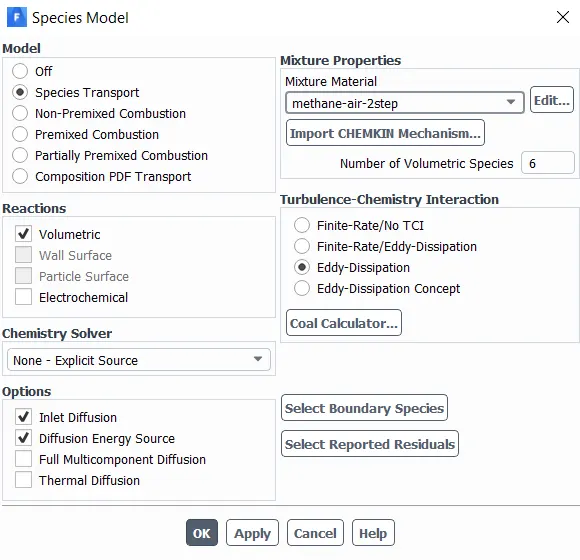
- Species transport equations are enebalized and are useful for predicting local mass fractions of species in simulations. Since the reaction takes place in the gas phase, the volumetric reaction is turned on.
- Enable Inlet Diffusion to calculate the diffusion coefficient at the inlet. An eddy dissipation model is chosen to calculate the net productivity of species in the simulation.
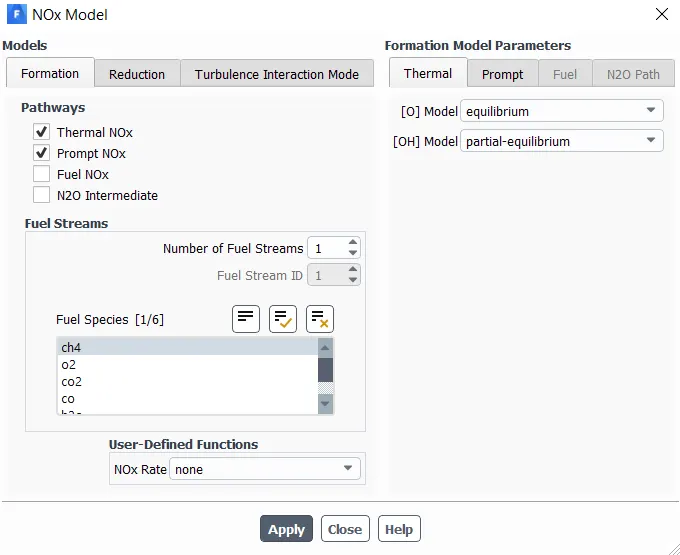
- The NOx model is on and helps predict the formation of pollutant No in the combustion process. NOx production occurs through the oxidation of atmospheric nitrogen present in the combustion air, enabling thermal NOx.
- Contours are plotted for CO2, H2O, CH4, N2, O2, NOx emissions & Soot formation.
- Setup
Solver type = Pressure based
Solver time = steady state
Viscous model = k-epsilon
Energy equations = enabled
Species model
Part 1
Boundary conditions
Air inlet
Velocity = 0.5 m/s
Temperature = 300 K
Species
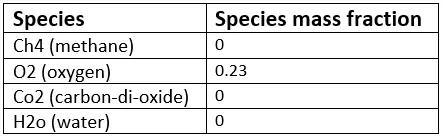
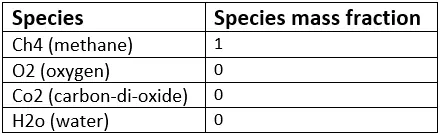
Fuel inlet
Velocity = 80 m/s
Temperature = 300 K
Species
Top surface
Boundary type = wall
Axis
x-axis = axisymmetric
-
Results of part 1
Residual plot
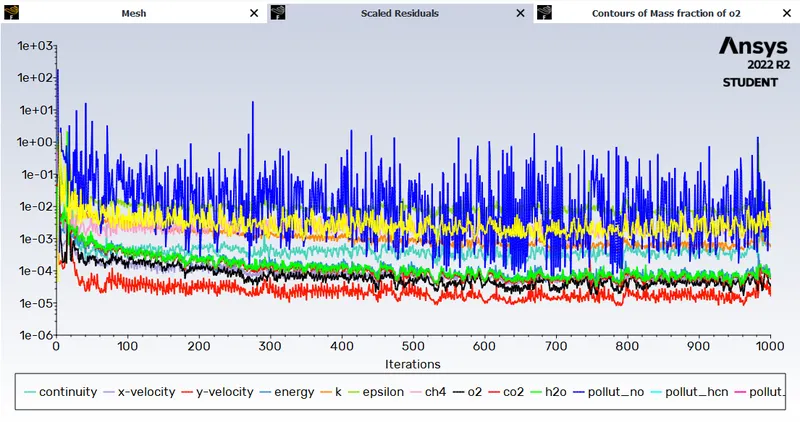
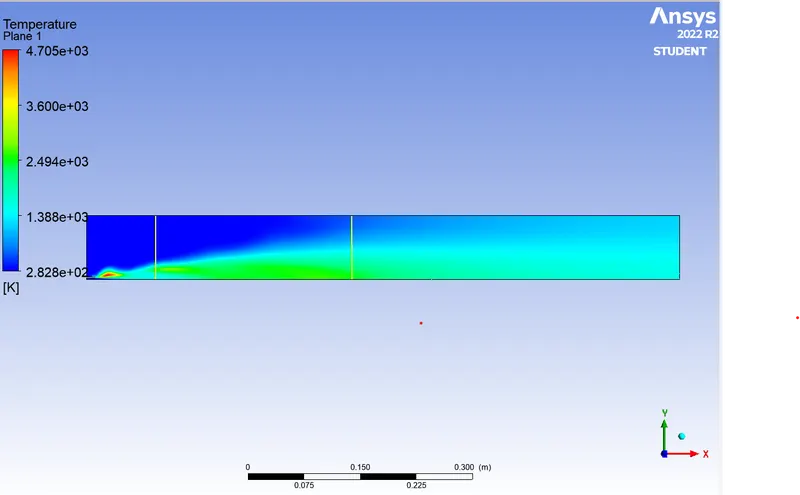
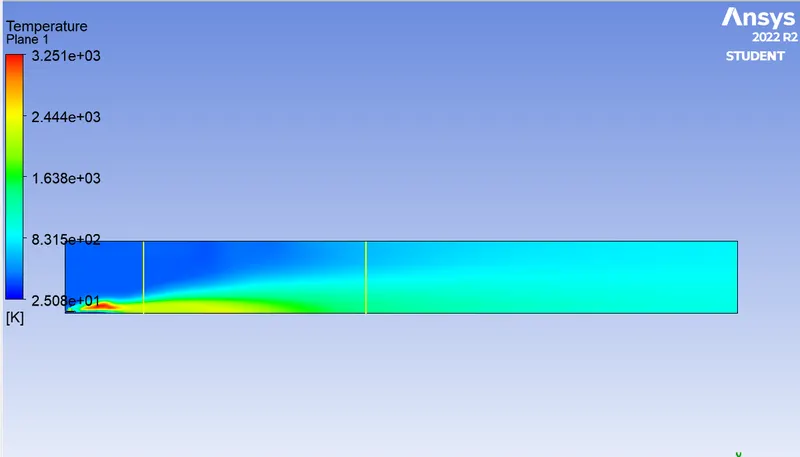
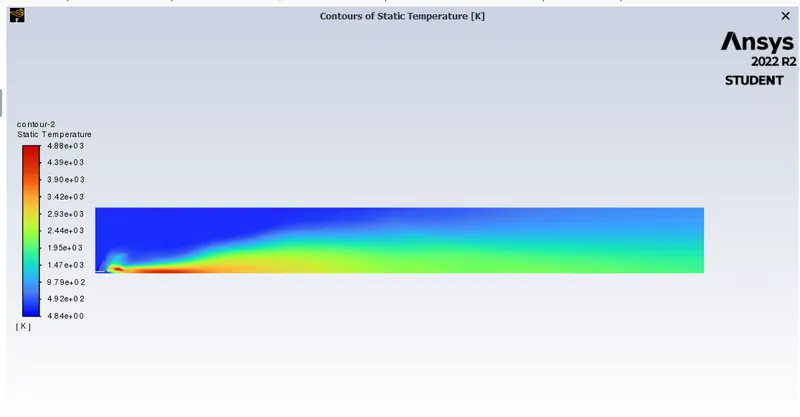
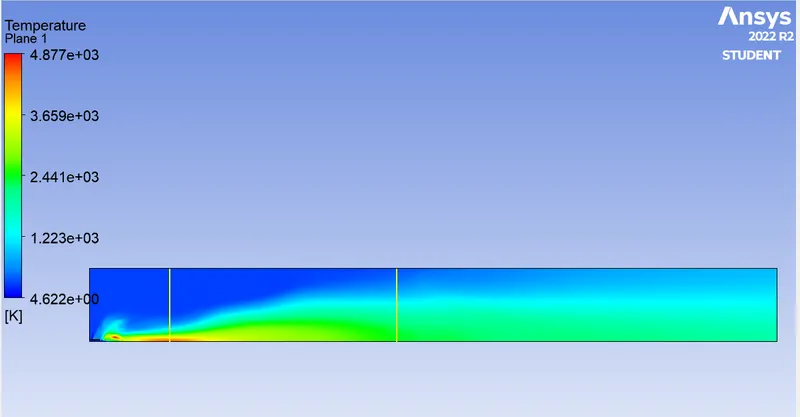
- Temperature contour
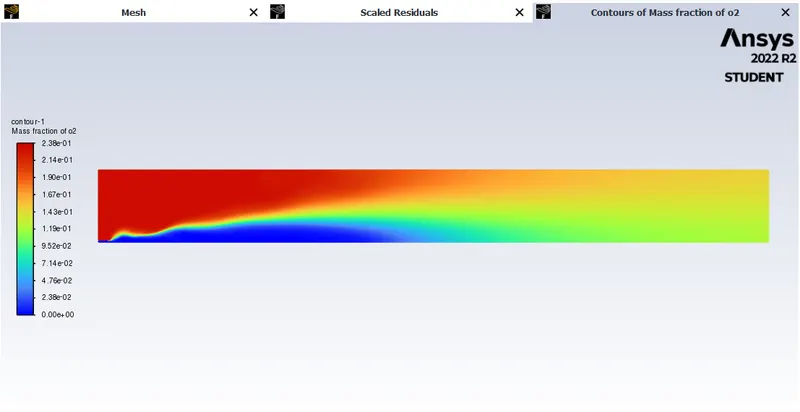
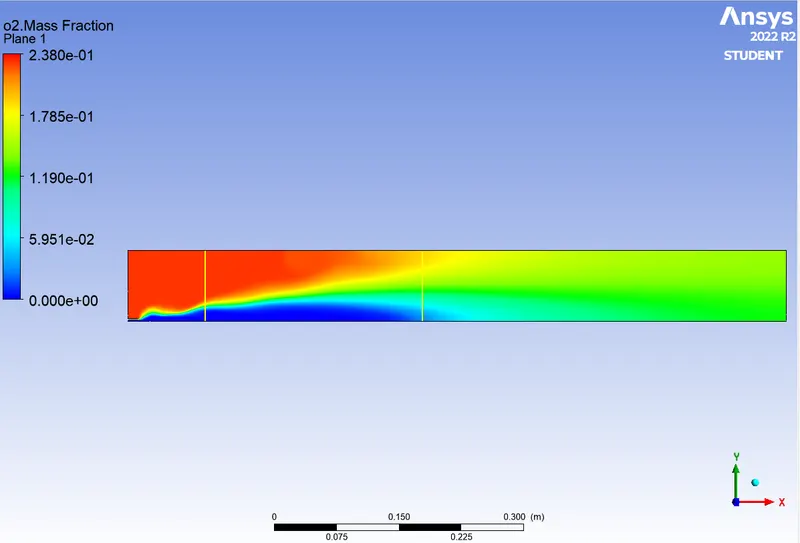
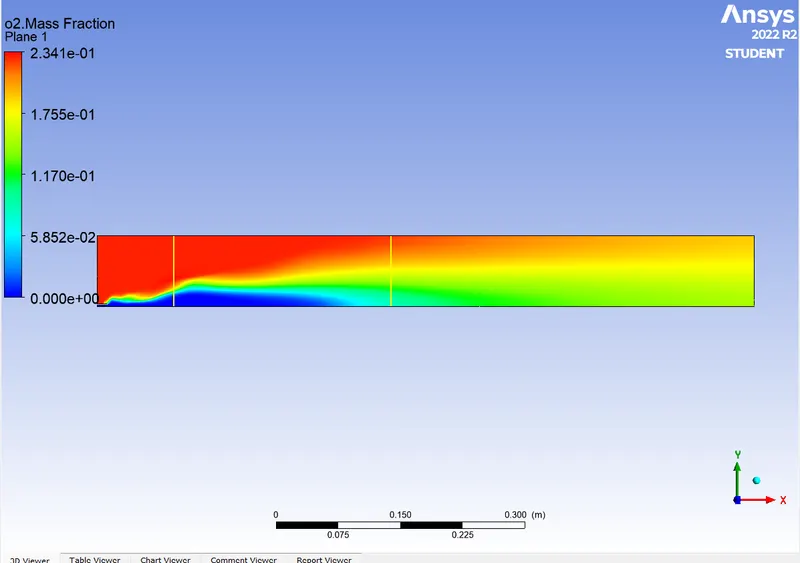
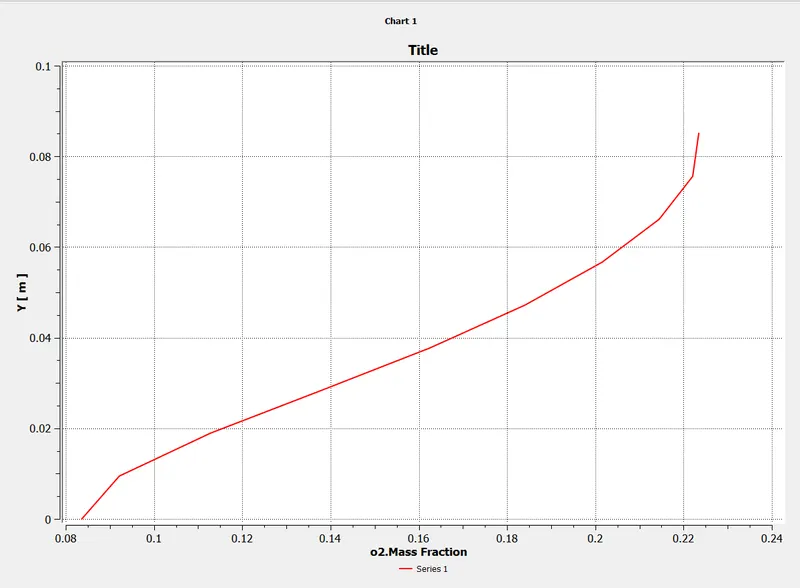
- Contour of mass fraction of O2
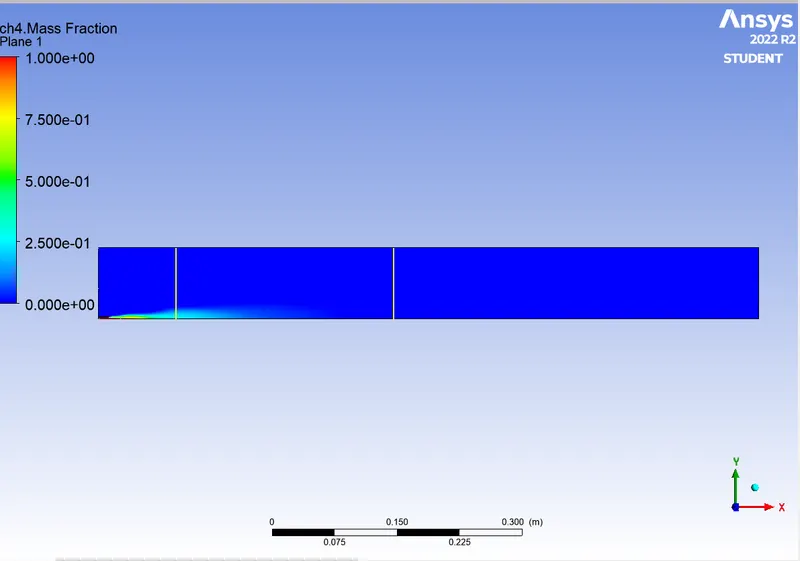
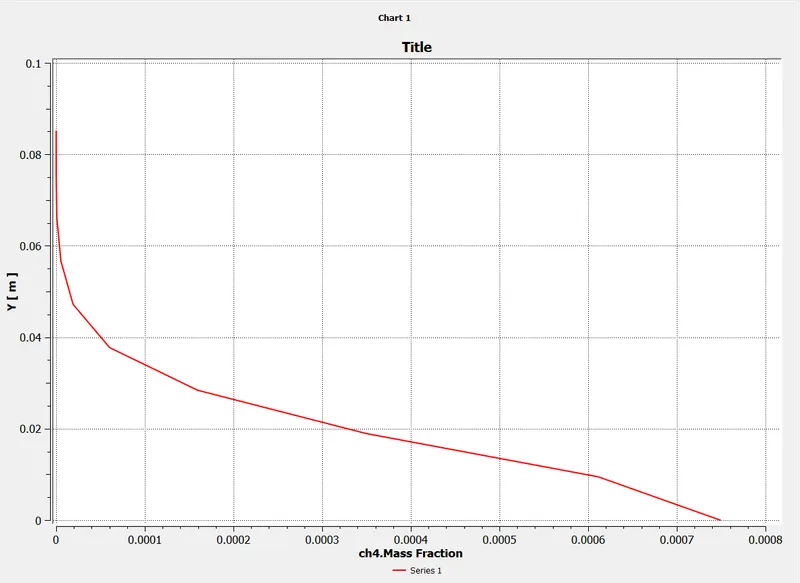
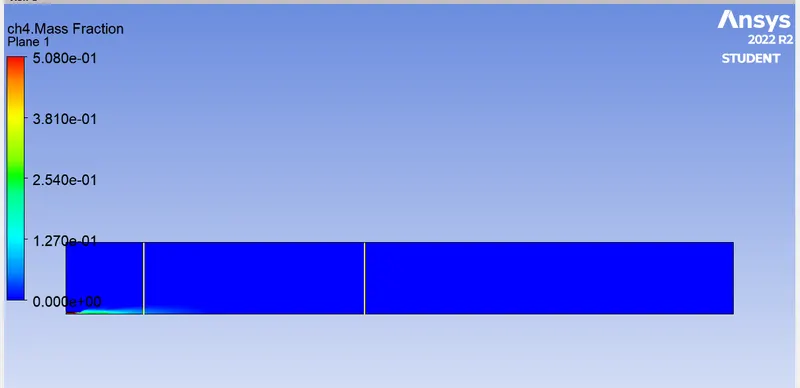
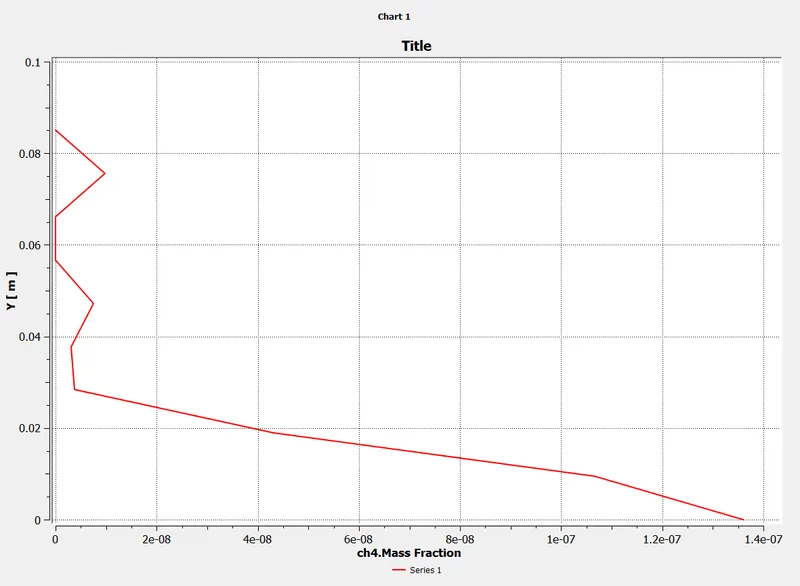
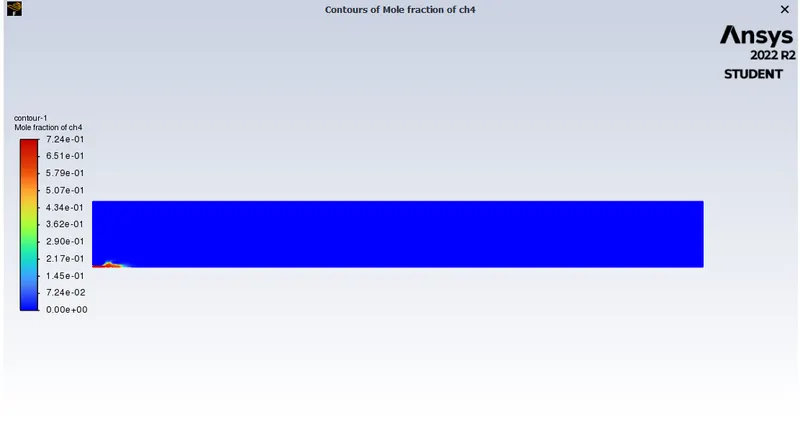
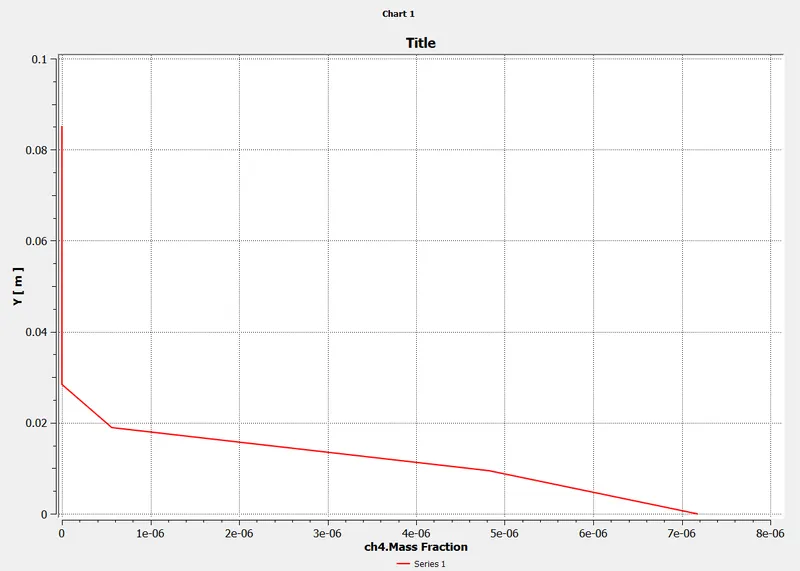
- Ch4 mass fraction
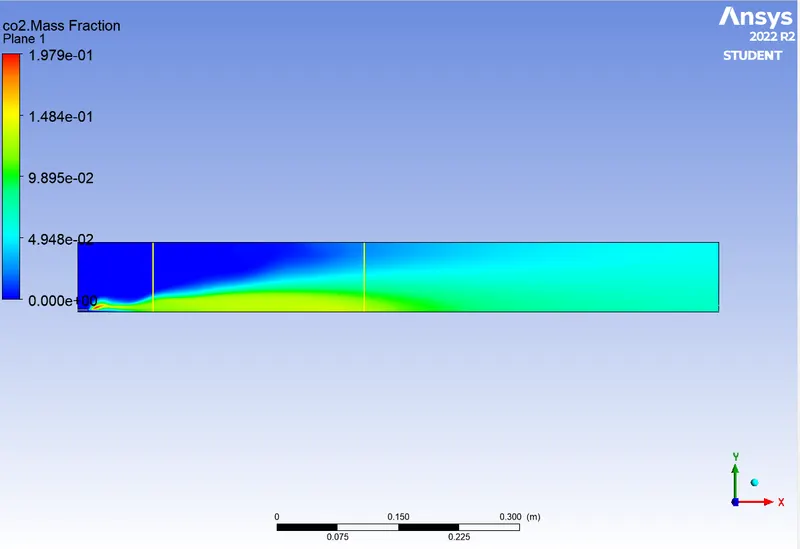
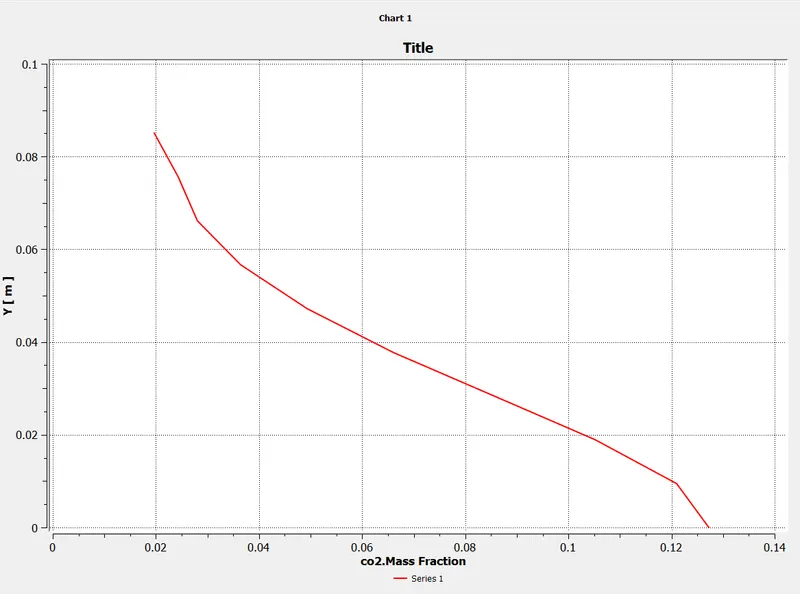
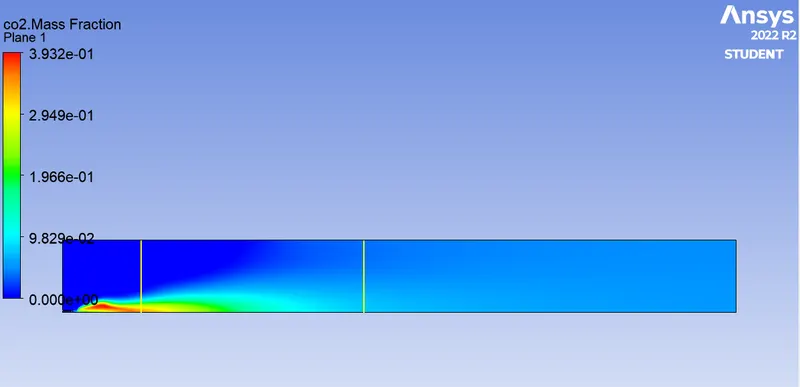
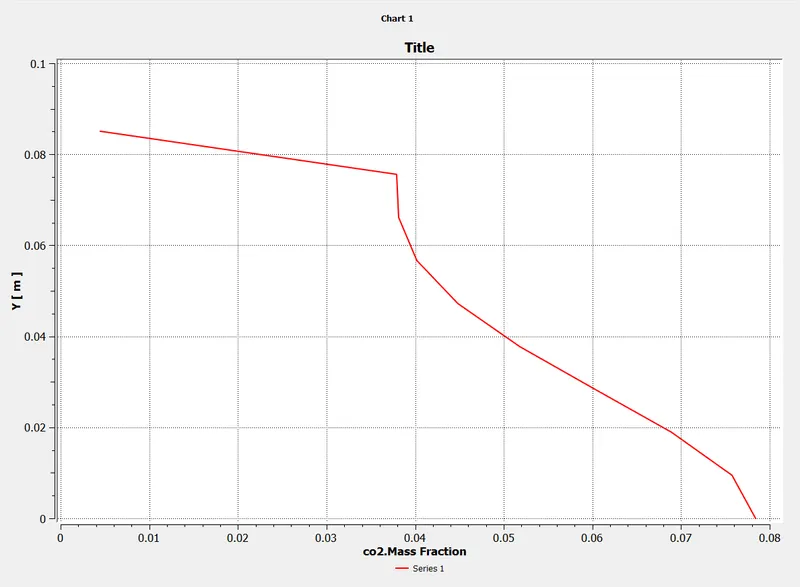
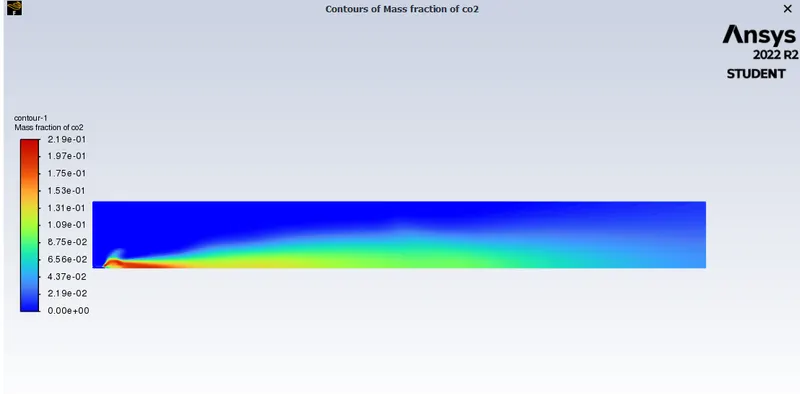
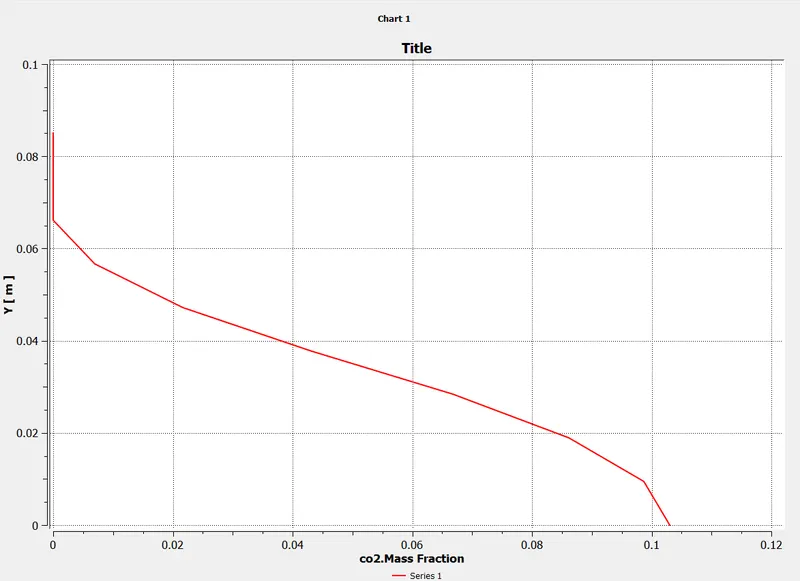
- Co2 mass fraction
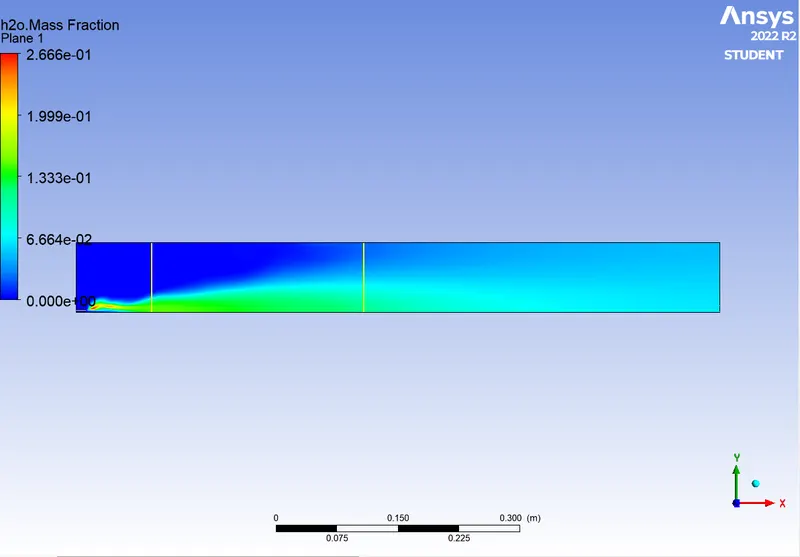
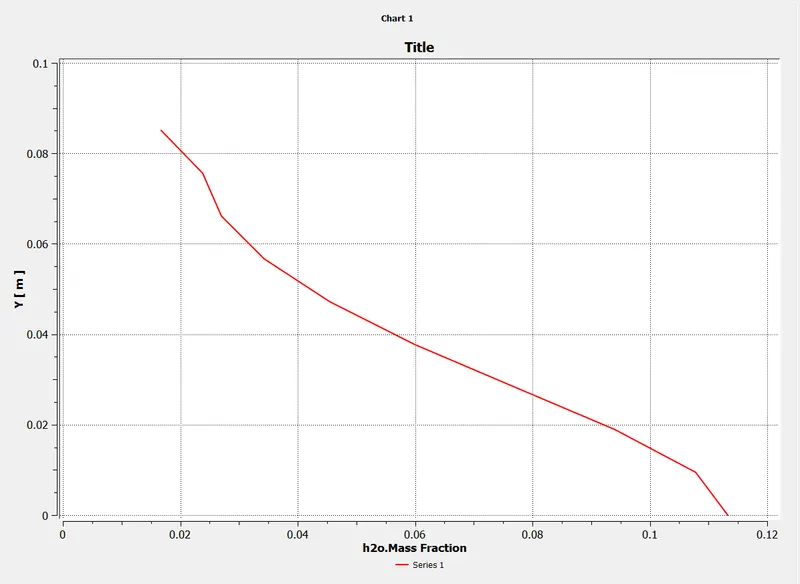
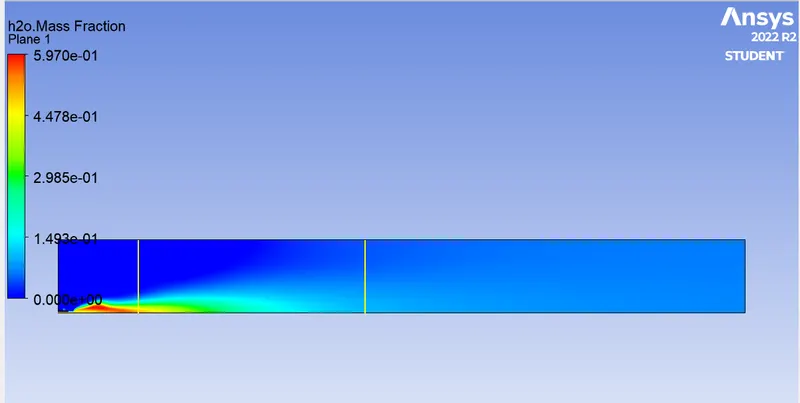
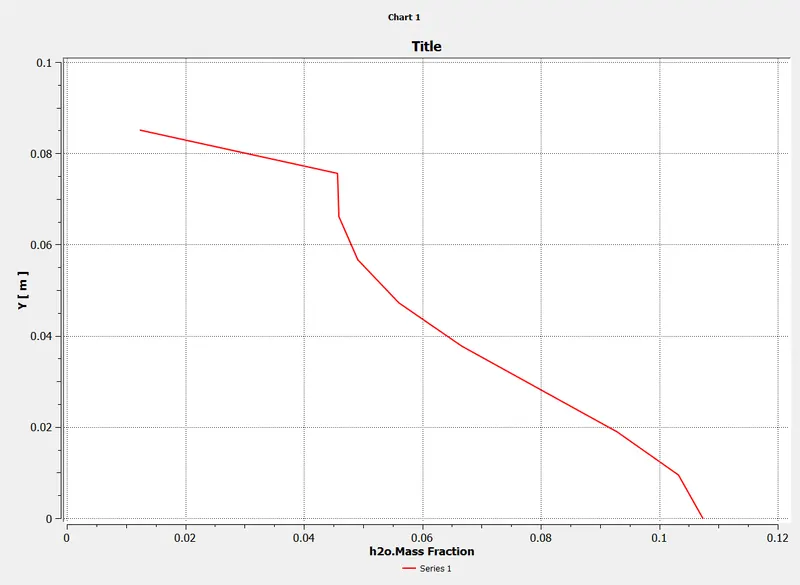
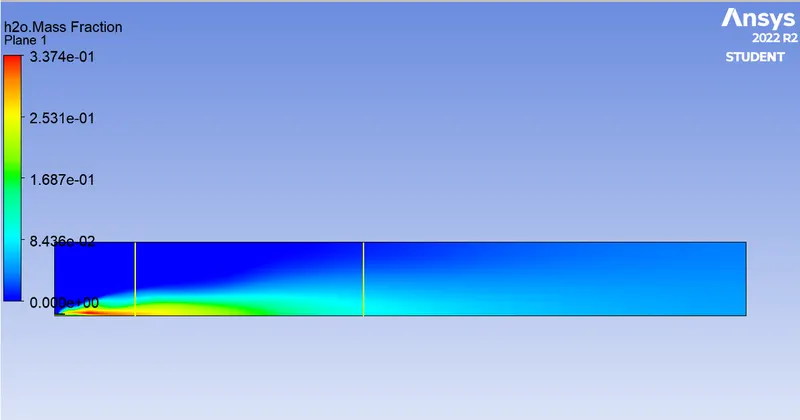
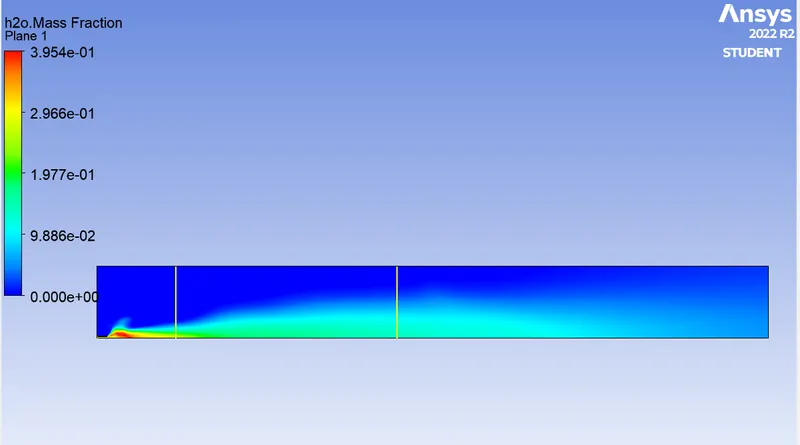
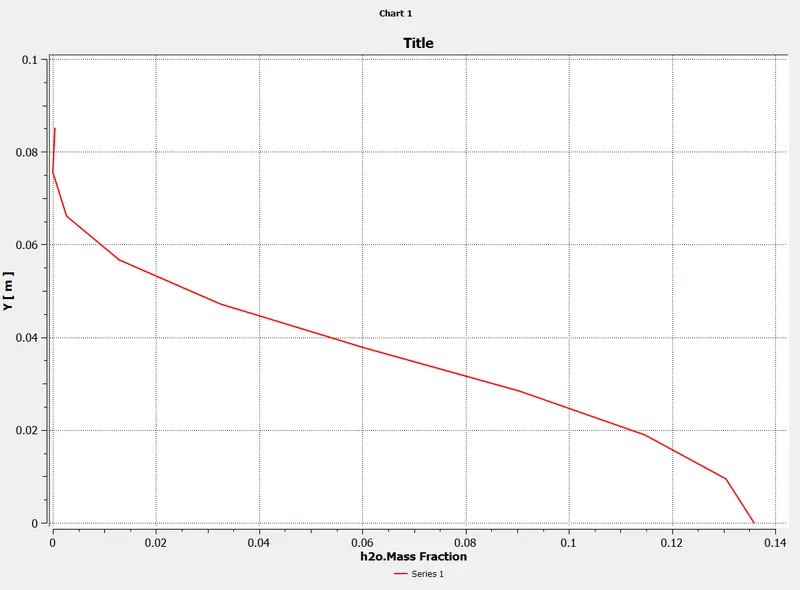
- H2o mass fraction
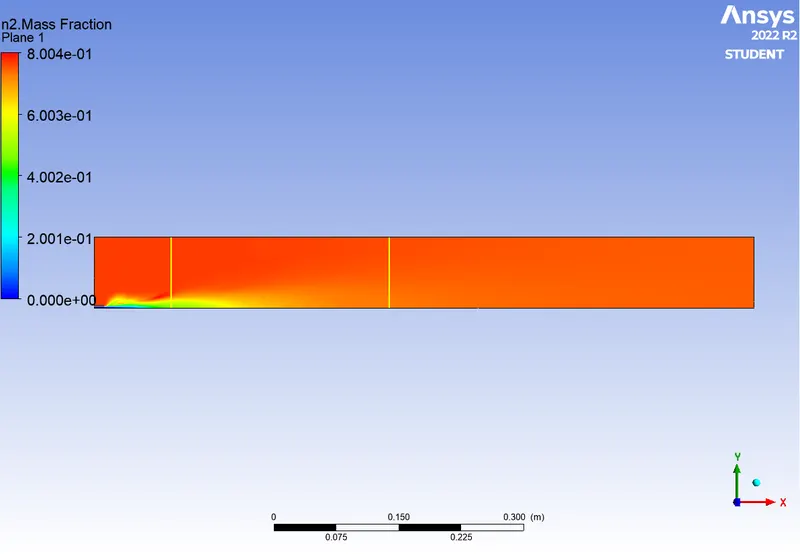
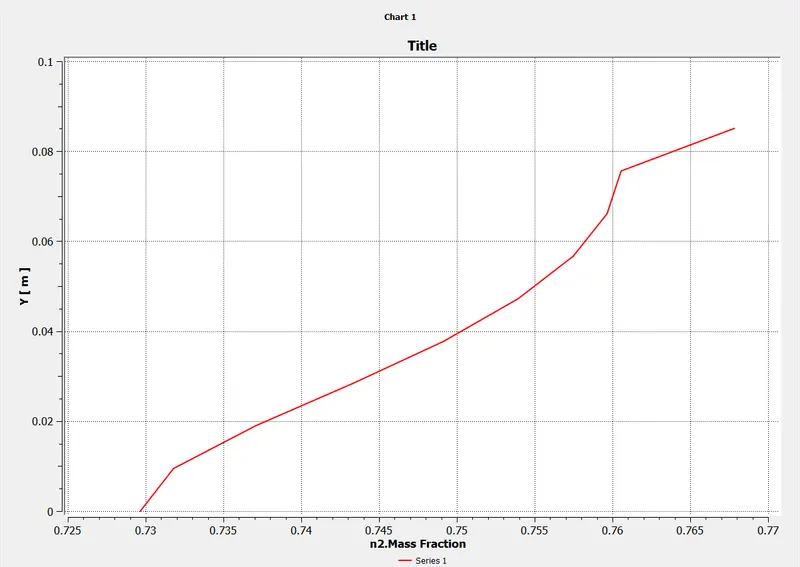
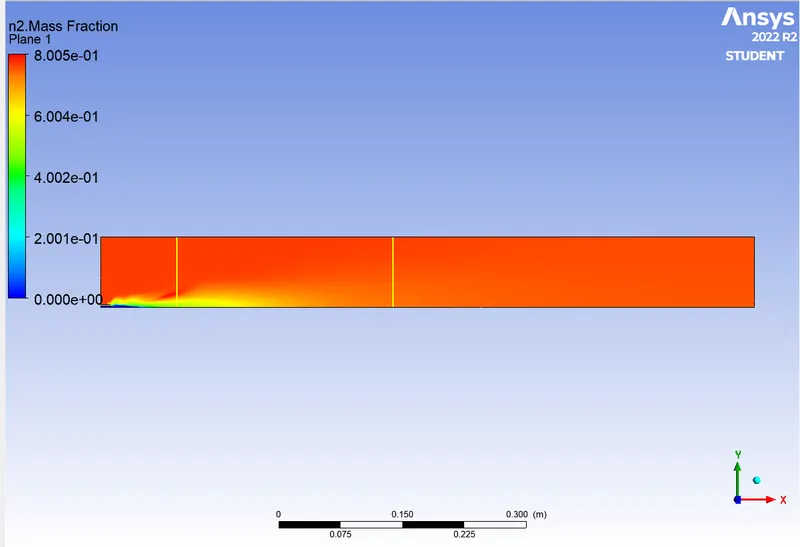
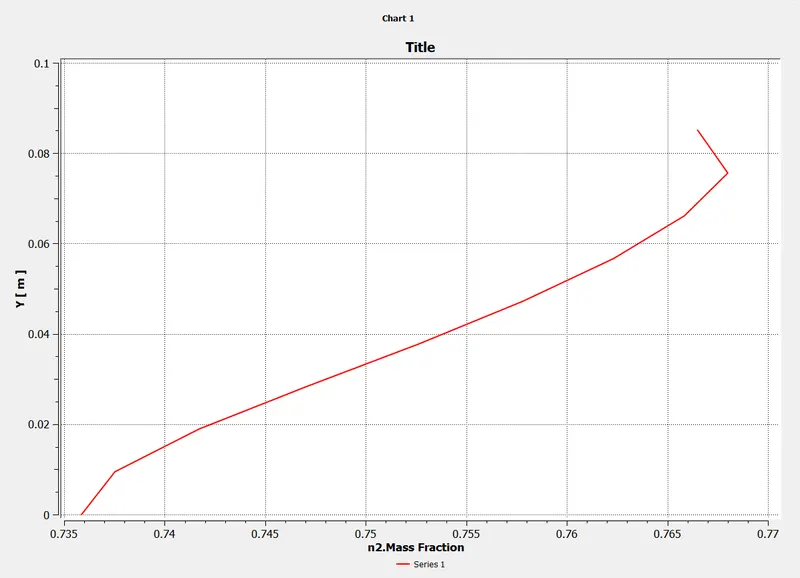
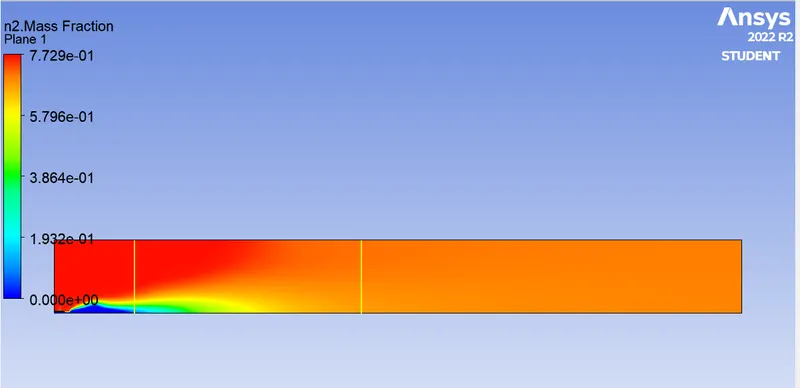
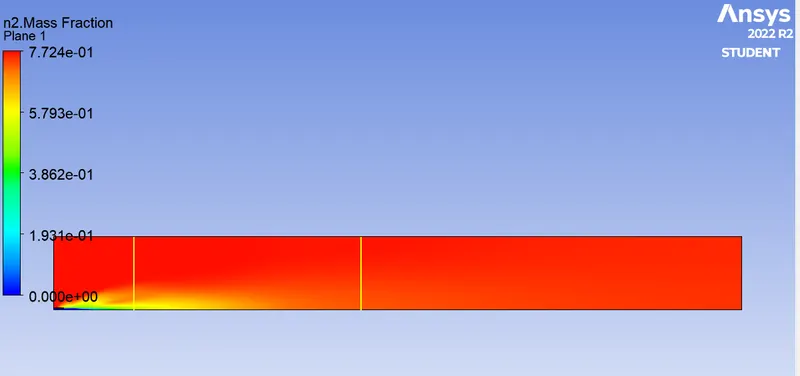
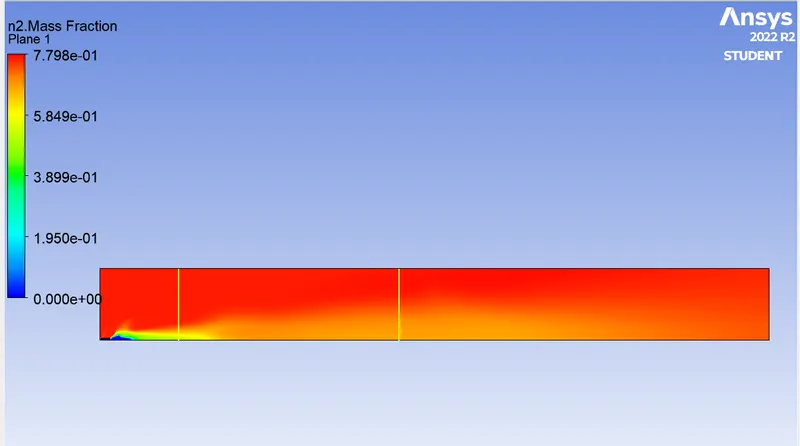
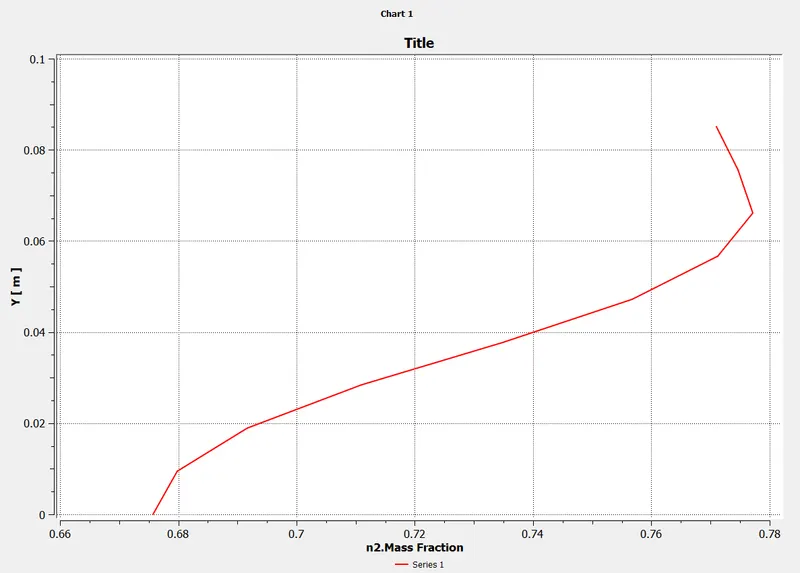
- N2 mass fraction
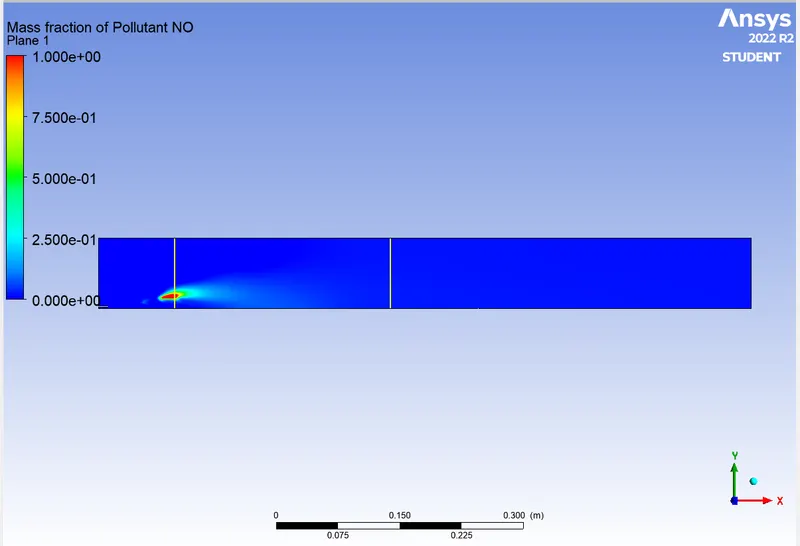
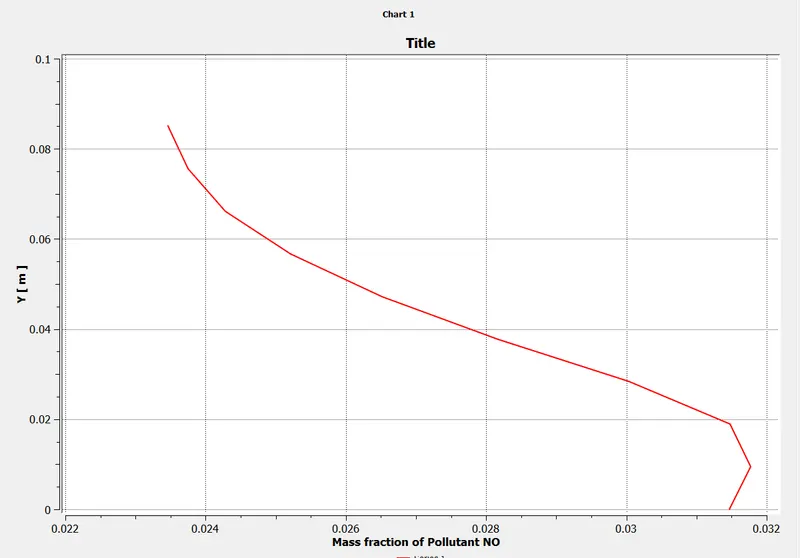
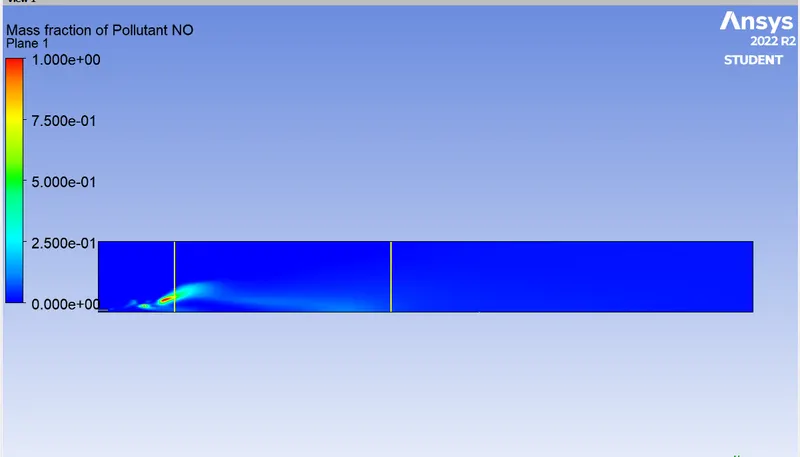
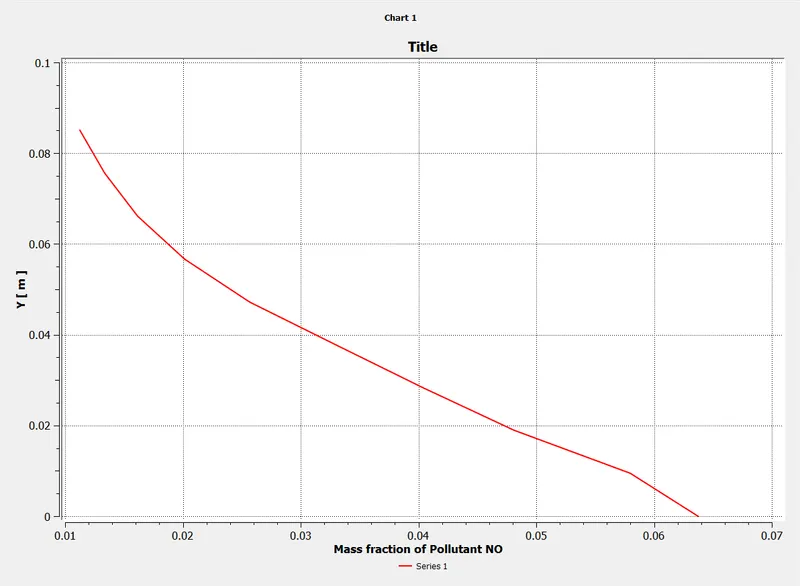
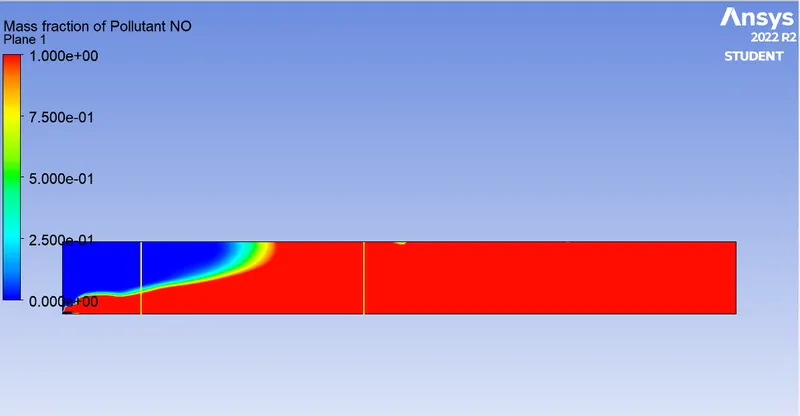
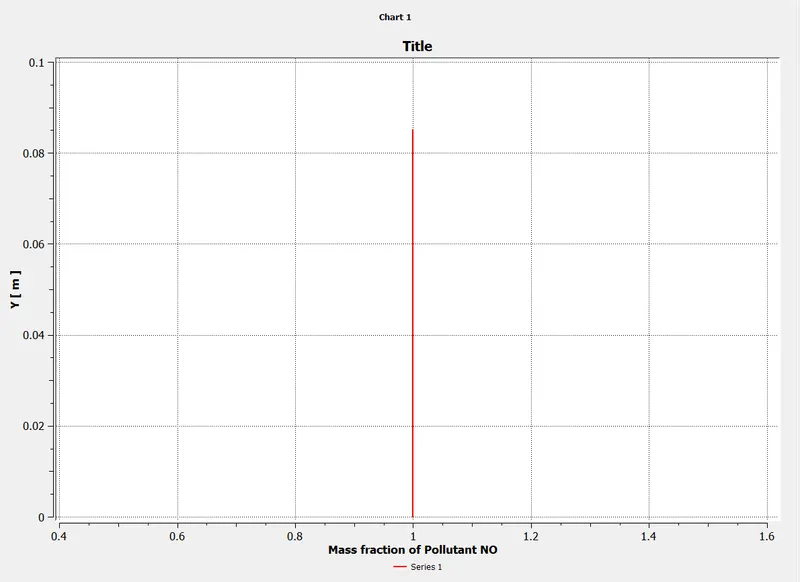
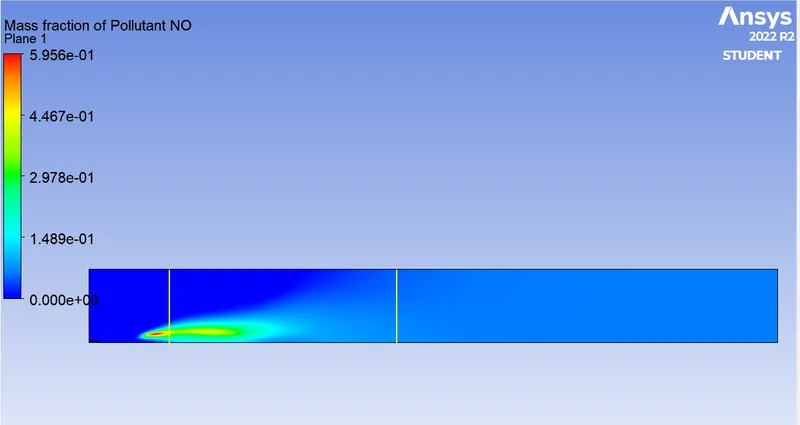
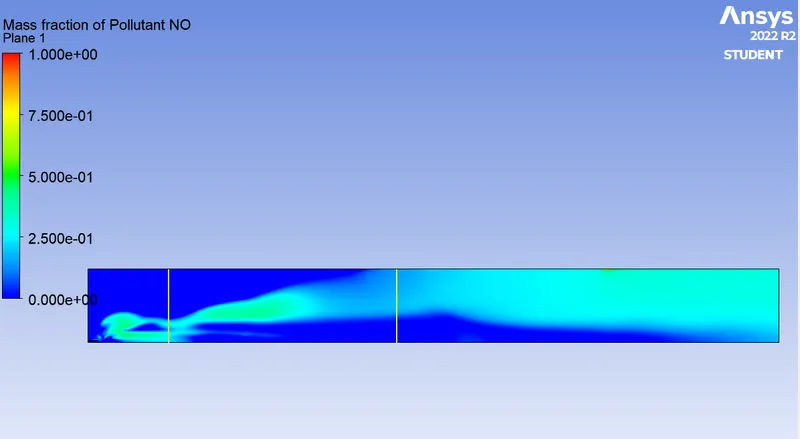
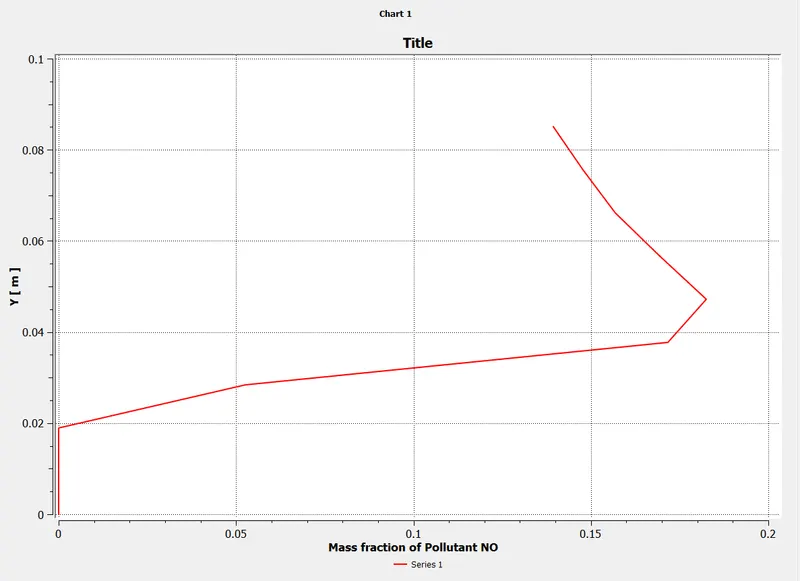
- Pollutant NOx mass fraction
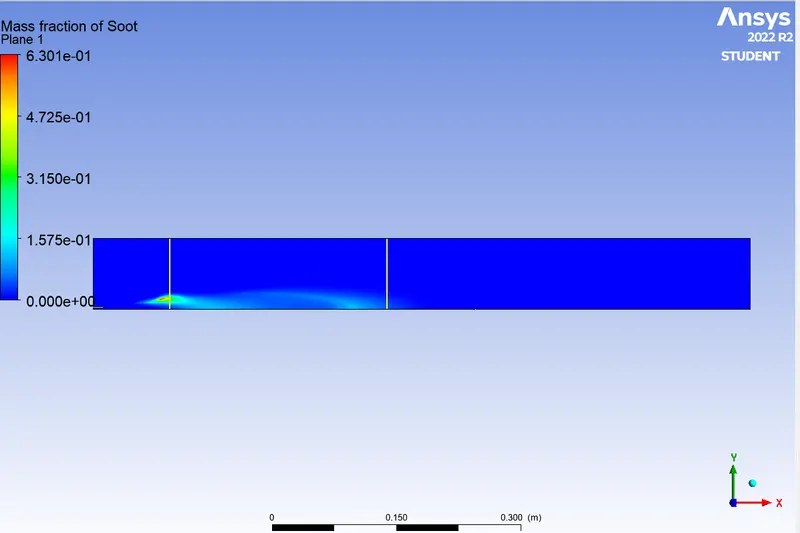
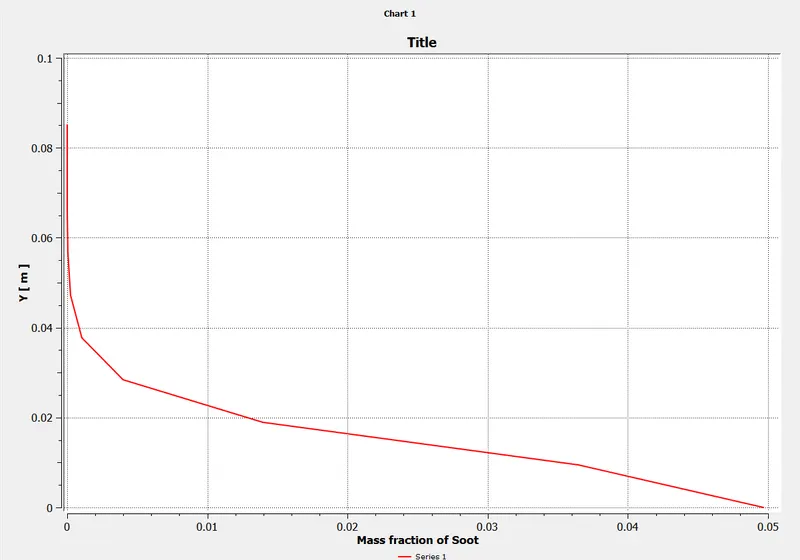
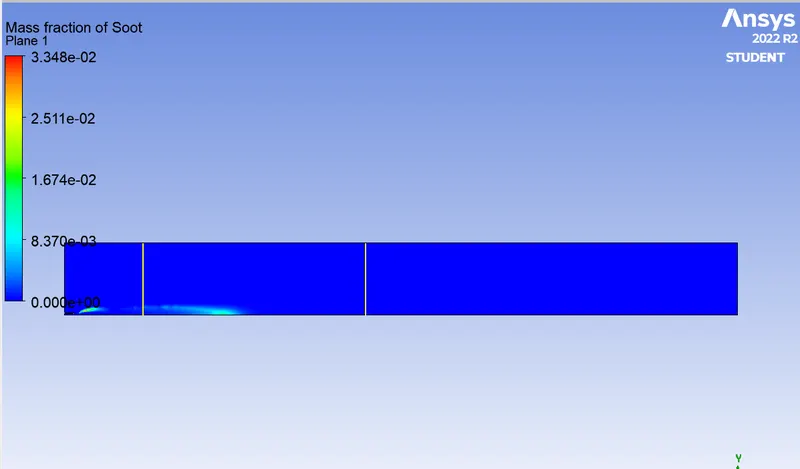
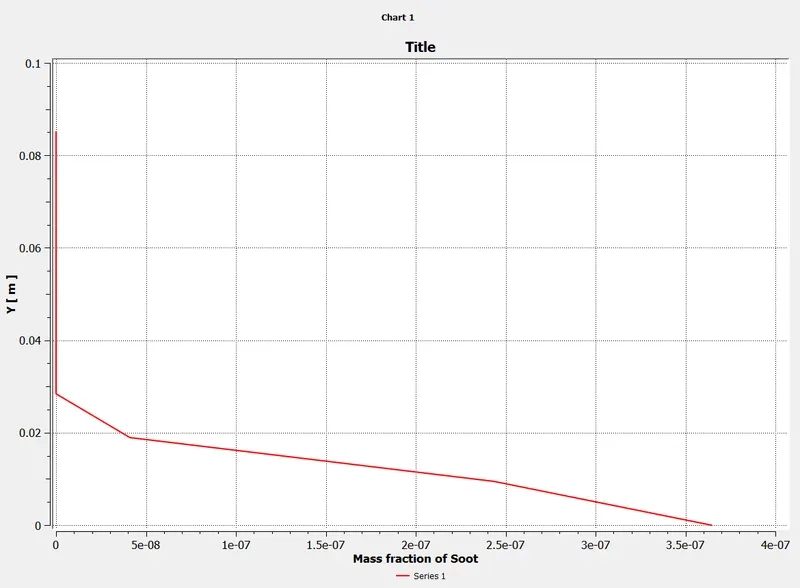
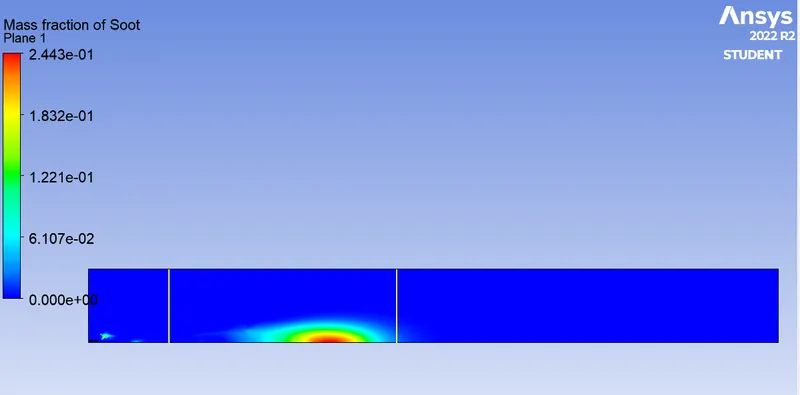
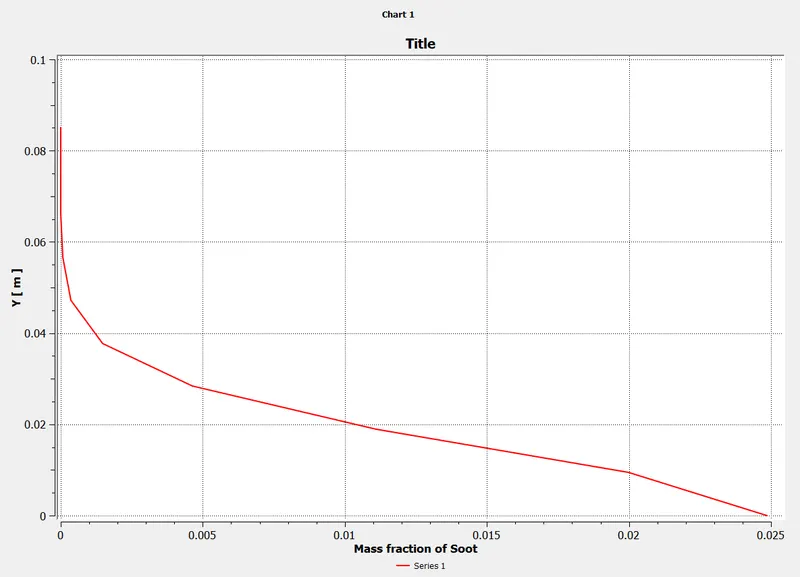
- Pollutant soot mass fraction
- Observations from part 1 simulation
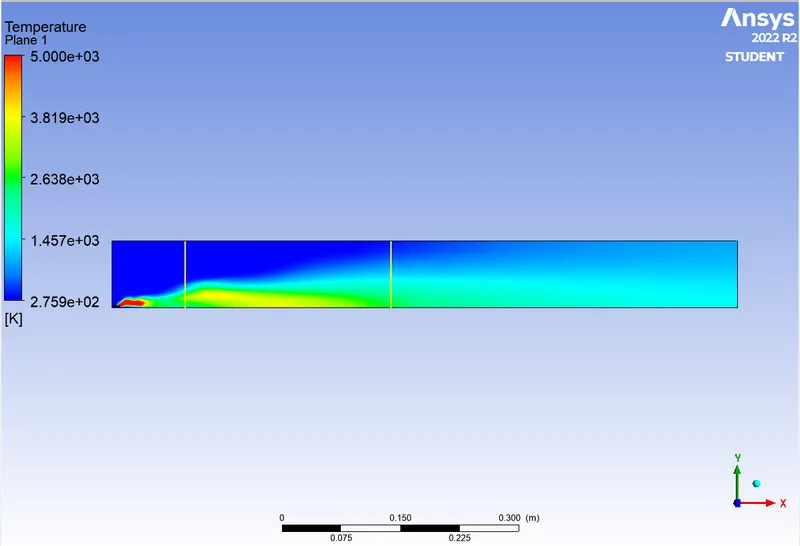
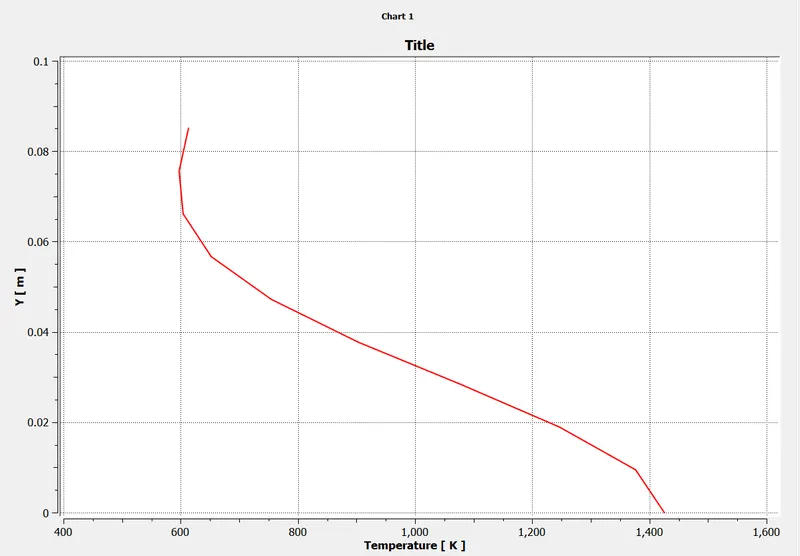
- 1. The temperature contour shows that the maximum temperature is observed in front of the entrance to the combustion chamber where the mixture of fuel and air mixture takes place.
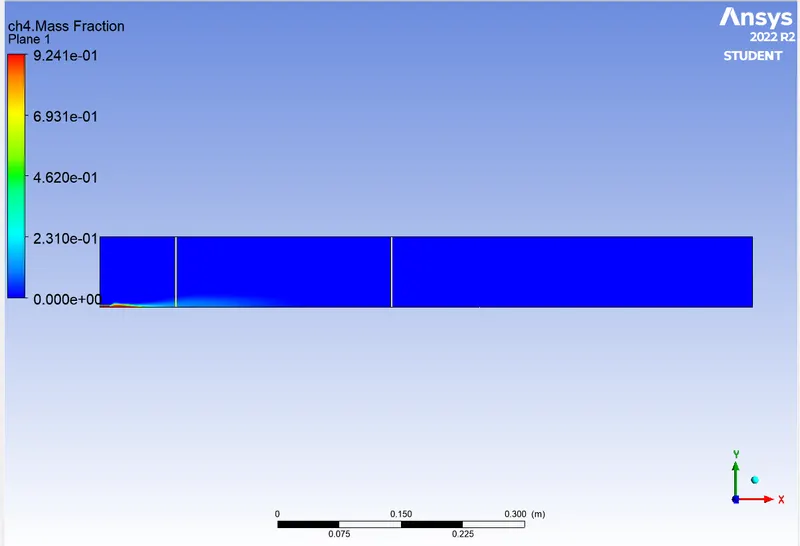
2. In the Ch4 mass fraction contour, the Ch4 mass fraction is highest near the fuel inlet where the fuel is expelled, and the Ch4 mass fraction decreases as combustion progresses.
3. The highest mass fractions of Co2 and H2o are observed in the high temperature zone.
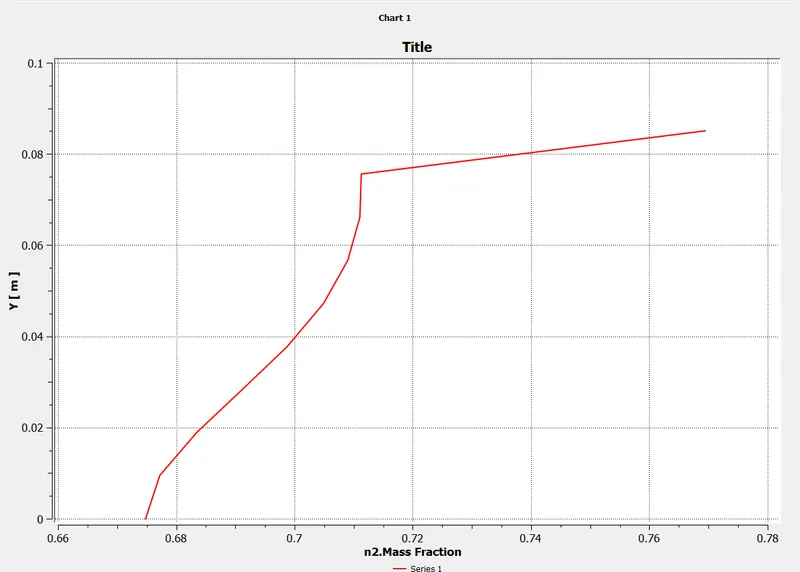
4. The N2 mass fraction contours show that the N2 is fairly evenly distributed throughout the combustion chamber.
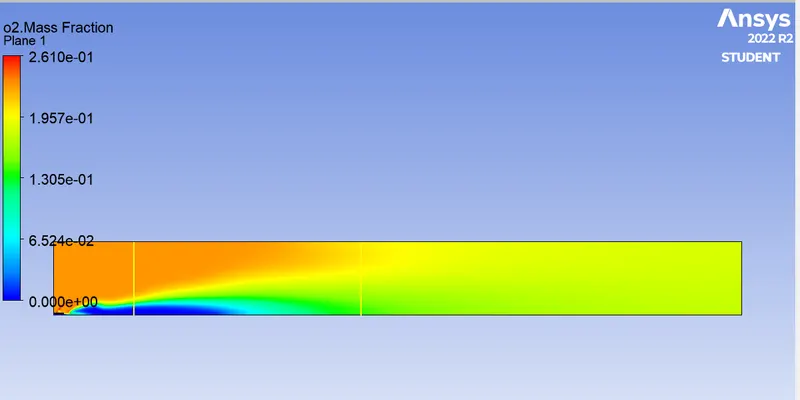
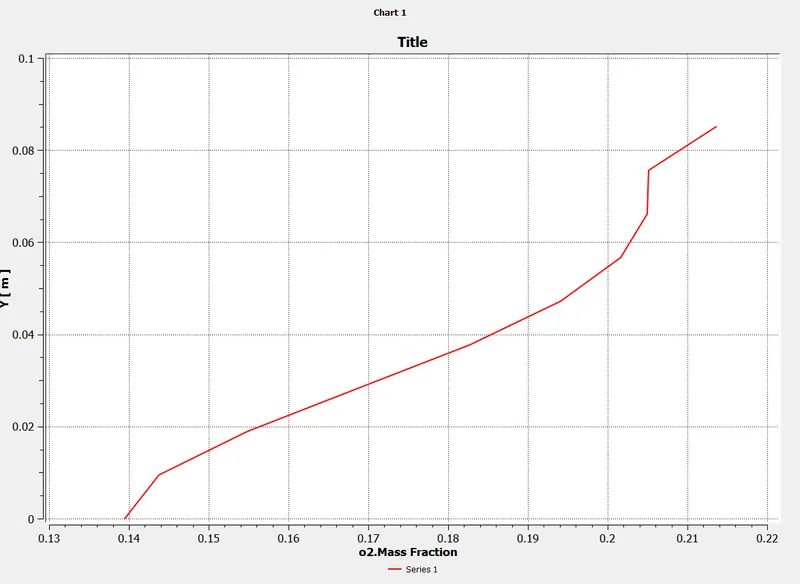
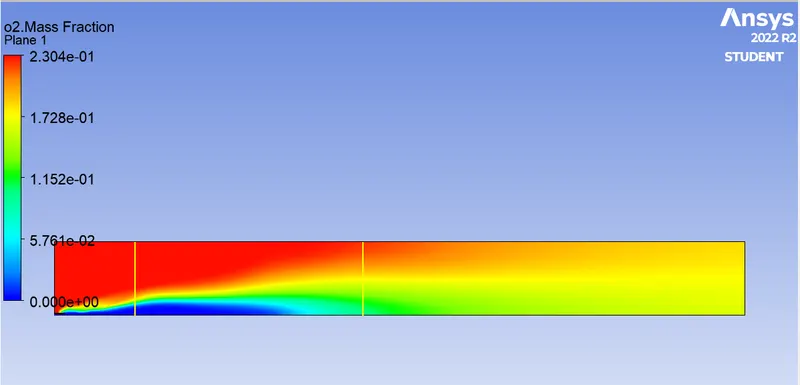
5. The oxygen mass fraction is highest near the air intake.
6. The mass fraction of pollutants such as NOx and soot is close to the exit of the combustion chamber.
- To add the water content in the fuel from 5% to 30% by mole and observe the effect of it on the results.
- 10 % water
- 5 % of water
- 20 % water
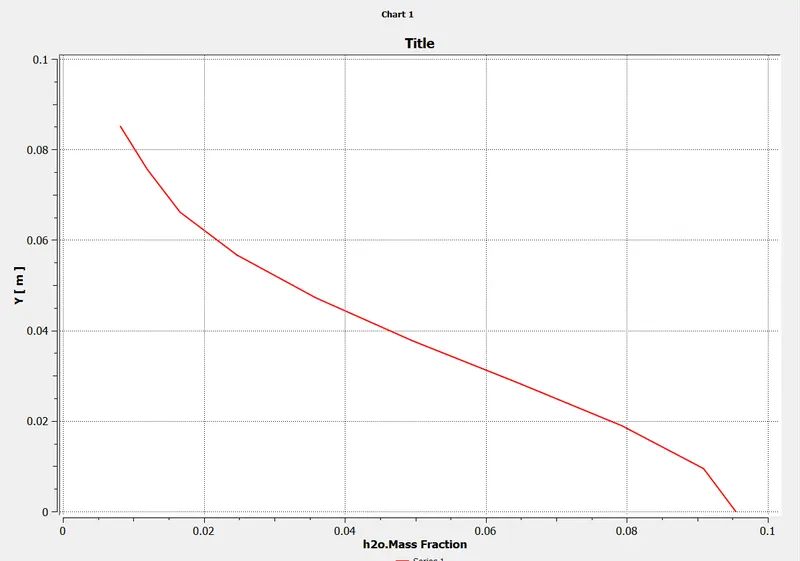
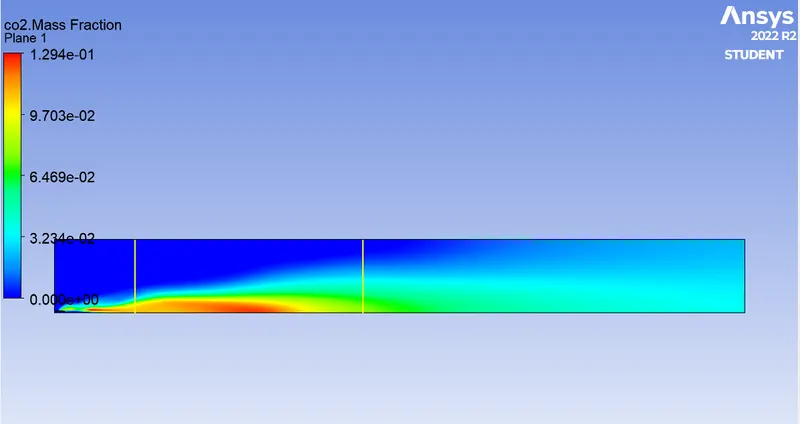
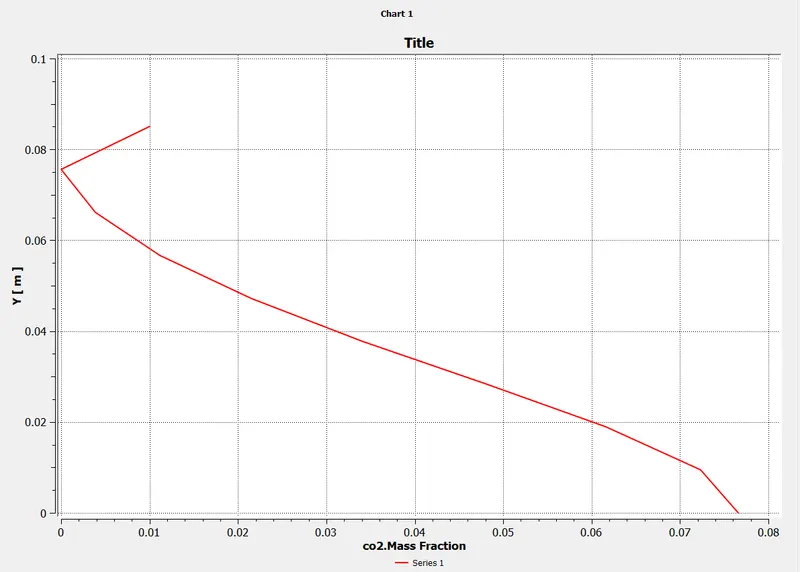
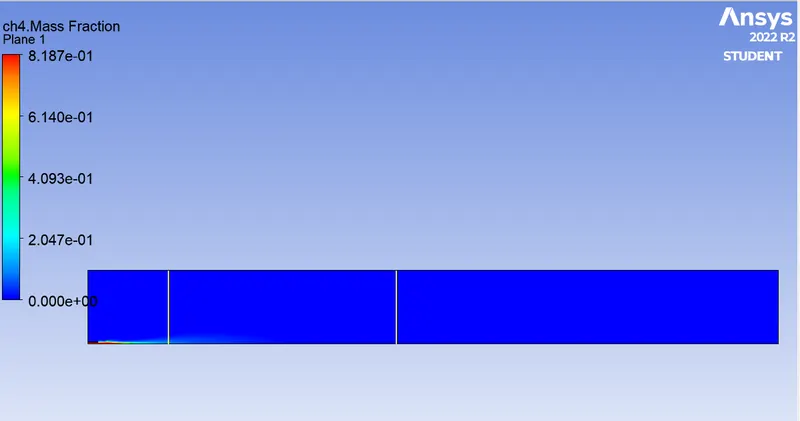
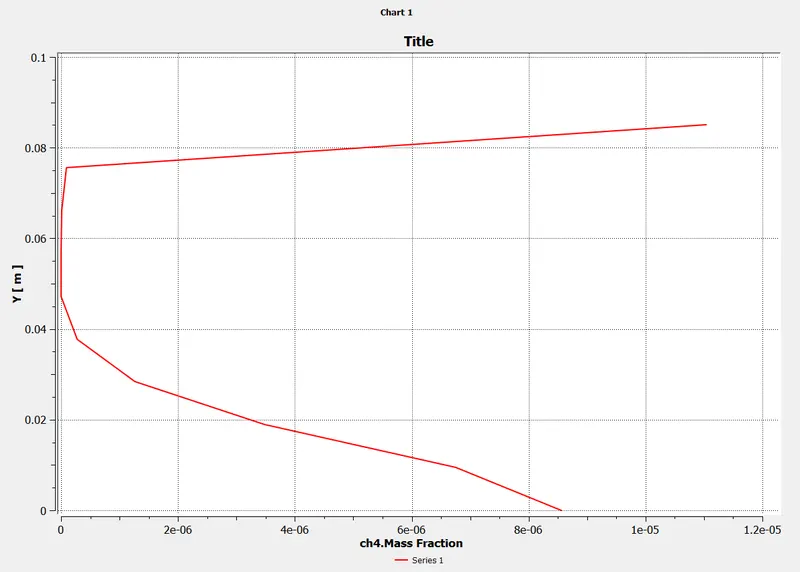
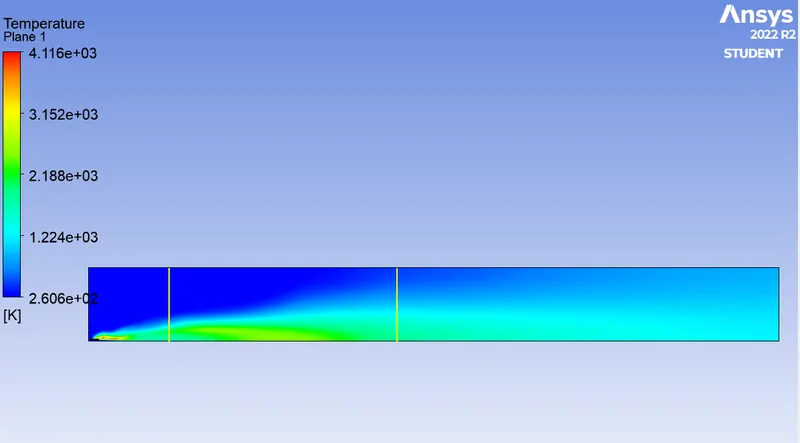
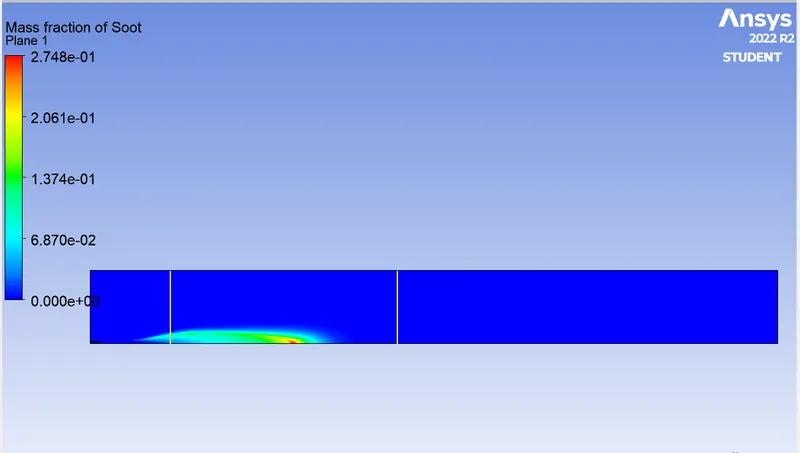
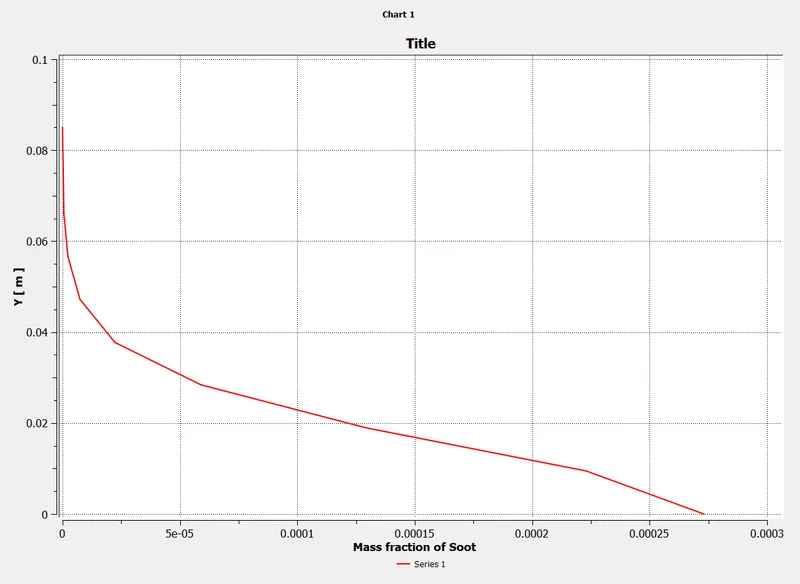
- 30 % water
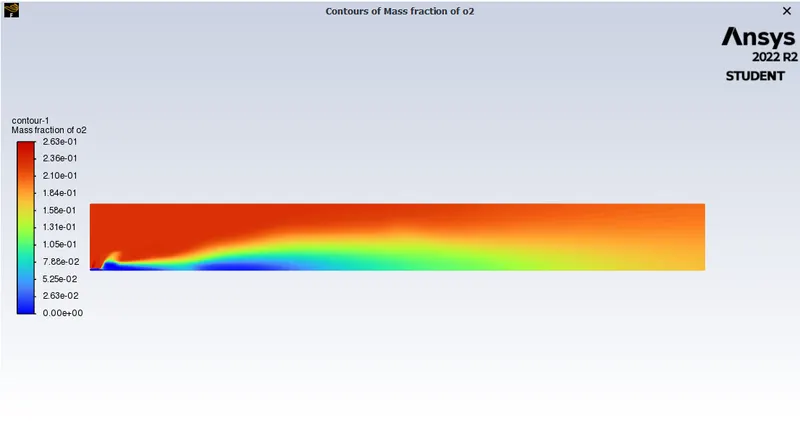
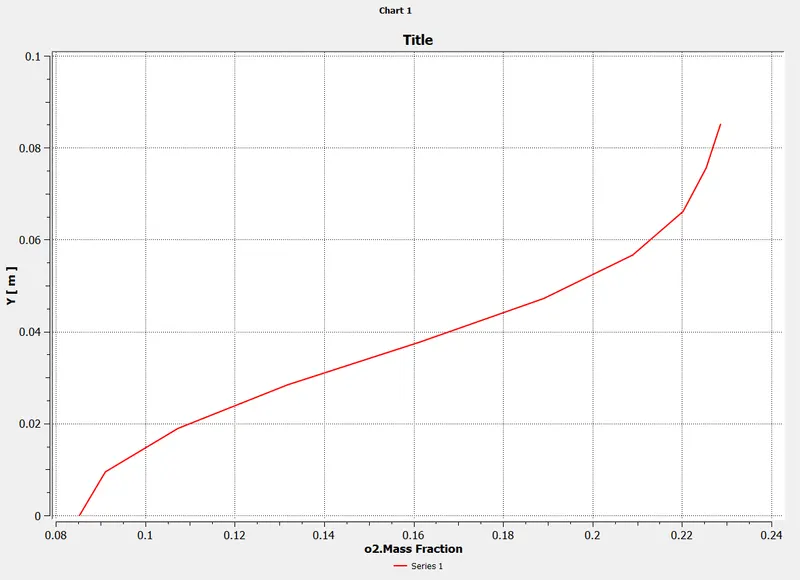
- Observation
- Diluting the fuel with H2O actually reduces the formation of harmful pollutants such as NOX and exhaust soot.
- Dilution of fuel with water results in a greater reduction in soot concentration than NOX . Little change is seen in the mass fractions of N2 and O2.
- The mass fraction of pollutants such as NOx and soot decreases with increasing moisture content in the fuel.
- Since the soot value decreases with dilution, less fuel is wasted. In other words, complete combustion takes place.
- Conclusion
- It can be seen that as the water content increases, the outlet NO pollutant decreases and ultimately the noxious emissions.
- The temperature drops in the same way.
- This project uses physical and mathematical models integrated in the CFD software ANSYS fluent to predict mass fractions of pollutants from NOx emissions and soot formation.
- Results obtained from the simulations show that adding water to the fuel not only lowers the combustor temperature, but also helps reduce the mass fraction of pollutants such as NOx and soot.
- This simulation shows that combustion is caused by turbulent mixing of CH4 fuel and air.
- This creates pollutants and soot at the exit. Mixing H2O and CH4 fuels at the inlet slows ignition and increases the time for the two fuels to mix. This lowers the maximum combustion temperature and reduces pollutants and soot formation at the exit.