Week 10 - Simulating Combustion of Natural Gas.
Aim: Perform a combustion simulation on the combustor model.
Objective: -
- To study the combustion Phenomenology for the whole problem.
- To study the eddy dissipation model.
- To study the NOx and soot formation inside the burner.
- To pre-process the geometry for the simulation.
- To select correct element size and type for the simulation.
- To setup the combustion simulation using eddy dissipation model.
- To setup NOx and soot formation model in simulation.
- To plot the mass fraction of CO2, H2O, CH4, N2, O2, NOx and soot formation.
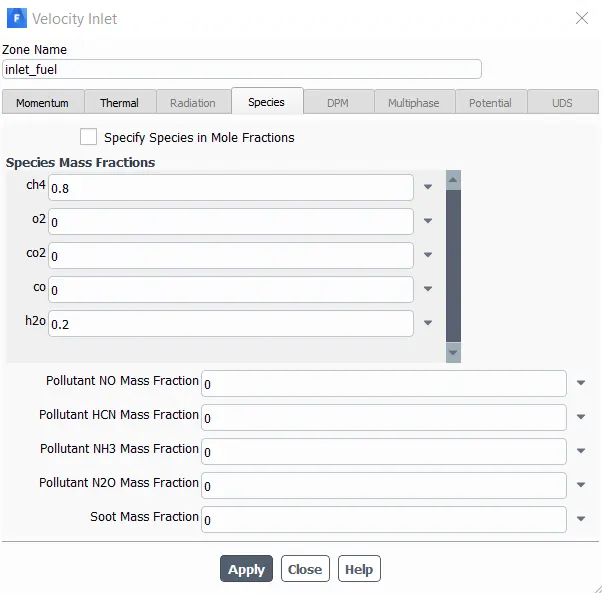
- To perform the simulation by adding water with fuel in range of 5% to 30% to lower the NOx and soot formation in combustion.
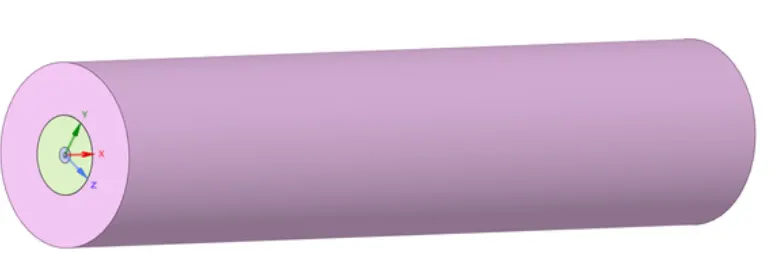
Geometry:


Meshing:

The mesh size is set to 1.2mm and the capture proximity is turned on.
Then the inlet, outlet, walls, aand axis are named.
Element size : 1.2mm
No of elements : 46981
Setup:
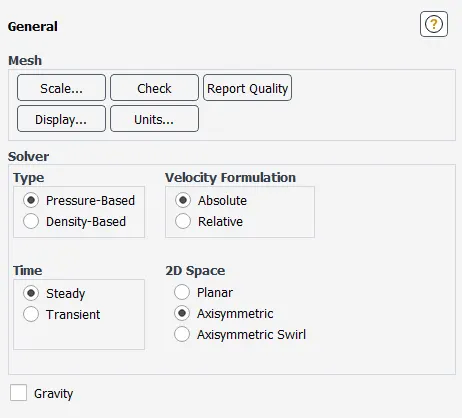
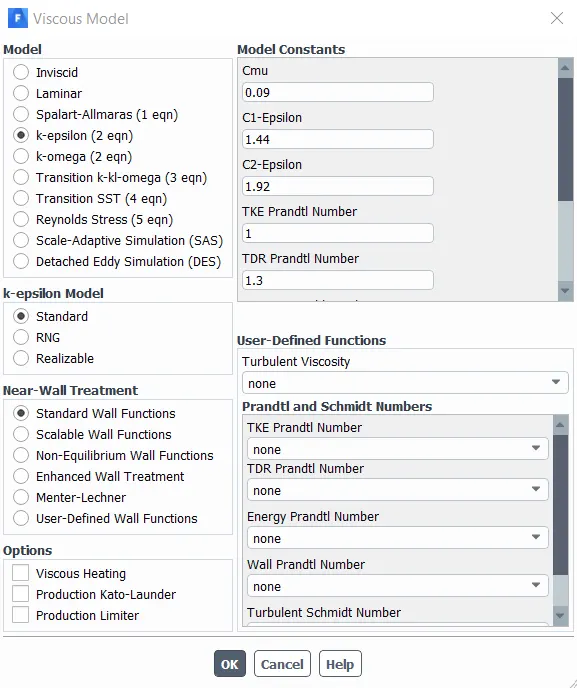
he set up begins with activating the energy equation, then the 2D space is set to axissymmetric. K-εε→→standard→→standard wall function is chosen.
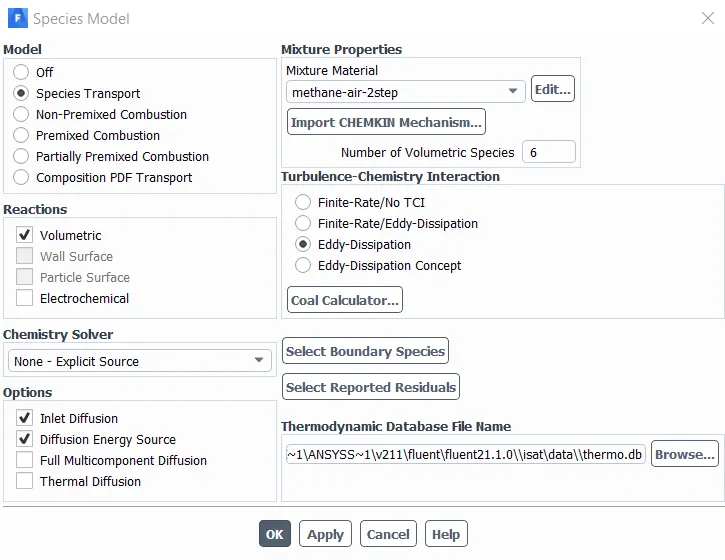
Species transport, the volumetric reaction and diffusion energy source is selected. methane-air-2step mixture model and eddy dissipation is chosen.
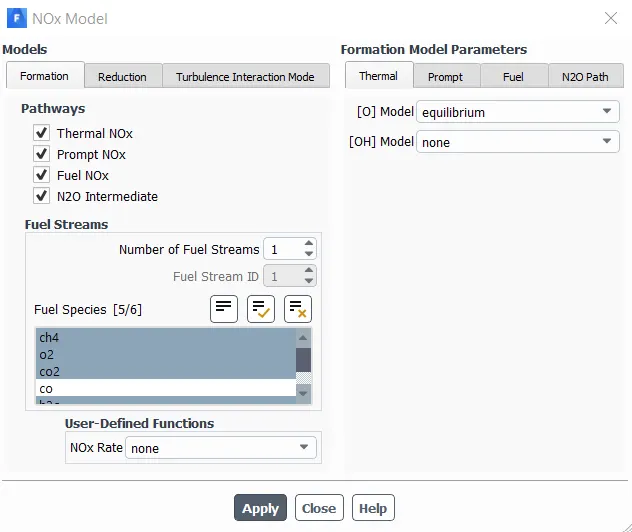
In the NOX model, all the pathways are selected and the desired species whose values needed to be calculated are selected.
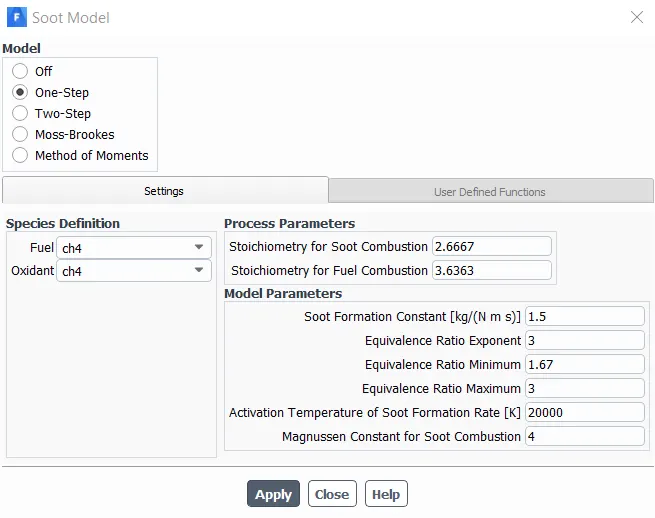
One-step soot model is chosen and CH4 is set as the fuel and O2 is set to oxidant.
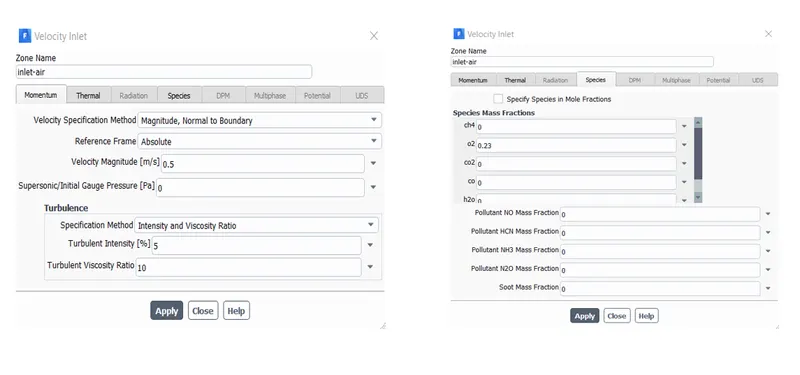
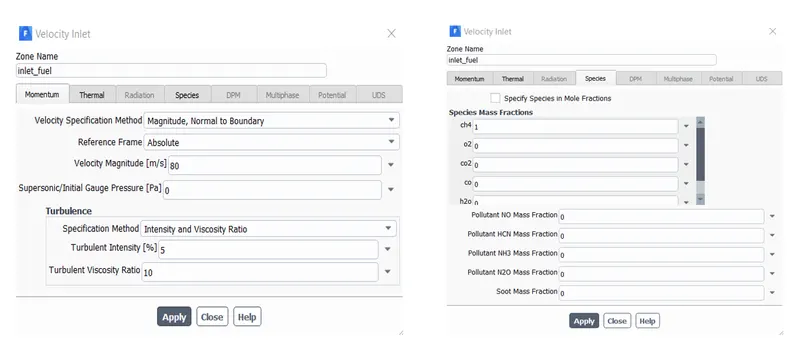
The air-inlet boundary velocity is set to 0.5m/s and for fuel is set to 80m/s.
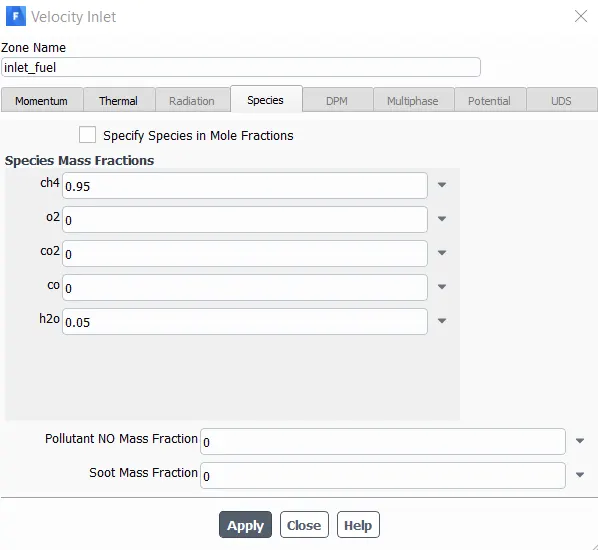
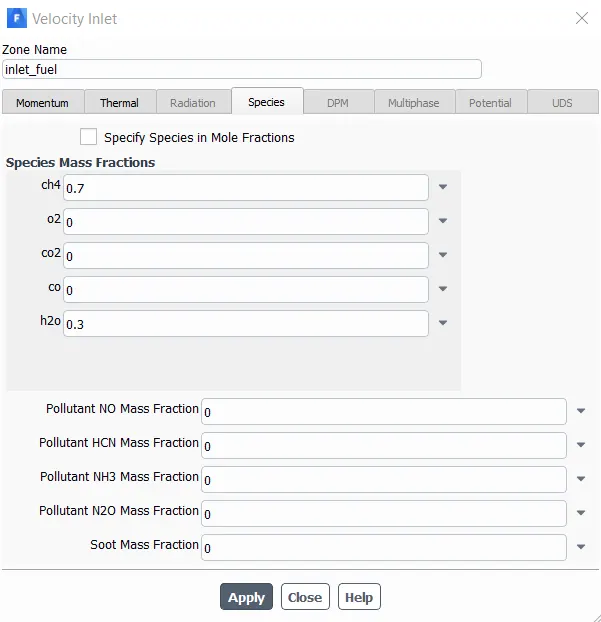
The fuel mass fraction of CH4 is set to 1 and varied accordingly and the air mass fraction is set to 0.23.
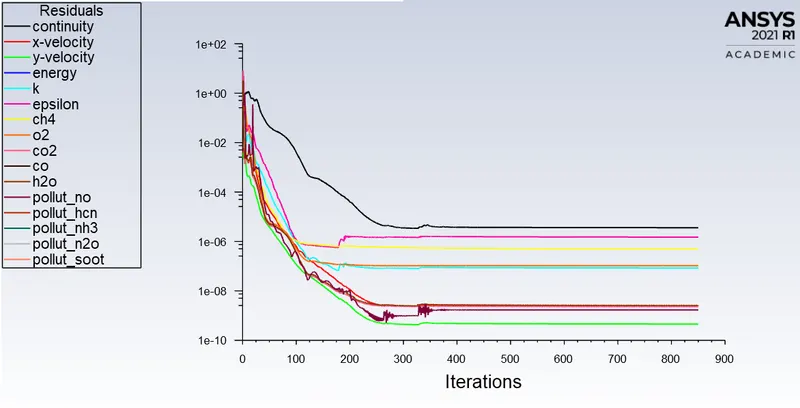
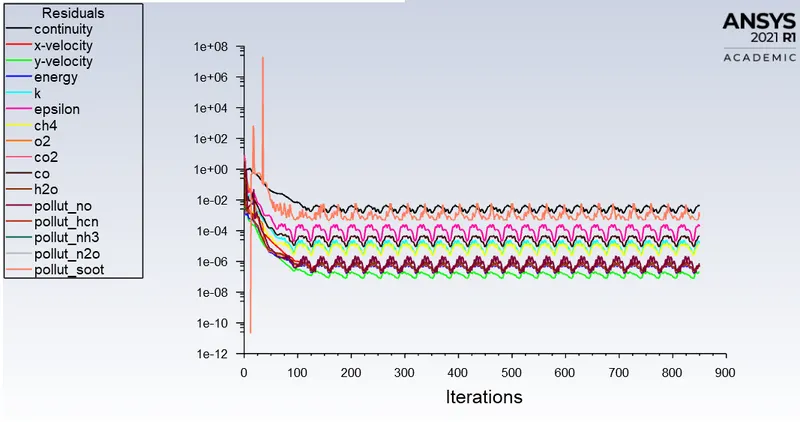
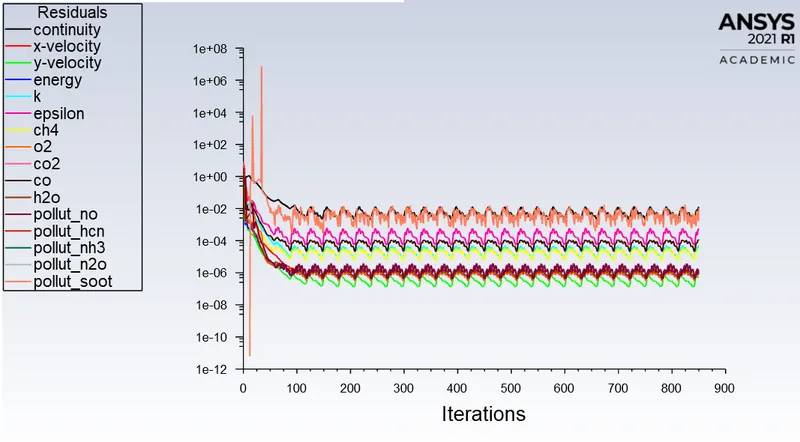
The hybrid initialisation is done and then the iterations are run for 1000iterations.
Results:
1) Residual Plot
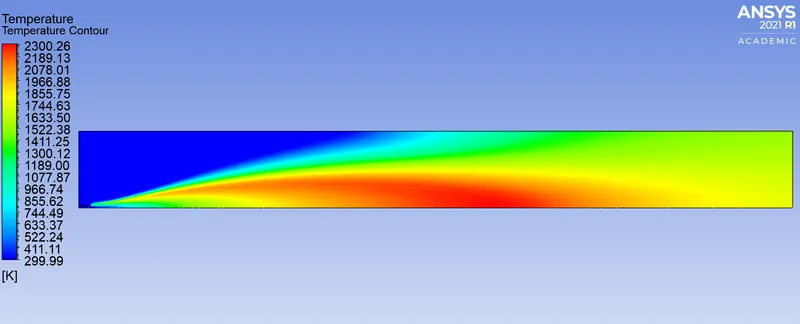
2) Temperature plot
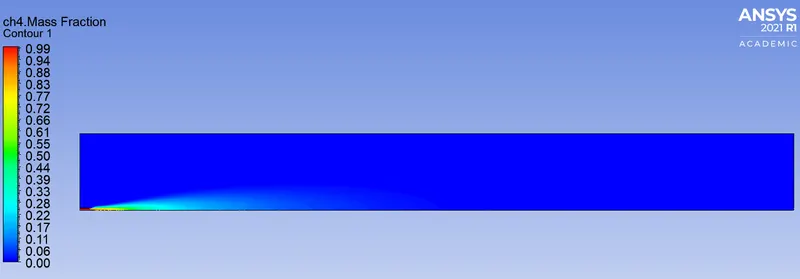
3) Mass fraction of CH4
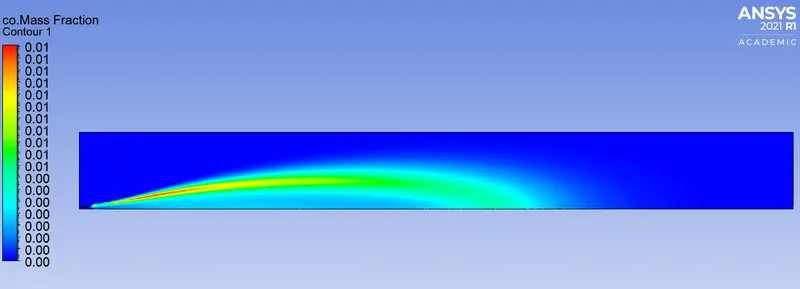
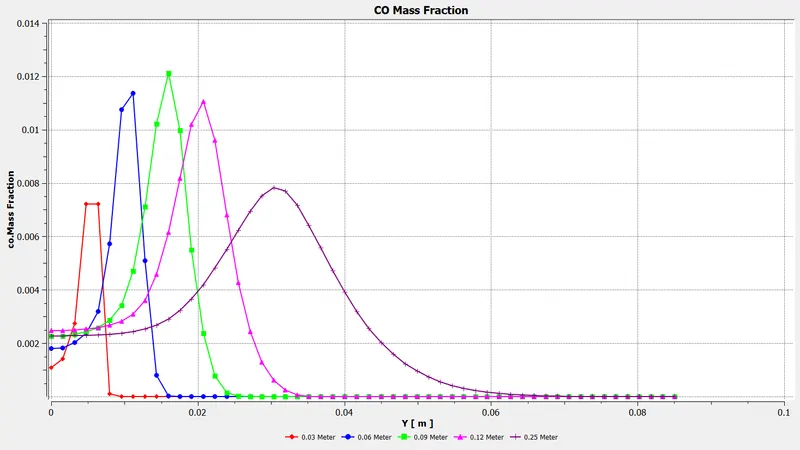
4) Mass Fraction CO
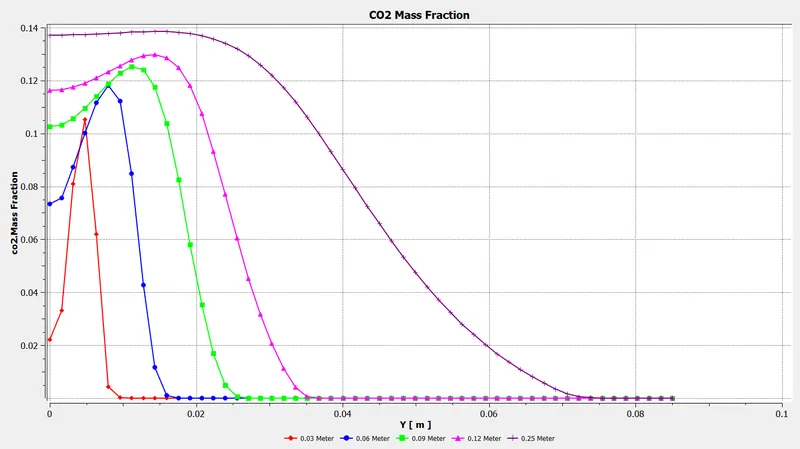
5) Mass Fraction of CO2
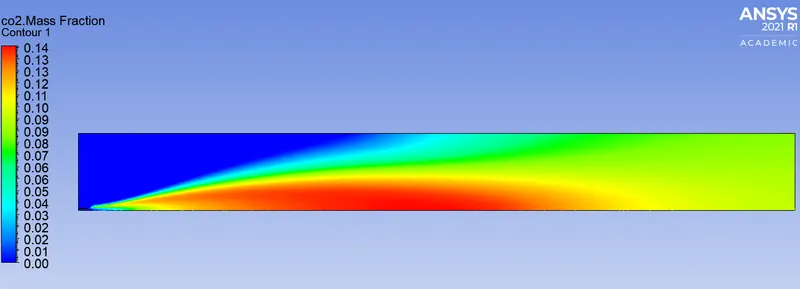
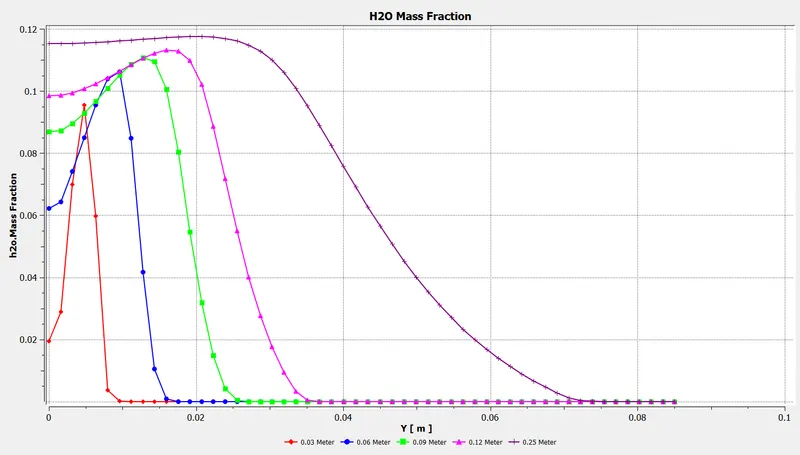
6) Mass Fraction of H2O
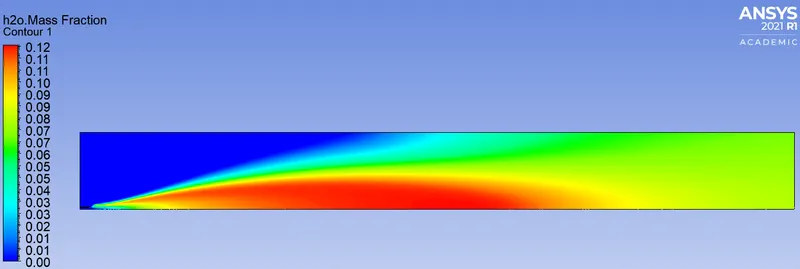
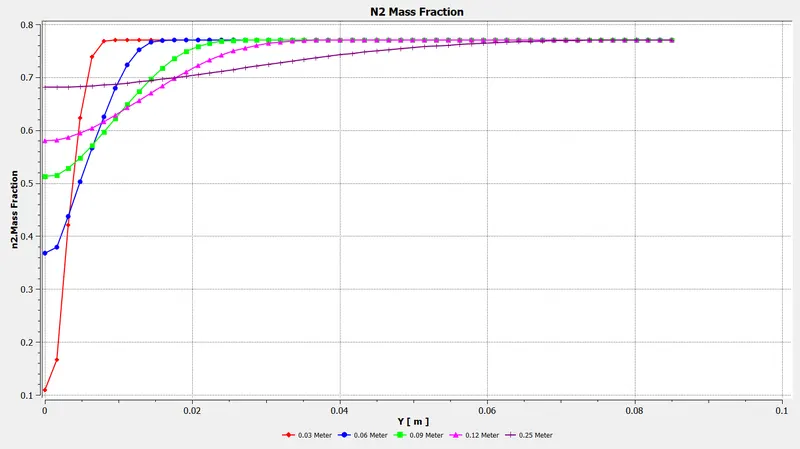
7) Mass Fraction of N2
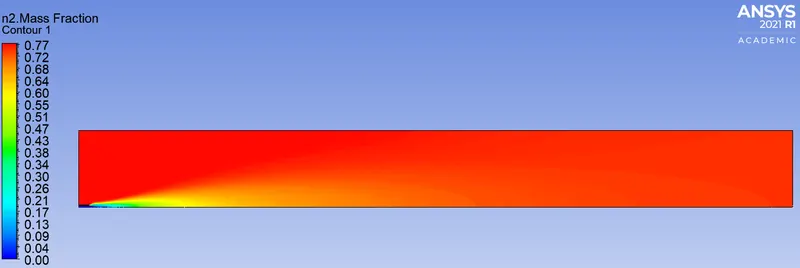
8) Mass Fraction of O2
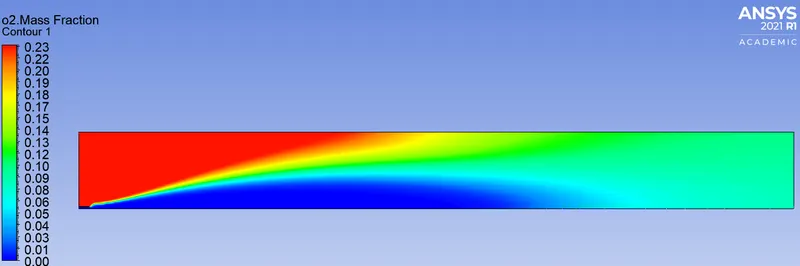
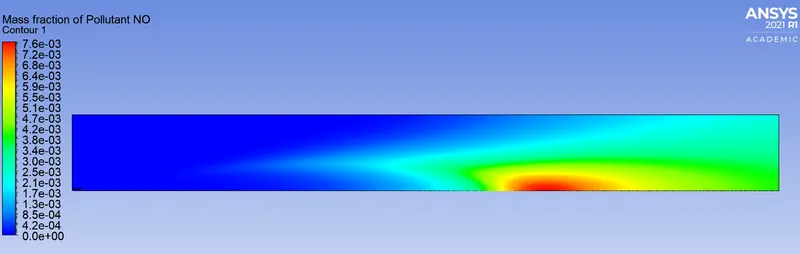
9) Mass fraction of NOx
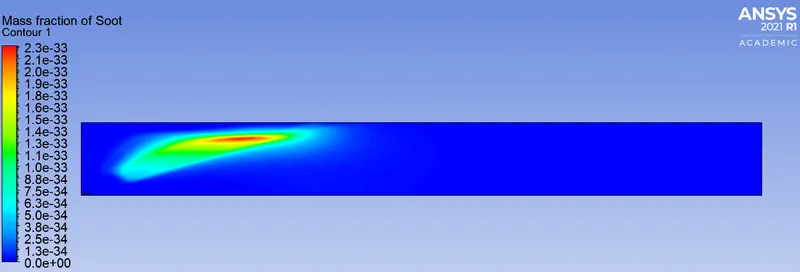
10) Mass Fraction of Soot
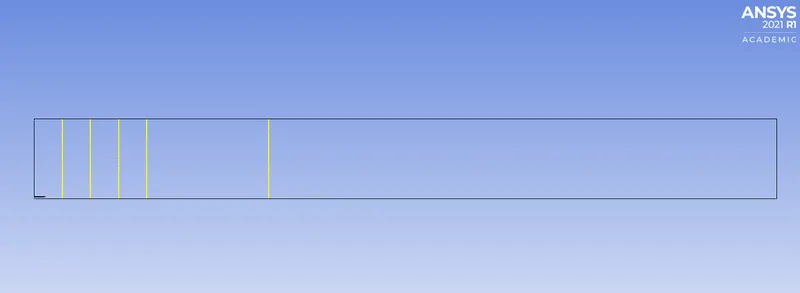
11) Line Plots for graphs
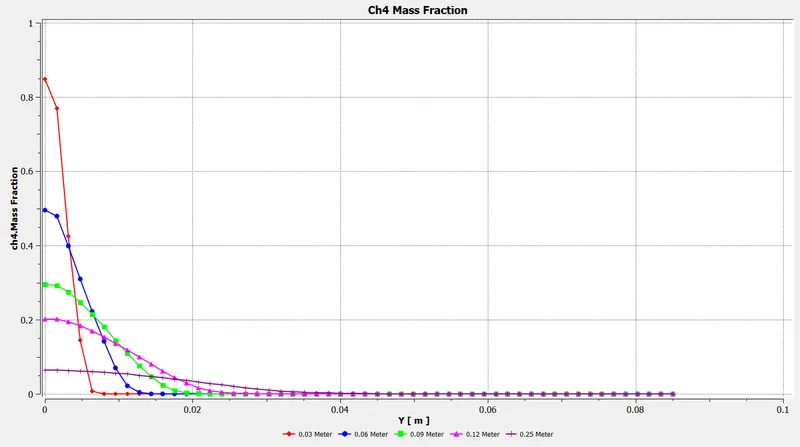
12) Graph of CH4
13) Graph of CO
14) Graph of CO2
15) Graph of H2O
16) Graph of N2
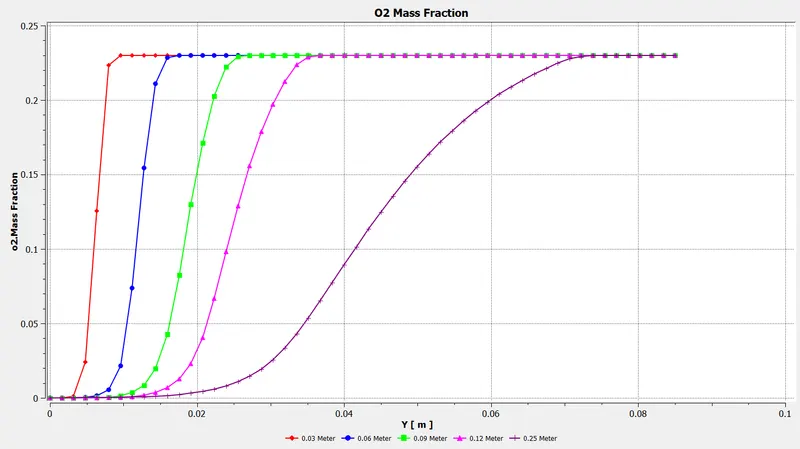
17) Graph of O2
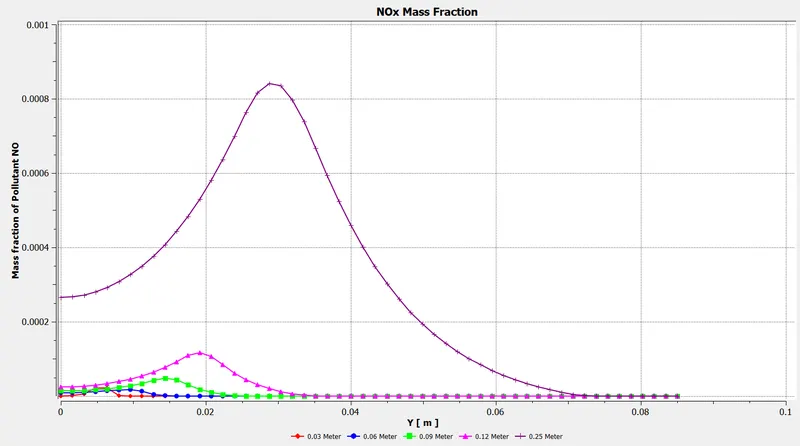
18) Graph of NOx
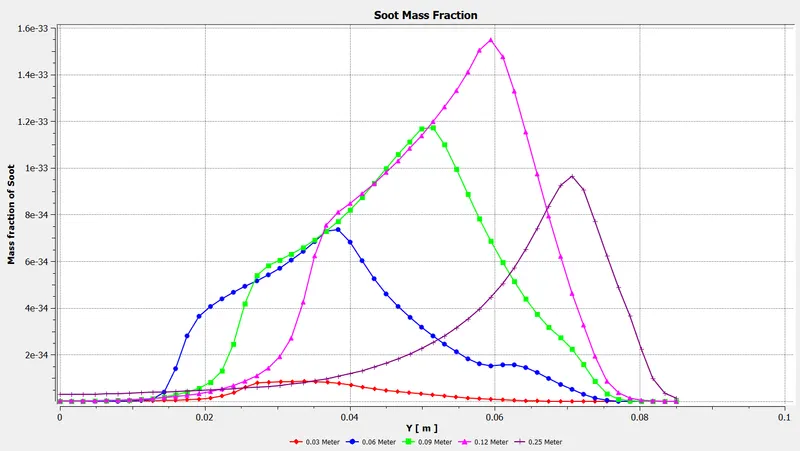
19) Graph of Soot
Case 1 - Oxygen 5%
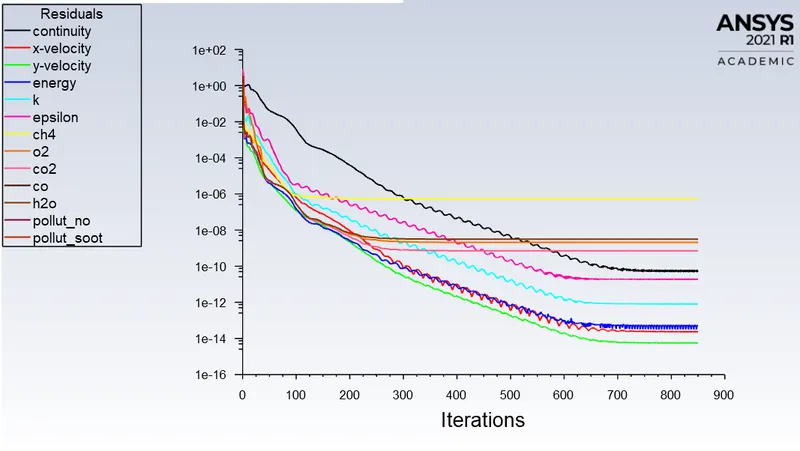
1) Residuals
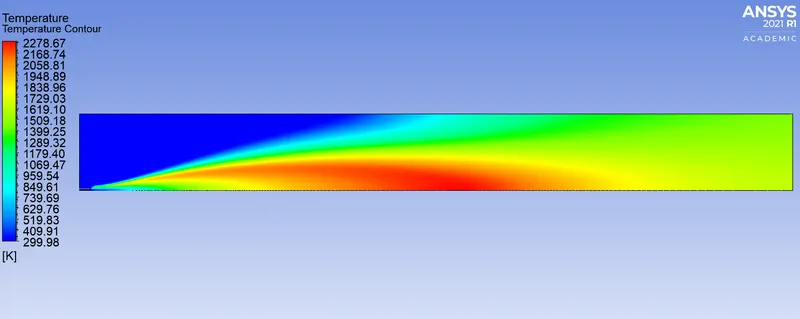
2) Temperature plot
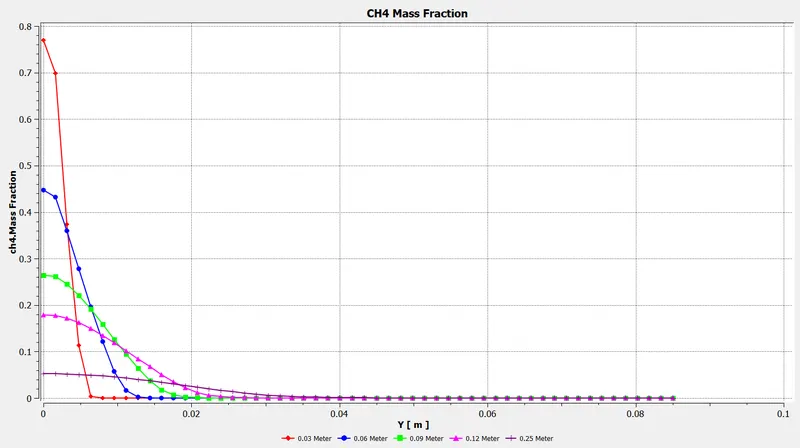
3) Graph of CH4
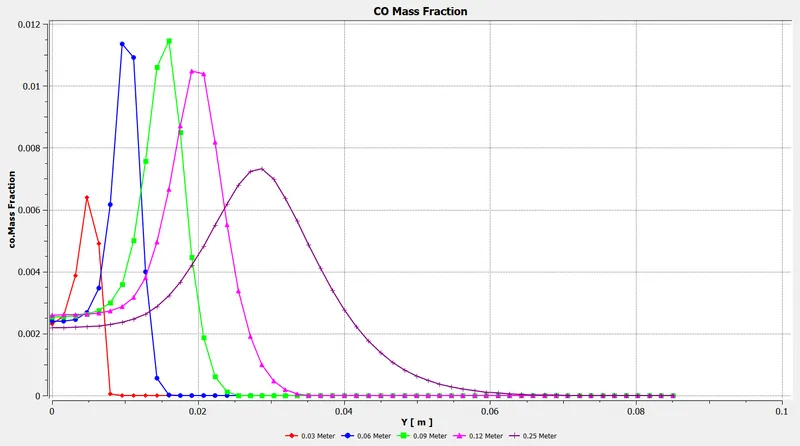
4) Graph of CO
5) Graph of CO2
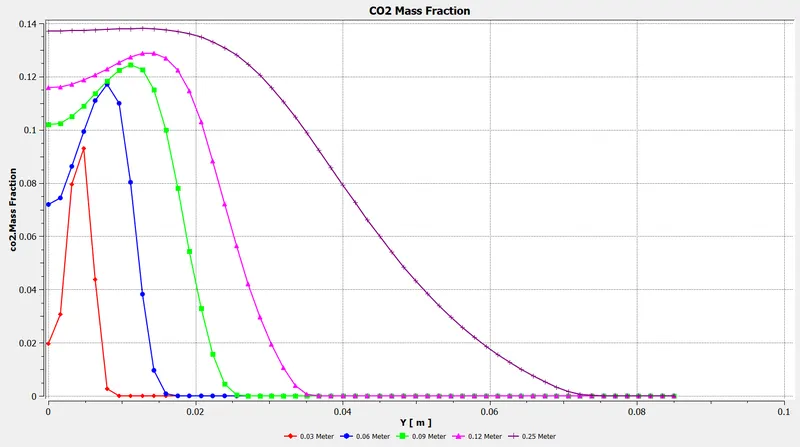
6) Graph of H2O
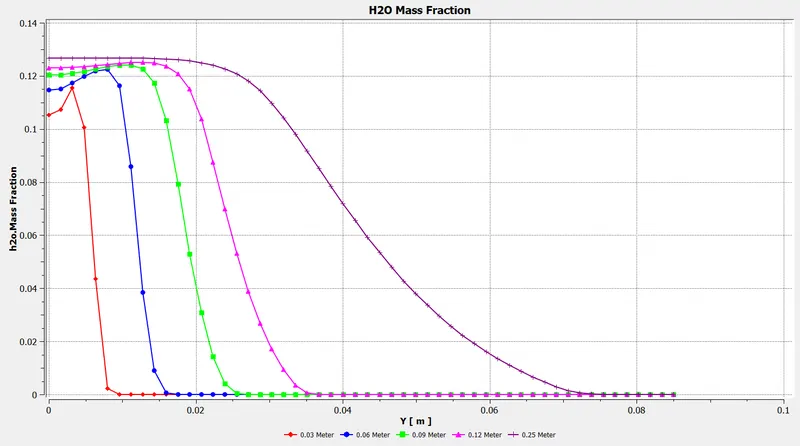
7) Graph of N2
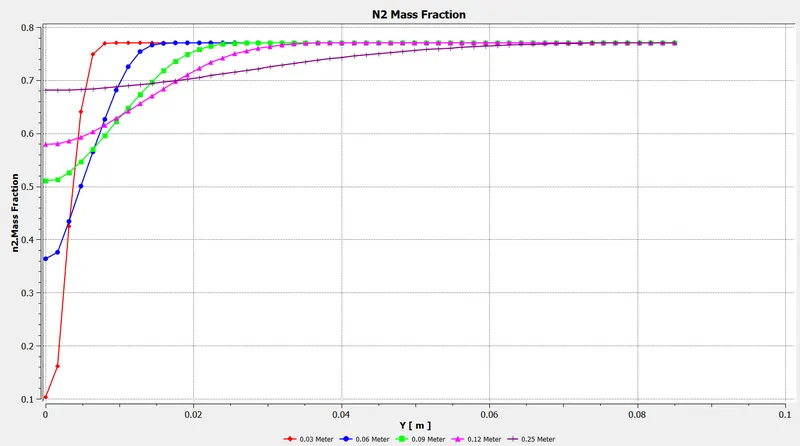
8) Graph of O2
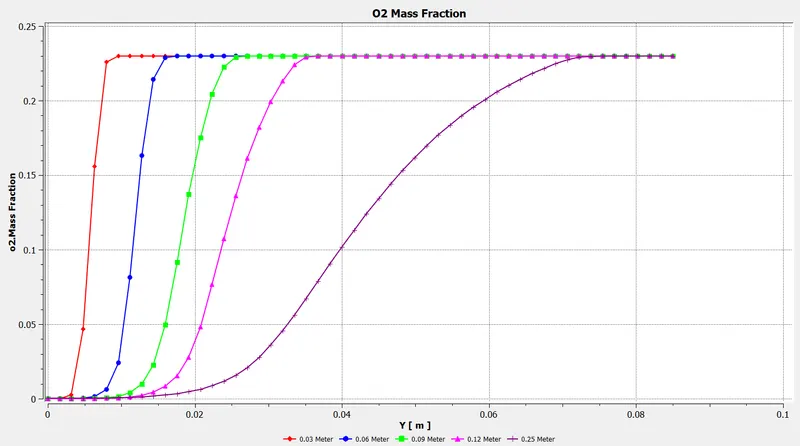
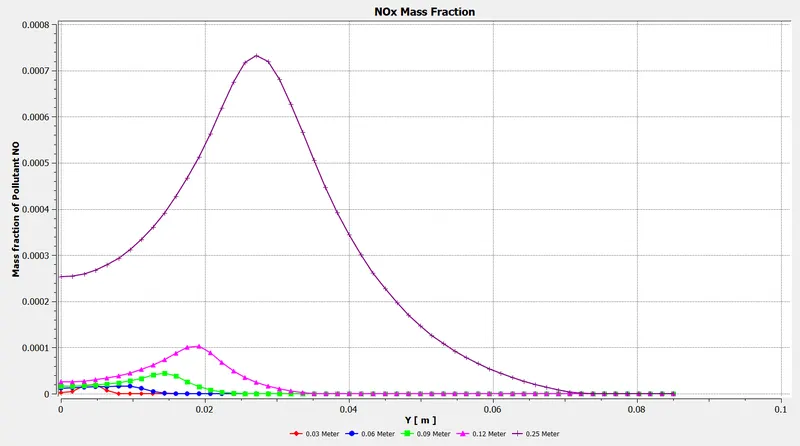
9) Graph of NOx
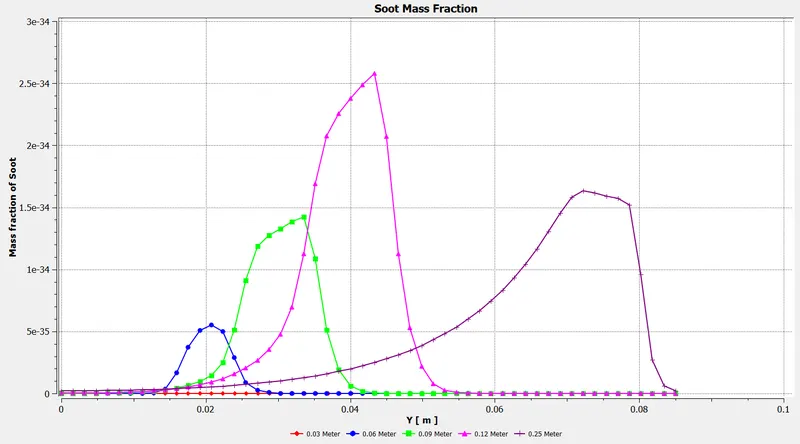
10) Graph of Soot
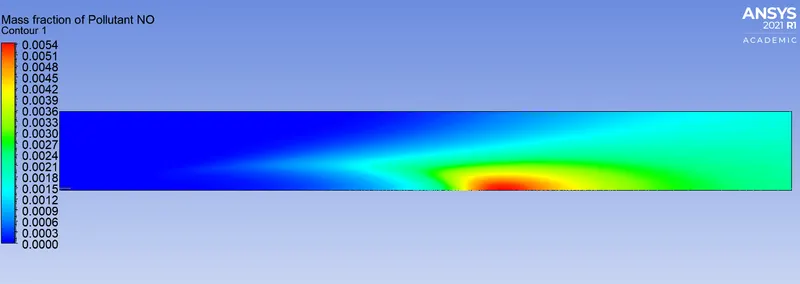
11) Mass Fraction of NOx
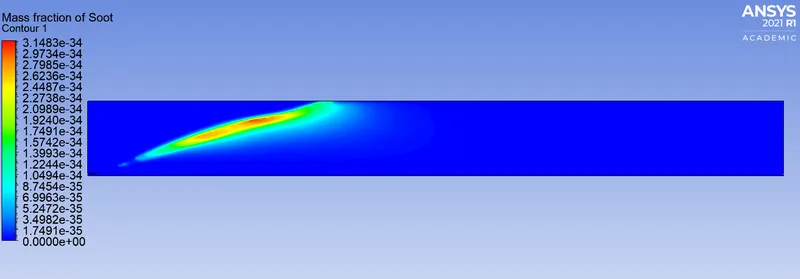
12) Mass Fraction of Soot
Case 3 - Oxygen 20%
1) Residual
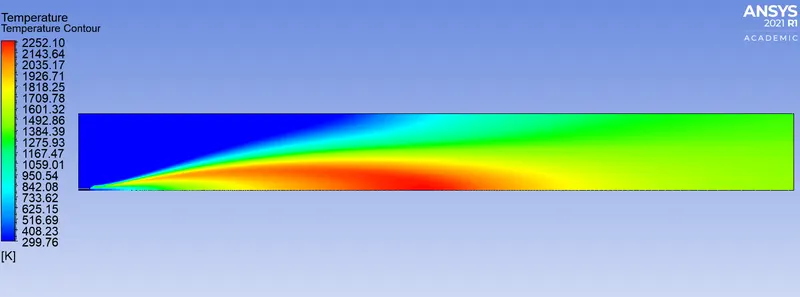
2) Temperature Contour
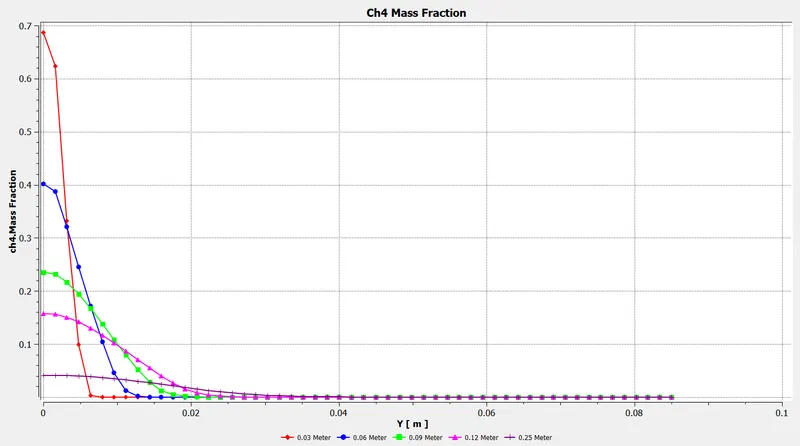
3) Graph of CH4
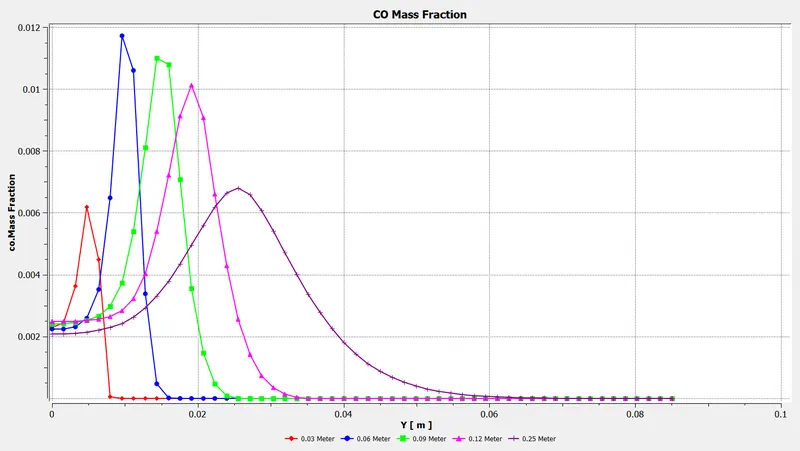
4) Graph of CO
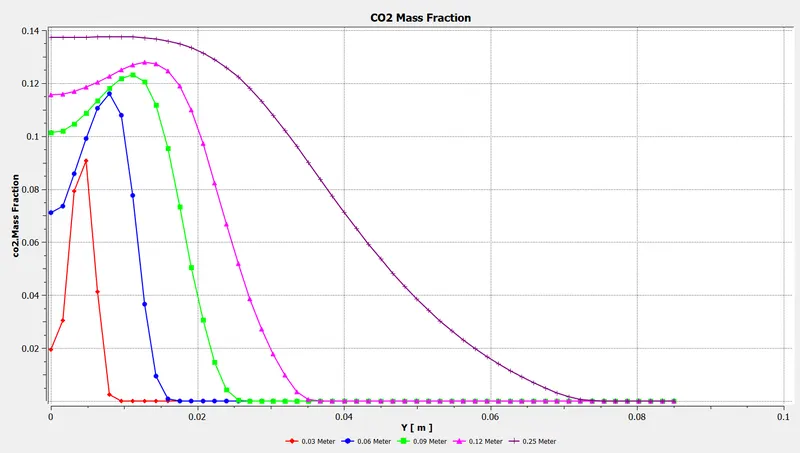
5) Graph of CO2
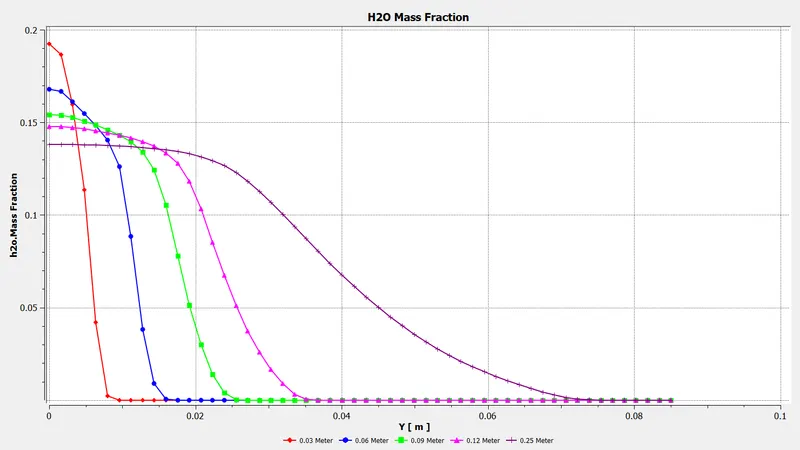
6) Graph of H2O
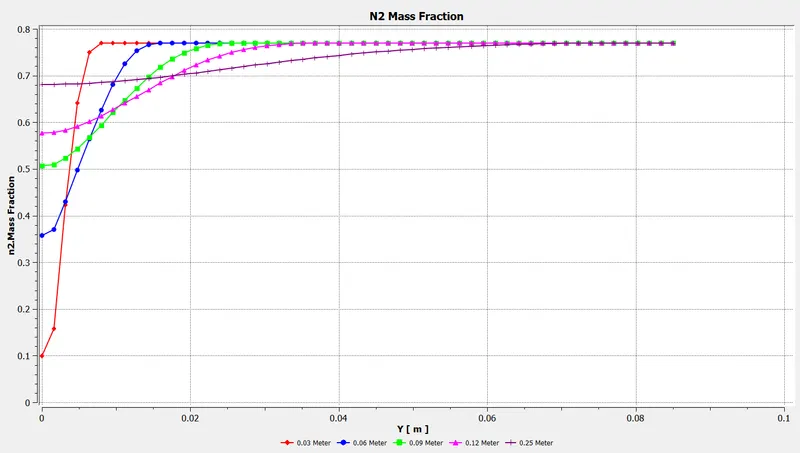
7) Graph of N2
8) Graph of O2
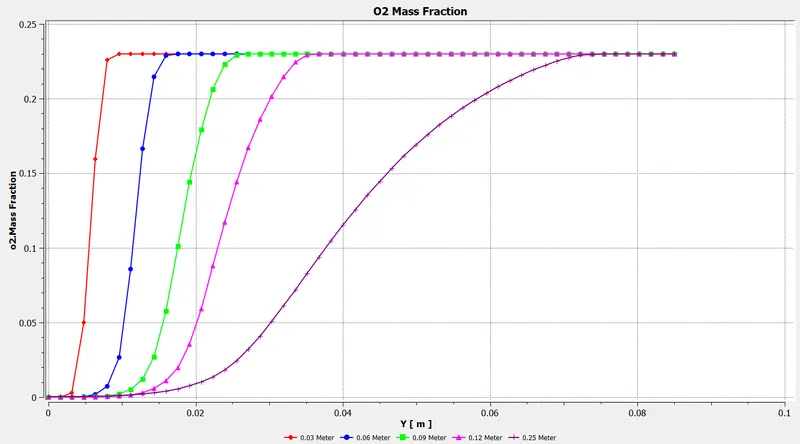
9) Graph of NOx
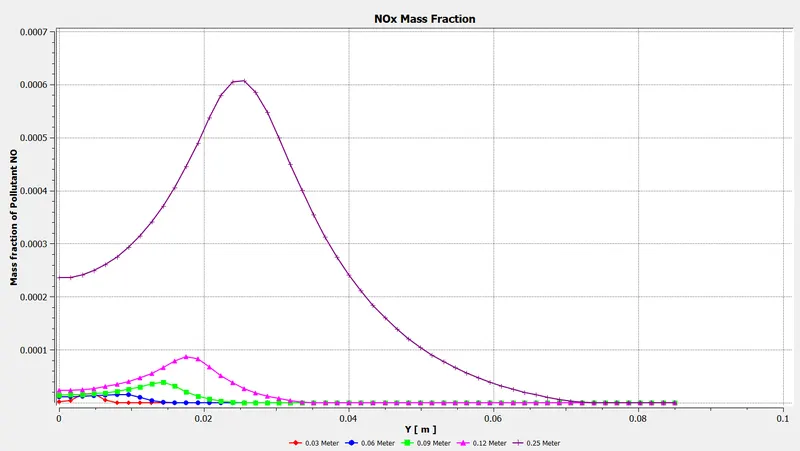
10) Graph of Soot
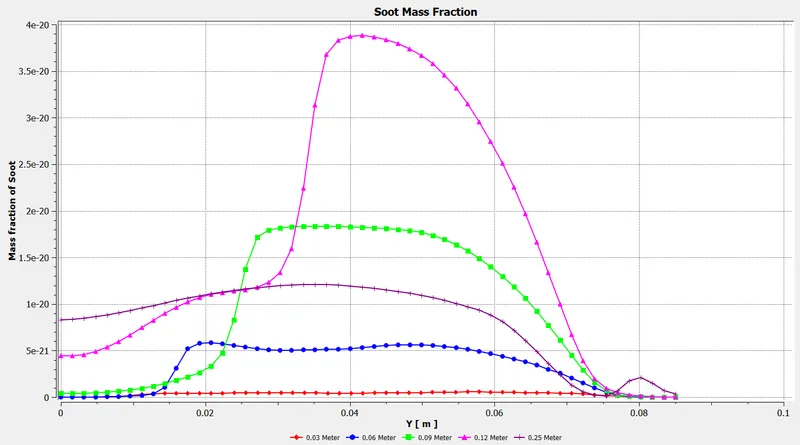
11) Mass Fraction of NOx
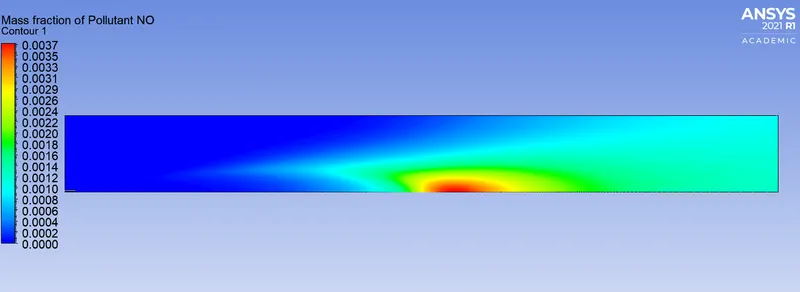
12) Mass Fraction of Soot
Case 4 - Oxygen 30%
1) Residual
2) Temperature Contour'
3) Mass Fraction of CH4
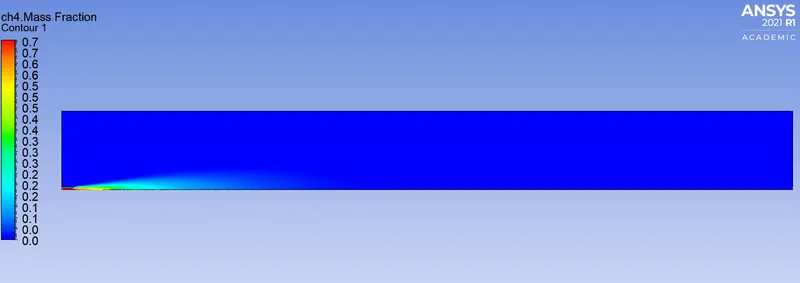
4) Mass Fraction of CO
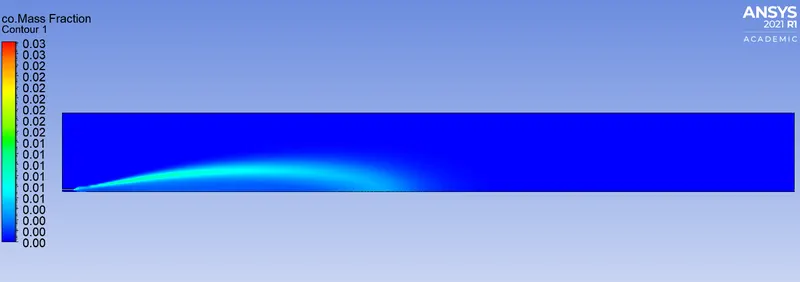
5) Mass Fraction of CO2
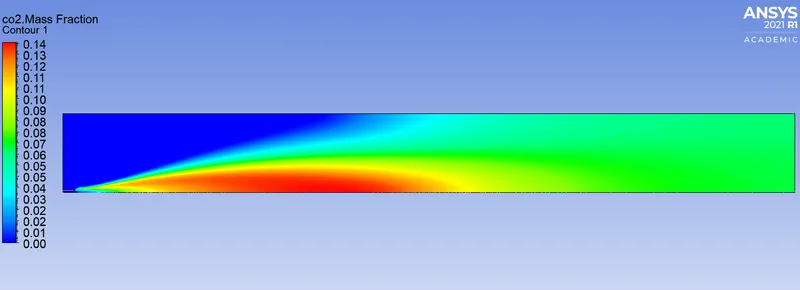
6) Mass Fraction of H2O
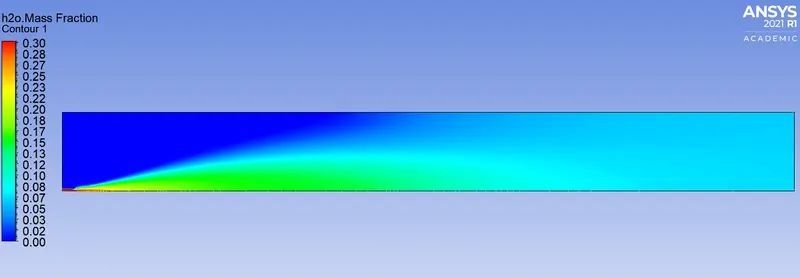
7) Mass Fraction of N2
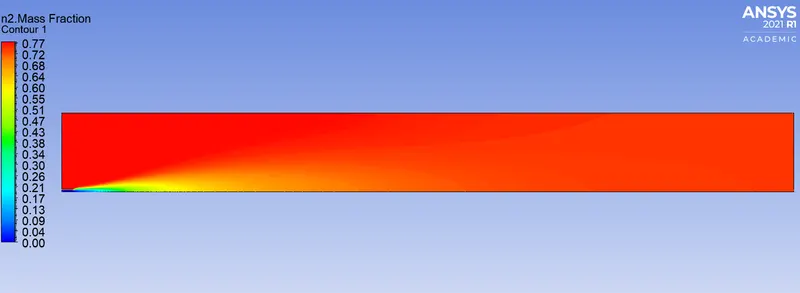
8) Mass Fraction of O2
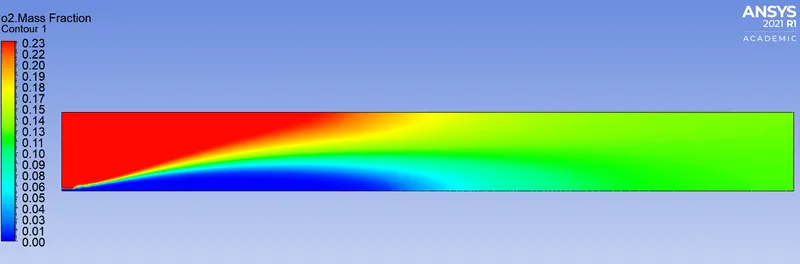
9) Mass Fraction of NOx
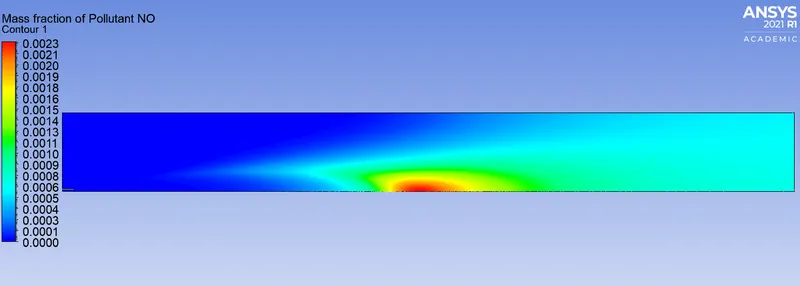
10) Mass Fraction of Soot
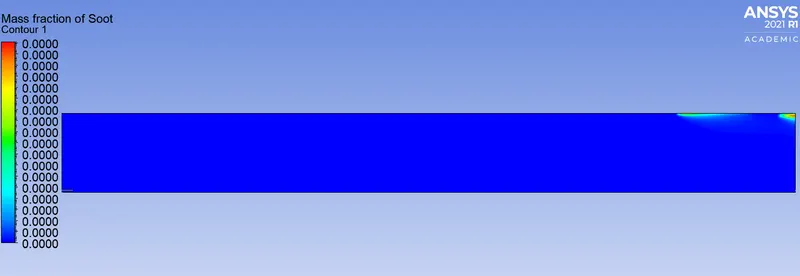
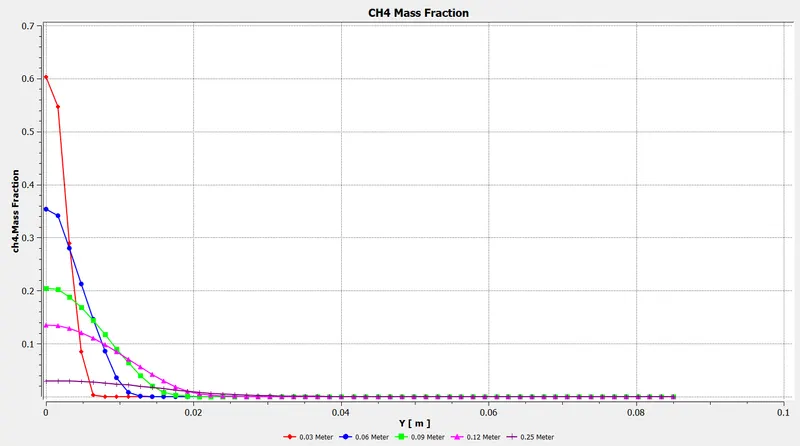
11) Graph of CH4
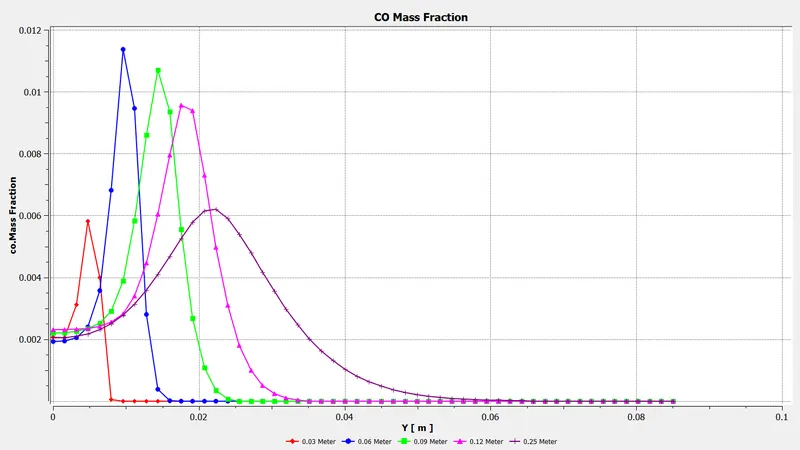
12) Graph of CO
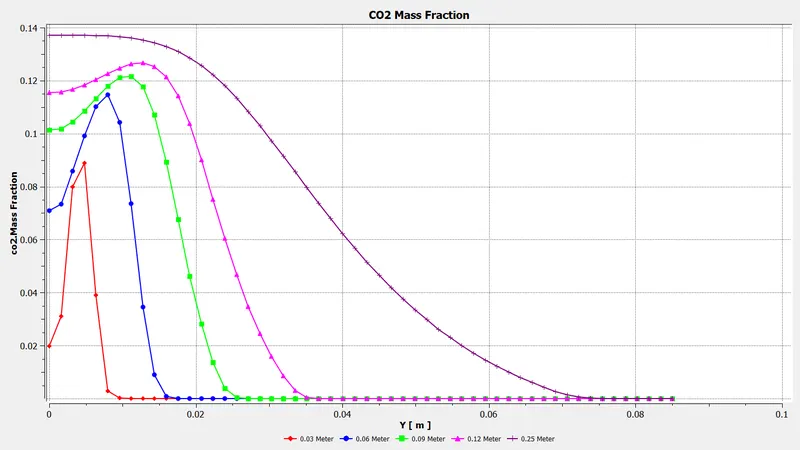
13) Graph of CO2
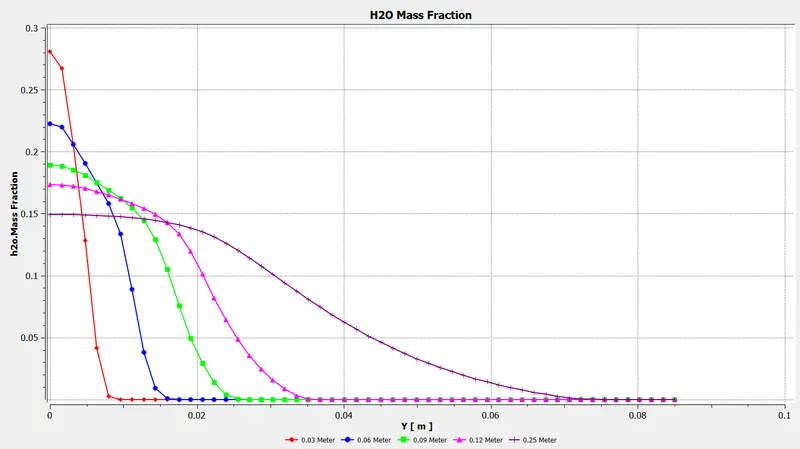
14) Graph of H2O
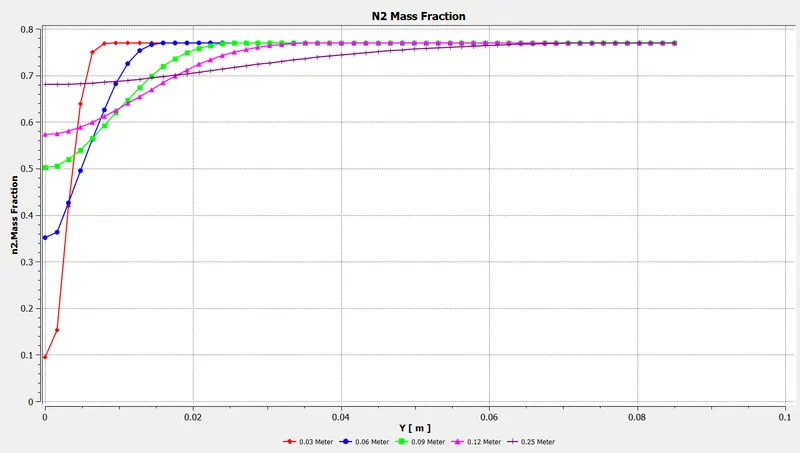
15) Graph of N2
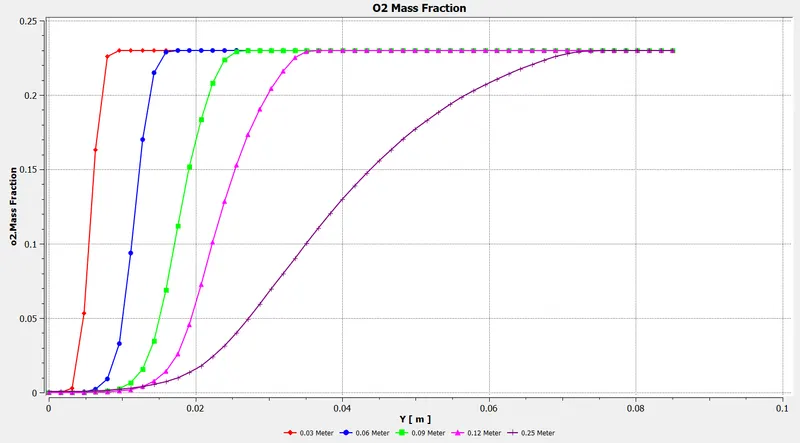
16) Graph of O2
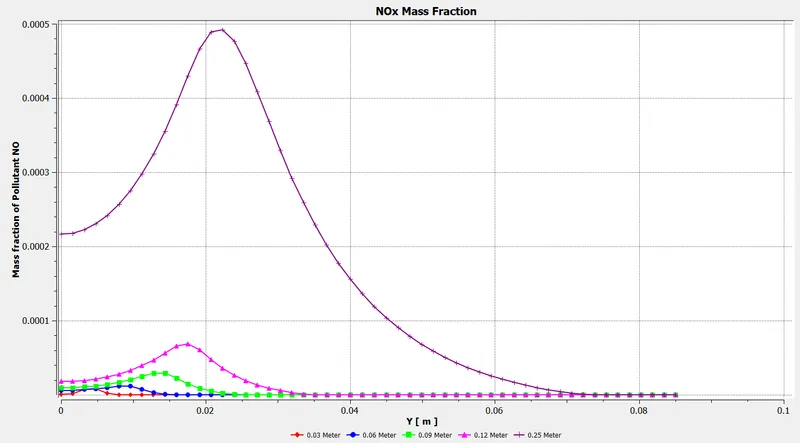
17) Graph of NOx
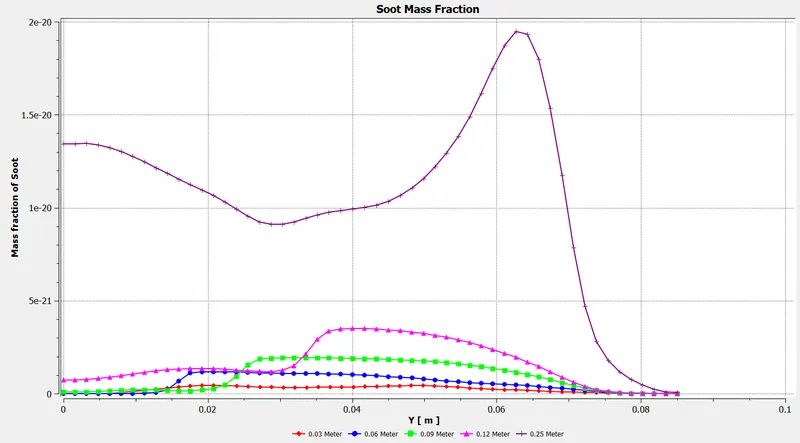
18) Graph of Soot
Conclusion:
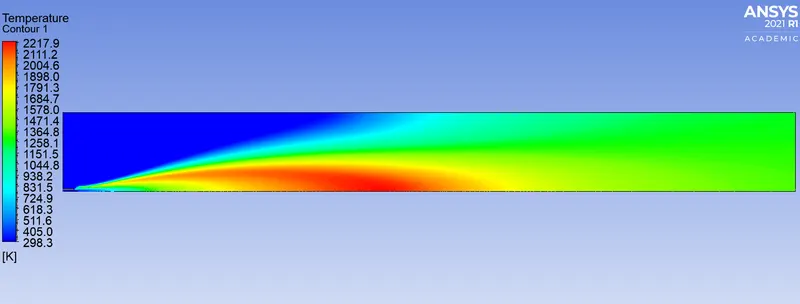
- In baseline mesh setup in which the whole amount of CH4 is present for as the fuel the amount of soot and NOx is greater as compared to other cases. Also the maximum temperature is about 2300 K.
- In next cases where the water is added with fuel in respect of 5% to 30% there is reduction of NOx by certain amount. For case 1 the reduction of NOx is about 15.78%. For case 2 same reduction of NOx is 28.94%. For case 3 the NOx reduction is 52.64% whereas for case 4 the NOx reduction is about 71.05%. Hence adding the water with fuel is considerably decreasing the NOx emissions from the exhaust products.
- Similar to NOx, it can be seen that the mass fraction of CO2 is also decreasing as water percentage is increasing. The Mass fraction of N2 is almost constant for all the cases which means the flame instability for the burner is almost constant for all the cases of combustion.
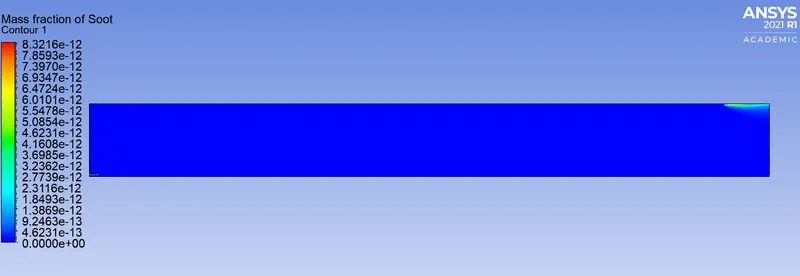
- In case of soot formation, it can be seen that, mass fraction of soot is decreasing for case 1 and 2 but for case 3 and 4 it has increased. After checking the Mass fraction of soot contour for all the cases, it is evident that soot formation from case 1 to 4 is unbalanced but the amount of soot formation is significantly lowered for case 3 and 4. It is seen that from case 3 and 4 contour of mass fraction of soot, the formation of soot is nearer toward the outlet of burner which is common practice of soot to deposited at the outlet.
- From the whole simulation it can be concluded that providing water with fuel will reduce the harmful exhaust emission such as NOx and Soot.