Week 10 - Simulating Combustion of Natural Gas.
Objective:
This challenge has two parts which are as follows:
Part 1:
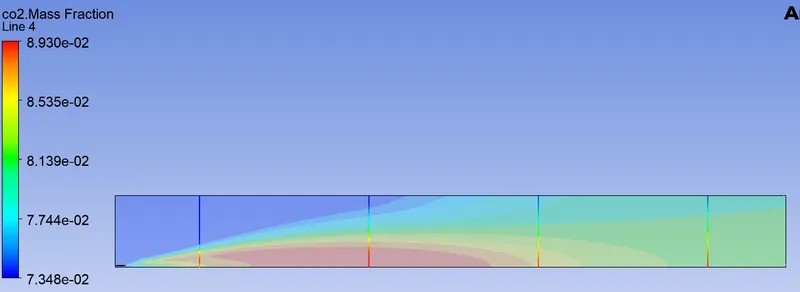
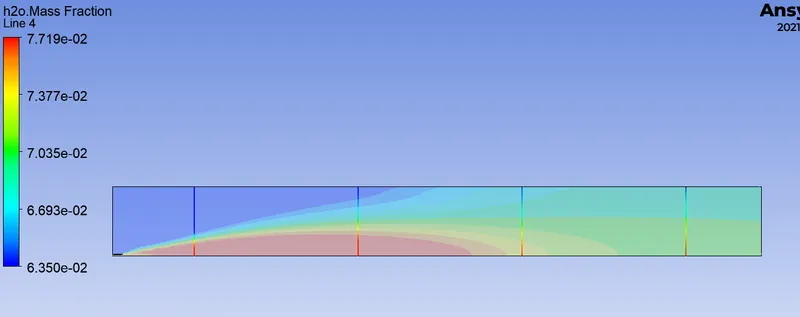
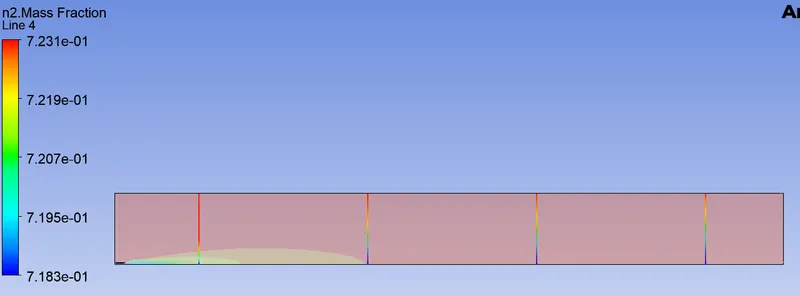
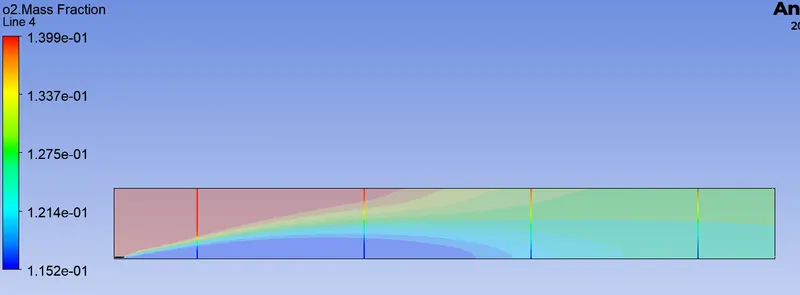
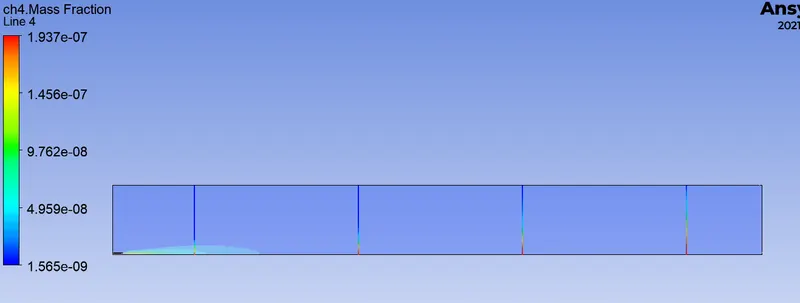
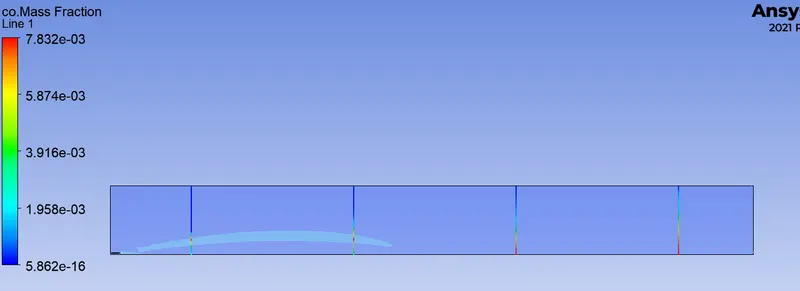
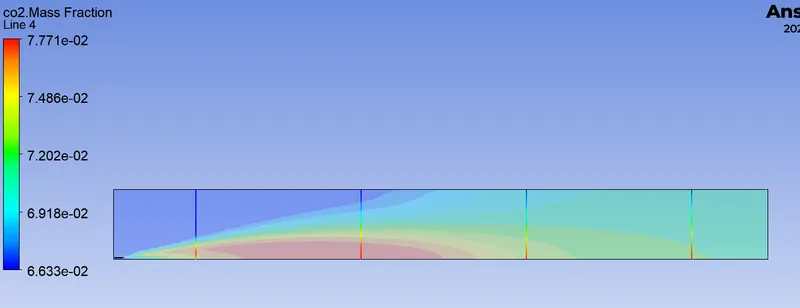
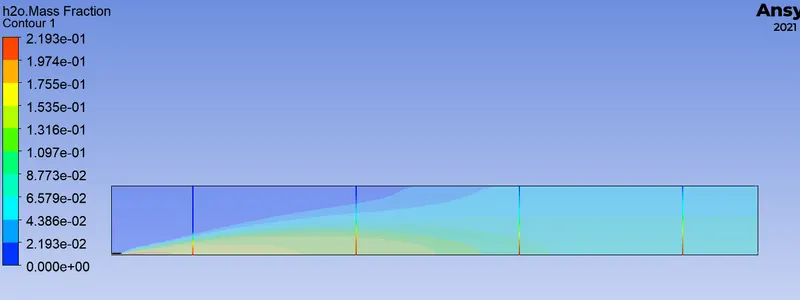
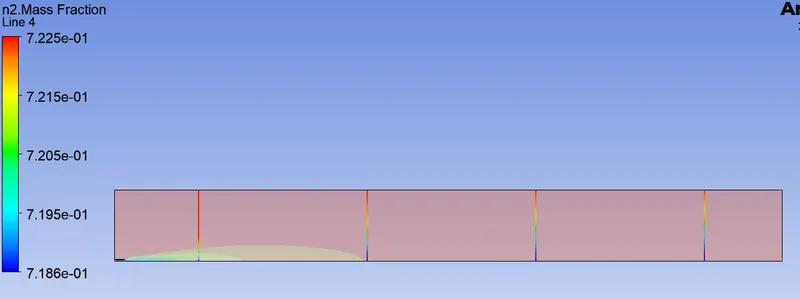
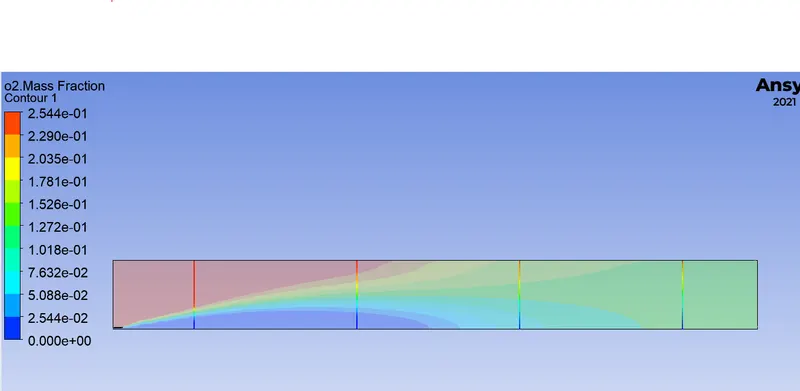
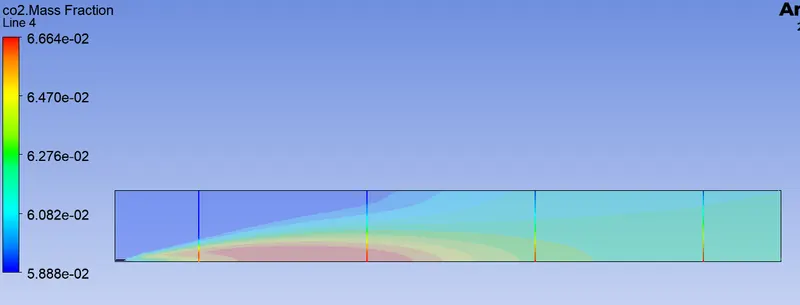
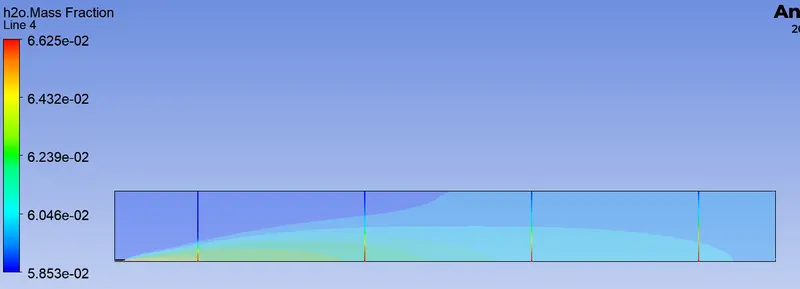
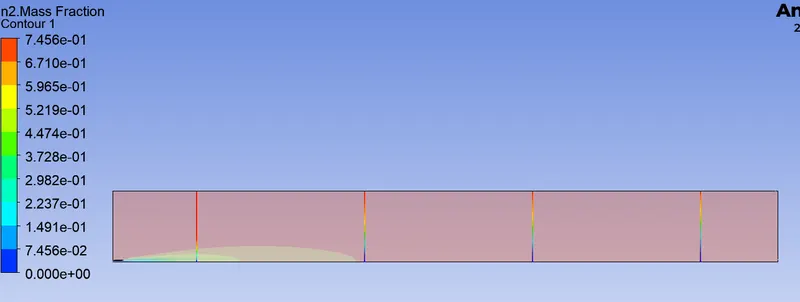
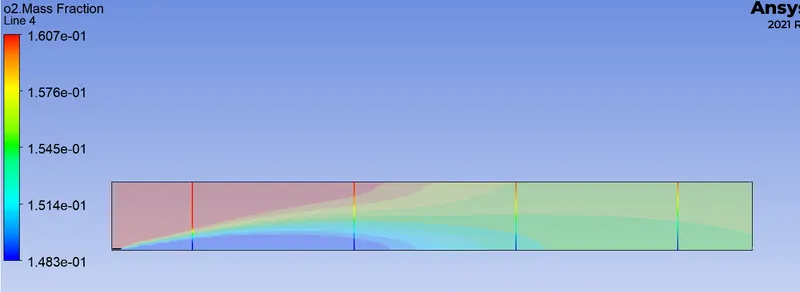
Perform a combustion simulation on the combustor model and plot the variation of the mass fraction of the different species’ in the simulation using line probes at different locations of the combustor. You need to plot for CO2, H2O, CH4, N2, O2, NOx emissions & Soot formation.
Part 2:
As you must have observed from the above simulation, the Nox and soot is getting formed at the outlet of the combustor. Such formation has harmful effects on the environment and humans. The stringent government norms also demand the least formation of Nox and soot and to satisfy those requirements, you need to check the effect of adding the water in the fuel.
In this part, you need to add the water content in the fuel from 5% to 30% by mole and observe the effect of it on the results. It is necessary to provide line plots and contours to prove your claim.
Answer:
Combustion is one of the most important processes in engineering, which involves turbulent fluid flow, heat transfer, chemical reaction, radiative heat transfer and other complicated physical and chemical processes.
Combustion processes are governed by basic transport equations for fluid flow and heat transfer with additional models for combustion chemistry, radiative heat transfer and other important sub-processes.
Chemical Kinetics:
It is also called as reaction kinetics. Chemical kinetics is the branch of physical chemistry that deals with researching the rates of chemical reaction. It is also contrasted with thermodynamics, which deals with the direction in which a process occurs but in itself nothing about its rate. Chemical kinetics includes investigations of how experimental conditions influence the speed of a chemical reaction and yield information about the reaction's mechanism and transition states. as well as the construction of mathematical models that also can describe the characteristics of a chemical reaction.
Chemical Reaction Model:
These models are used to transform physical knowledge into a mathematical formulation that can be utilized in computational simulation of practical problems in chemical engineering. Computer simulation provides the flexibility to study chemical processes under a wide range of conditions. Modeling a chemical reaction involves solving conservation equations, diffusion term & reaction source term for each component species.
Eddy - Dissipation Model:
For this simulation, Eddy - Dissipation model will be used for chemical reaction model. It is a turbulent-chemistry reaction model. Most fuels are fast burning & the overall rate of reaction is controlled by turbulence mixing.
In the premixed flames, the turbulence slowly mixes cold reactants and hot products into the reaction zones where the reaction occurs rapidly, while in the non-premixed flames, turbulence slowly mixes the fuel & oxidizer into the reaction zones where they burn quickly. In the premixed flames, the combustion is saud to be mixing-limited, and the complex & often unknown chemical kinetics can be safely neglected.
In Eddy-Dissipation Model, the chemical reaction is governed by large-eddy mixing time scale. Combustion initiates whenever there is turbulence present in the flow. It does not need an ignition source to initiate the combustion. This model is suitable for the non-premixed combustion. In premixed combustion the reactant is assumed to burn at the moment it enters the computation model, which is a shortcoming of this model as in practice the reactant needs some time to get to the ignition temperature to initiate the combustion.
Applications:
Typical engineering applications include internal combustion engines, power station combustors, aeroengines, gas turbine combustors, boilers, furnaces, and much other combustion equipment.
Purpose of carrying out Combustion Simulation:
It is important to be able to predict the flow, temperatures, resulting species concentrations and emissions from various combustion systems for the design and improvement of combustion equipment, particularly with the current concerns about CO2 and other emission levels and their effects on the environment.
Main types of Combustion Process:
- Gaseous Fuel Combustion
- Liquid Fuel Combustion
- Spray Combustion
- Solid Fuel Combustion
- Pulverised Fuel Combustion
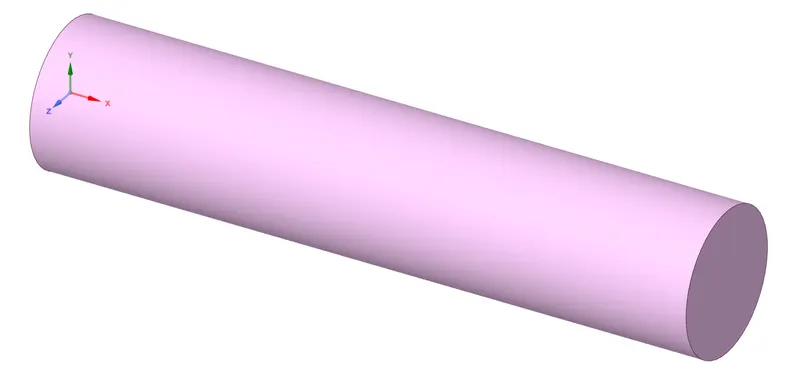
Preparing model for the simulation:
Input
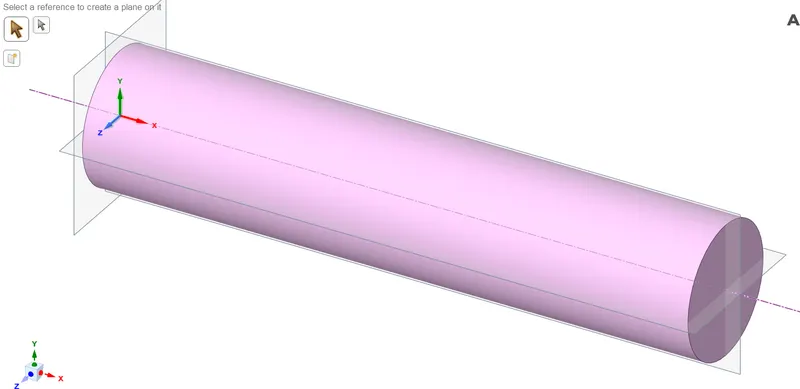
Creating Datum Planes
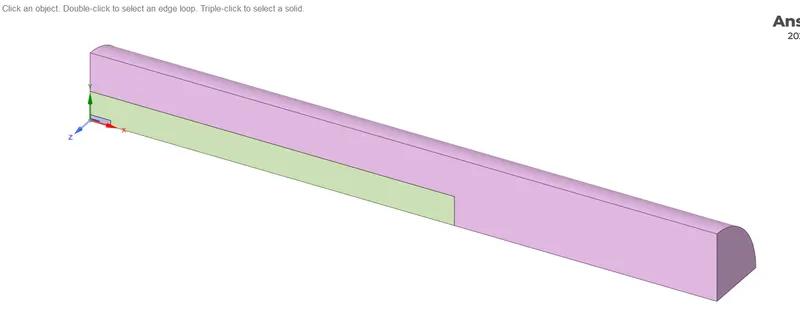
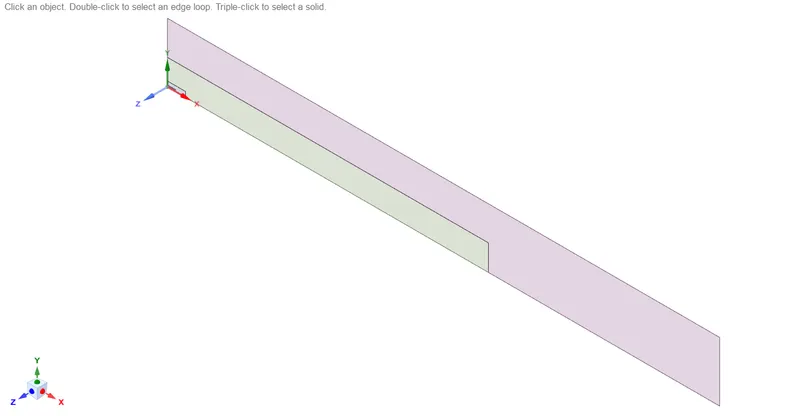
splitting geometry twice using 2 difference planes to keep 1/4th geometry
copying faces & pasting into new part
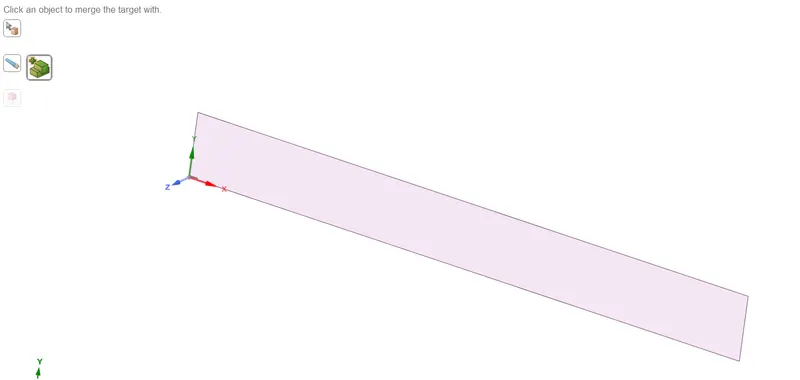
merging all three faces to create one single face which will be use for simulation.
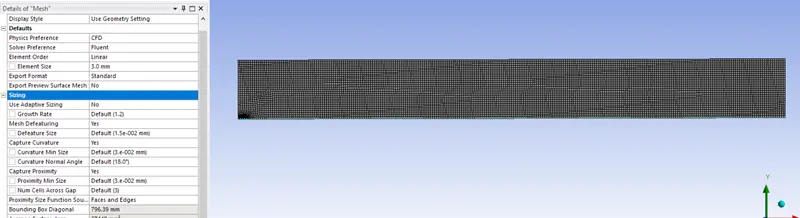
Mesh
Mesh settings
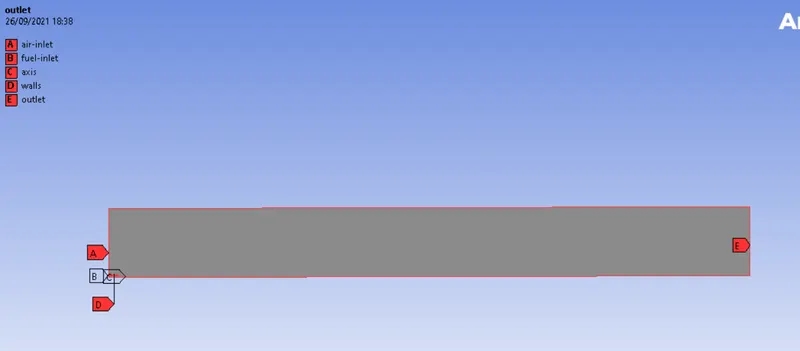
Named selection
Simulation Setup
Steps of the setup will remain same for all simulation. Following steps are show from the methan-air-water case
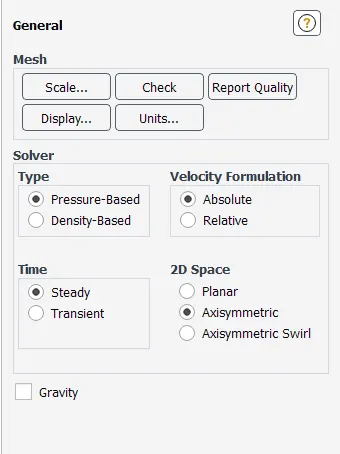
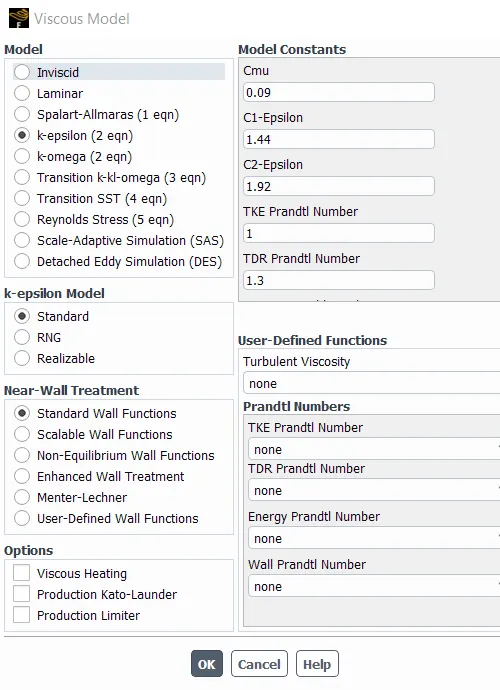
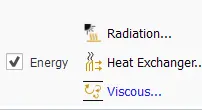
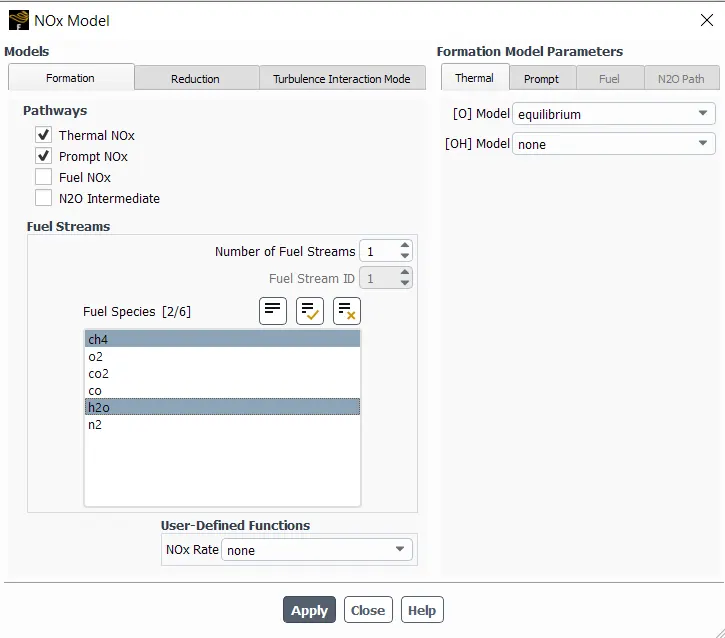
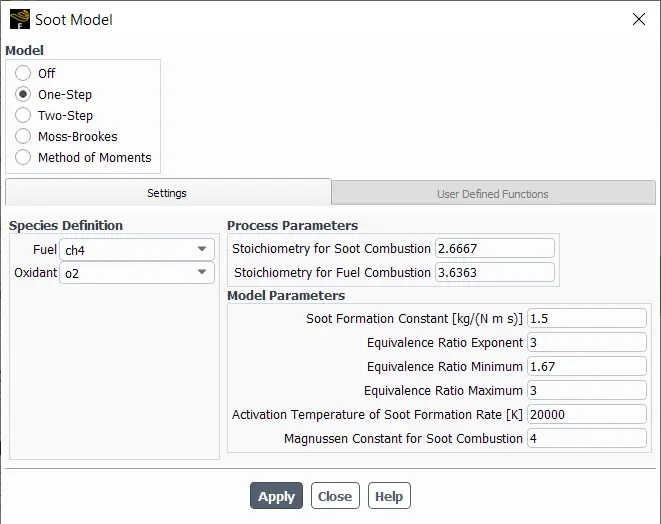
Species Model settings
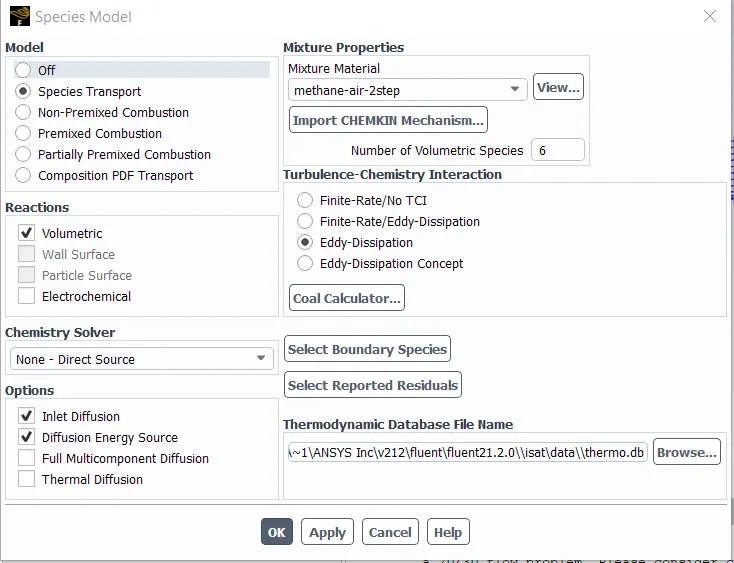
Model - Species Transport - Because we are solving here Species transport equations here.
Turbulence - Chemistry Interaction: Eddy - Dissipation
- The eddy dissipation model uses the rate of dissipation of eddies containing reactants and products to determine the reaction rates. The eddy dissipation method in its purest form computes reaction rates, based on rates of turbulent mixing.
Boundary Conditions
- Air -inlet options
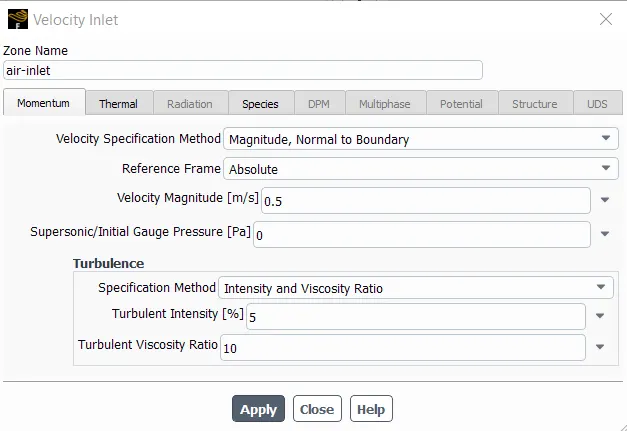
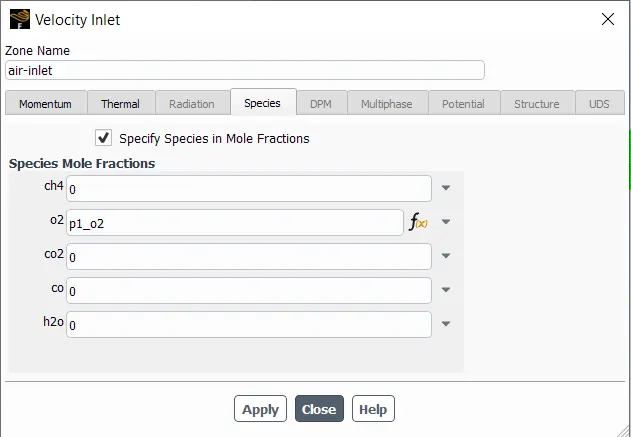
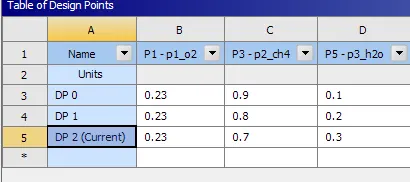
O2, methane (ch4) & water(h2o) has been defined as the mole factions which means the percentage of that respective species out of 100%. And parameters has been created for each species as shown in below image to carry outparametric study.
- fuel-inlet options
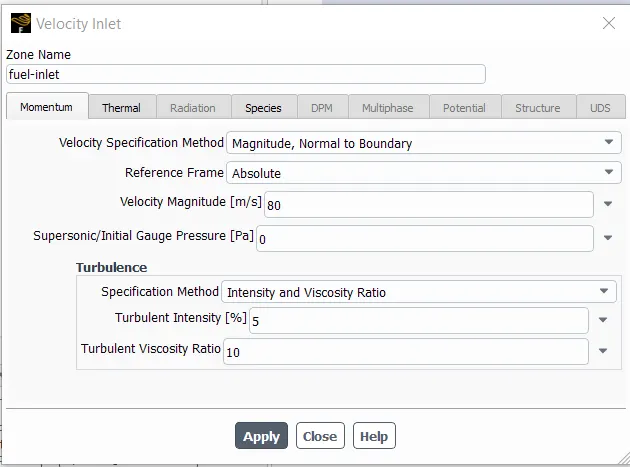
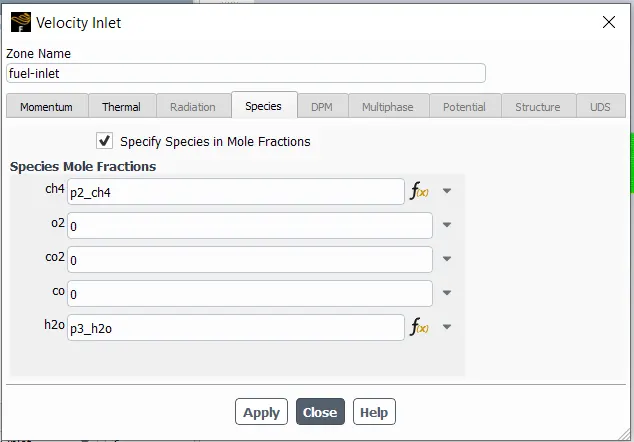
Initialization - Hybrid
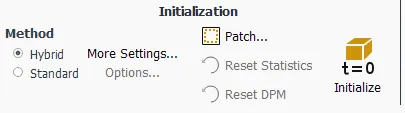
Post-processing setup
Contour Plot
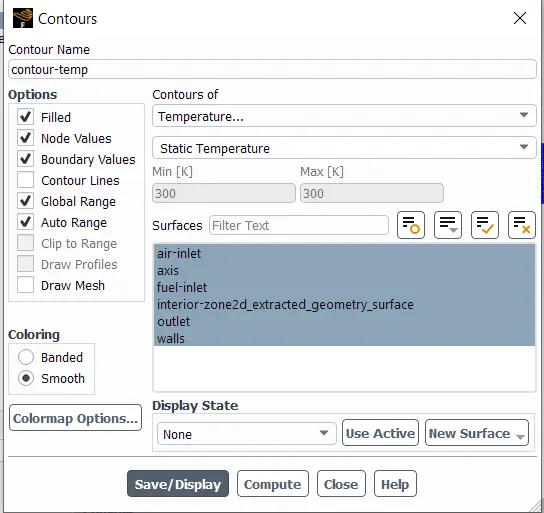
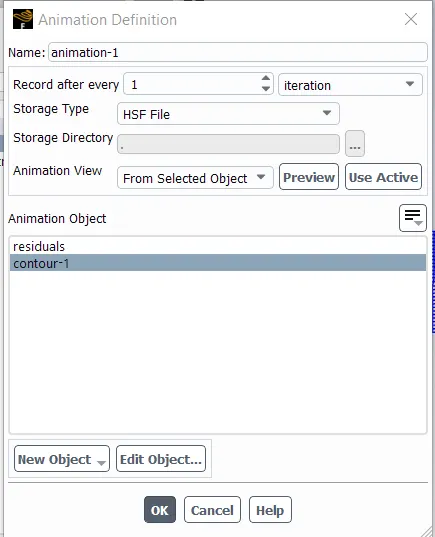
Animation
Output files
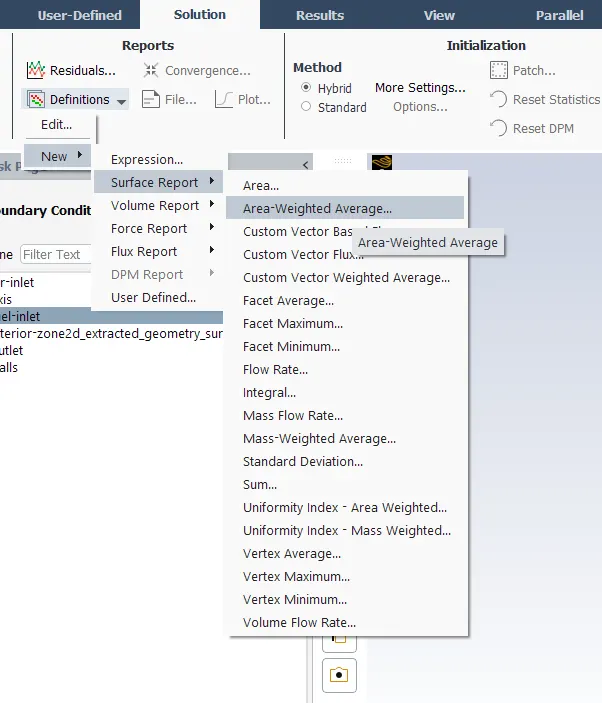
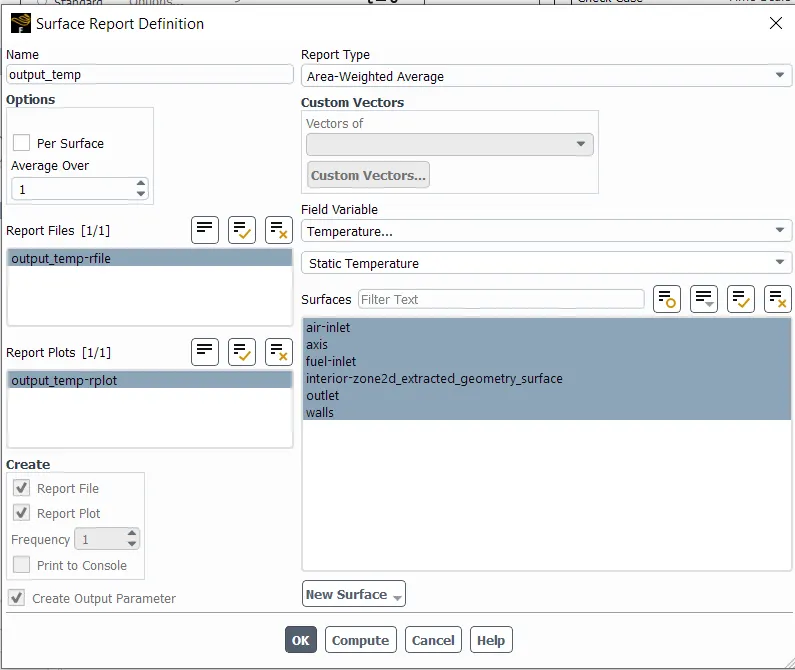
The area-weighted average report has been created for the temperature contour plot to save the temperature throughout the are for all design points in the parametric study which will be used to carry out post processing.
Parametric Study
Paramteric study has been carried out for the second case only in which the mass fraction of the o2 & ch4 needed to modify in each case.
Results:
Part 1 - air-methane
Residuals
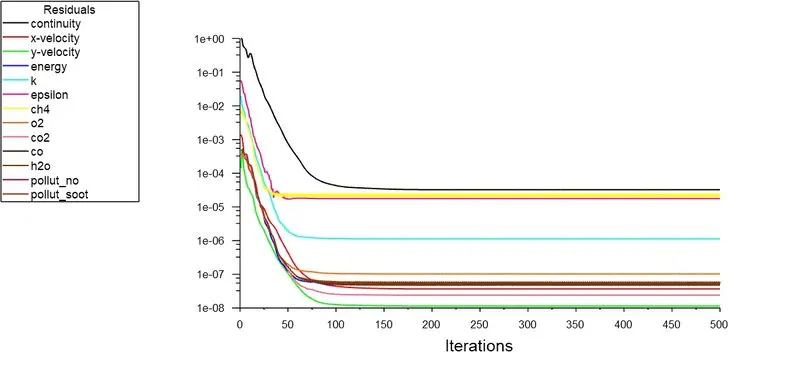
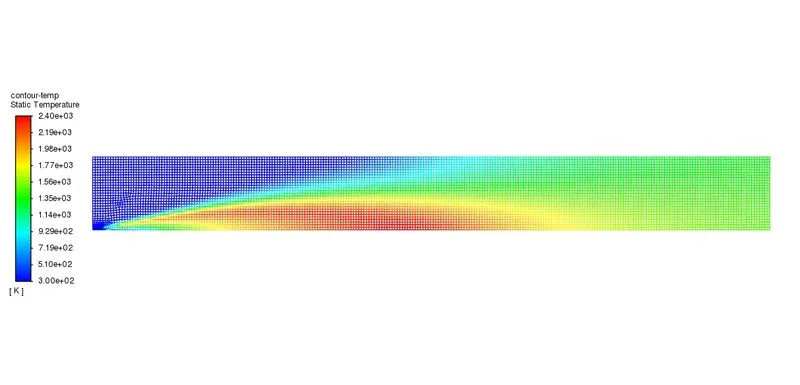
Temperature Contour
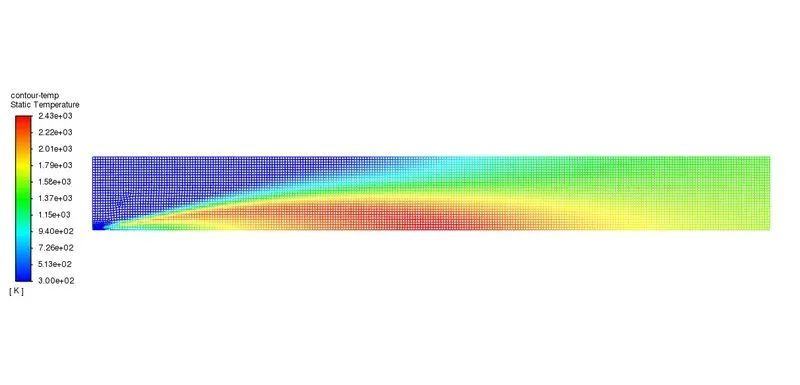
Animation link:
Line plot & Contour plot for each species
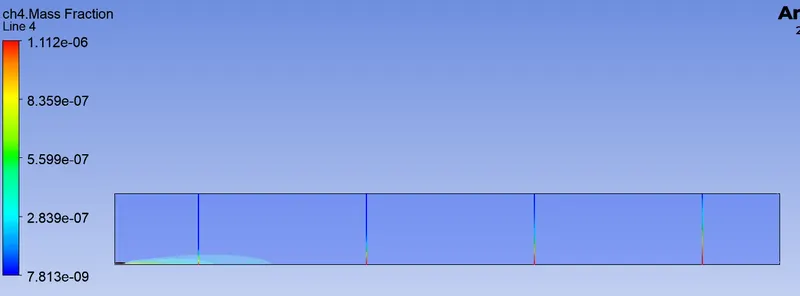
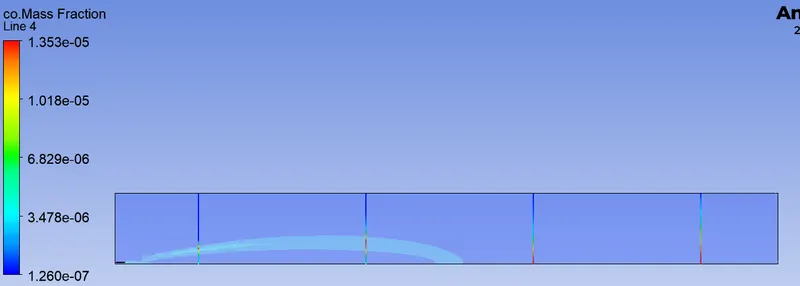
Part 2
Case 1:
Mass fraction values
ch4 - 0.9
o2 - 0.1
Residuals
Temperature Contour Plot
Animation Link:
Line plot & Contour plot for each species
Case 2:
Mass fraction values
ch4 - 0.8
o2 - 0.2
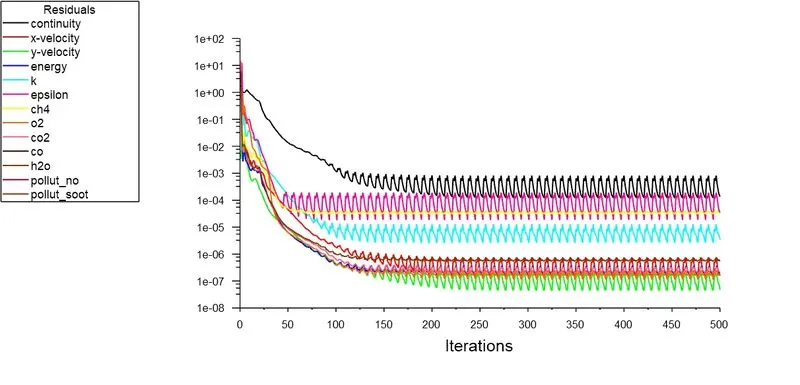
Residuals
Temperature Contour Plot
Animation Link:
Line plot & Contour plot for each species
Case 3:
Mass fraction values
ch4 - 0.7
o2 - 0.3
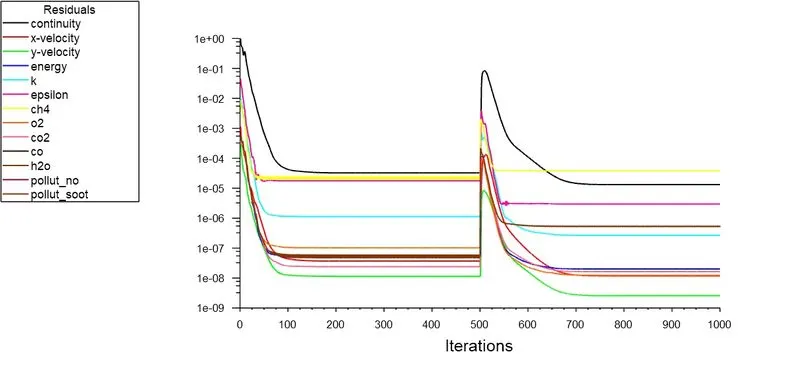
Residuals
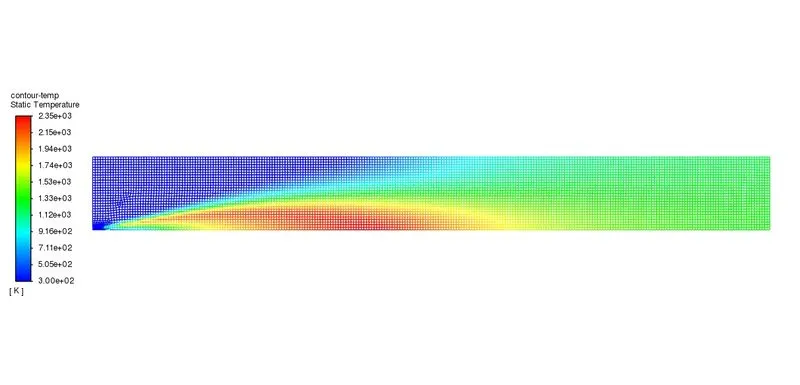
Temperature Contour Plot
Animation Link:
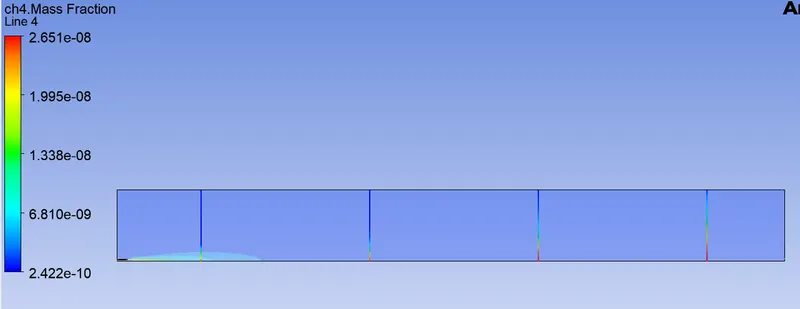
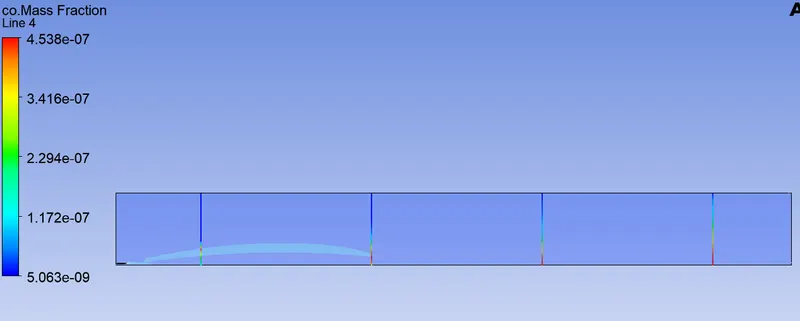
Line plot & Contour plot for each species
Results Table:
| Ratio (ch4:o2) | Mass Fraction | ||||
| Methane (ch4) | Oxygen (o2) | Water (h2o) | Pollutant NO | Soot | |
| 1 | 0.23 | 0 | 0.00181 | 0.1114 | |
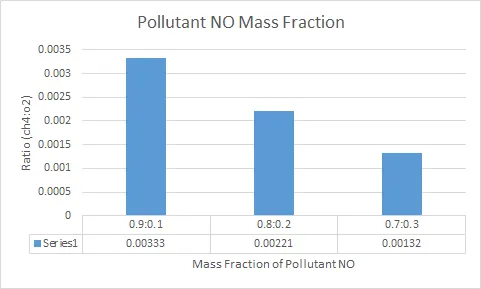
| 0.9:0.1 | 0.9 | 0.23 | 0.1 | 0.00333 | 0.0835 |
| 0.8:0.2 | 0.8 | 0.23 | 0.2 | 0.00221 | 0.0483 |
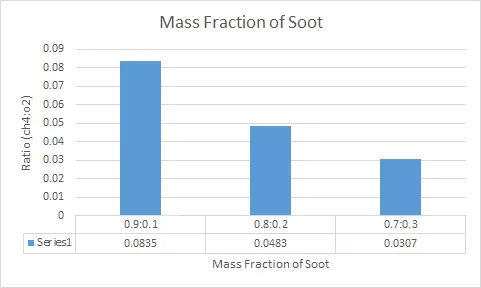
| 0.7:0.3 | 0.7 | 0.23 | 0.3 | 0.00132 | 0.0307 |
The values of both NO & soot has been decreasing with the increase in water percentage which can be see from the above table in the last three simulation results. The first simulation is for the air & Methane without water fraction in it. The objective of adding water fraction into the combustion chamber to resuce the pollutant species has been achieved.
By increasing water percentage from 10% to 30%, the amount of both species, NO & soot, has been decreased from 0.00333 to 0.0132 and 0.0835 to 0.0307 respectively.
The values of has been presented in the bar chart format as well which are as follows:
Graph 1: Mass Fraction of Pollutant NO with respect to Ratio of Methane:Water Mass Fraction
Graph 2: Mass Fraction of Soot with respect to Ratio of Methane:Water Mass Fraction