Week - 10 Hyperelastic Material Models
WEEK 10 CHALLENGE - HYPERELASTIC MATERIAL MODELS
AIM:
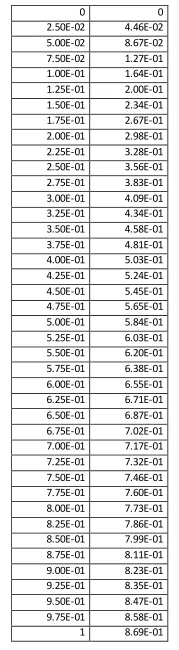
To calculate the Mooney Rivlin and Ogden material constants and compare the both using stress-strain data from a Dogbone specimen tensile test with 100 percent strain.
GIVEN:
PROCEDURE:
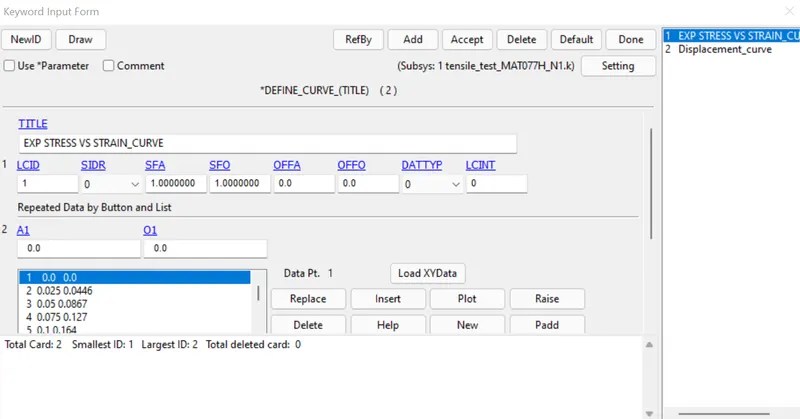
- Extract the given Engineering stress,strain data from image to excel and save it in .csv file to import to LS dyna.
- From the previous challenge we are using the same model with same control card except with some change to compare both Mooney Rivlin and Ogden material constants using stress-strain data from a Dogbone specimen tensile test with 100 percent strain.
Tensile Test Specimen:
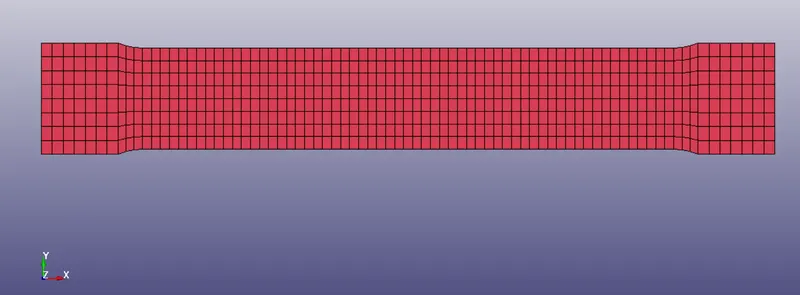
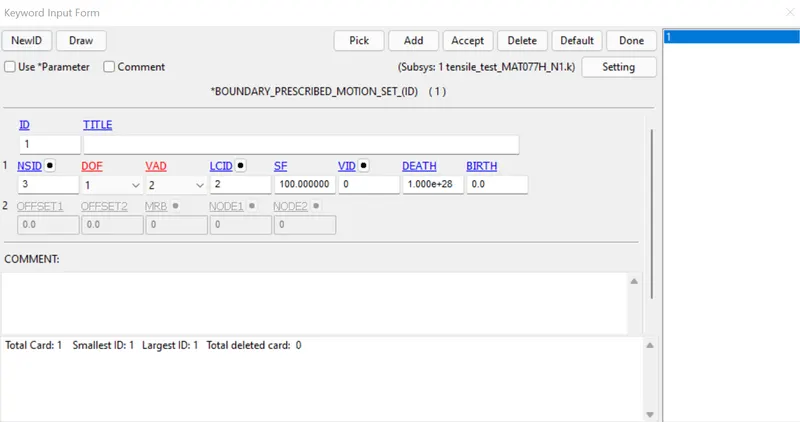
BOUNDARY CARD: Scale Factor:100 to get a 100% strain
CASE 1: MOONEY RIVLIN
MATERIAL CARD:
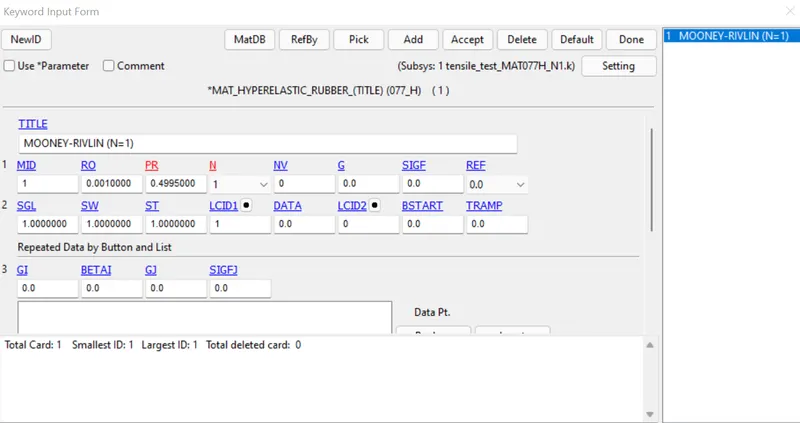
MAT_HYPERELASTIC_RUBBER(077_H)
DENSITY (RO)=0.001,POISSON RATIO (PR)=0.4995. These material has poisson's ratio of almost 0.5,if we keep it in 0.5 then the volumetric strain we get is zero which is incompressible,but the hyperelastic material is compressible with high strain rates.
N=1 WITH LOAD CURVE:
SECTION CARD:
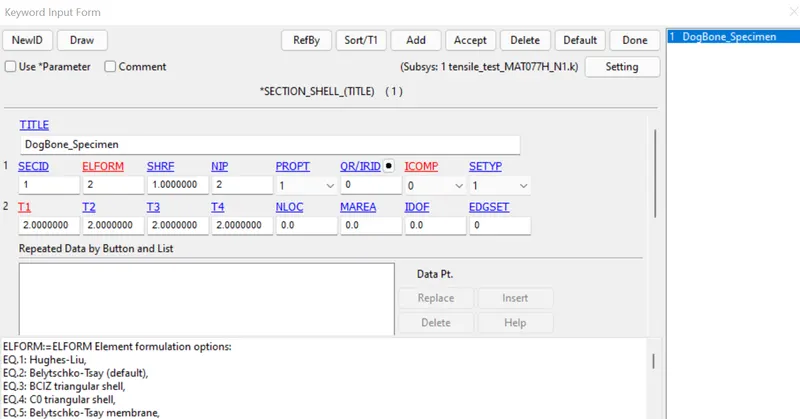
Assign the section Material to the part
Control card has been created with termination endtime as 1.0 and also created implicit Control card.
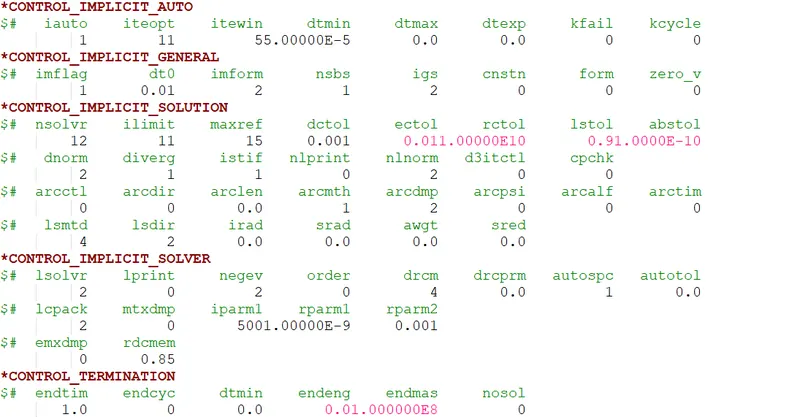
After run the Simulation we get the D3hsp file where we get the MOONEY CONSTANT value and True stress,strain.
Similarly run the same model by change N=2 and N=3 and get the Constant value.table are shown below:
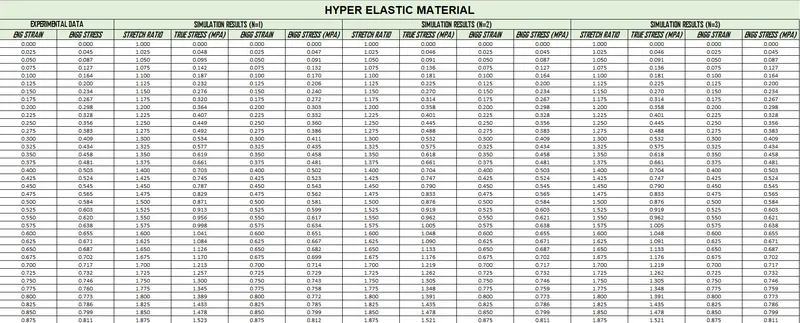
*Engg Strain = Stretch ratio - 1
*Engg Stress = True stress/(1+Engg Strain)
Plot the graph for the experimental data vs the Simulated results of N1,N2,N3.
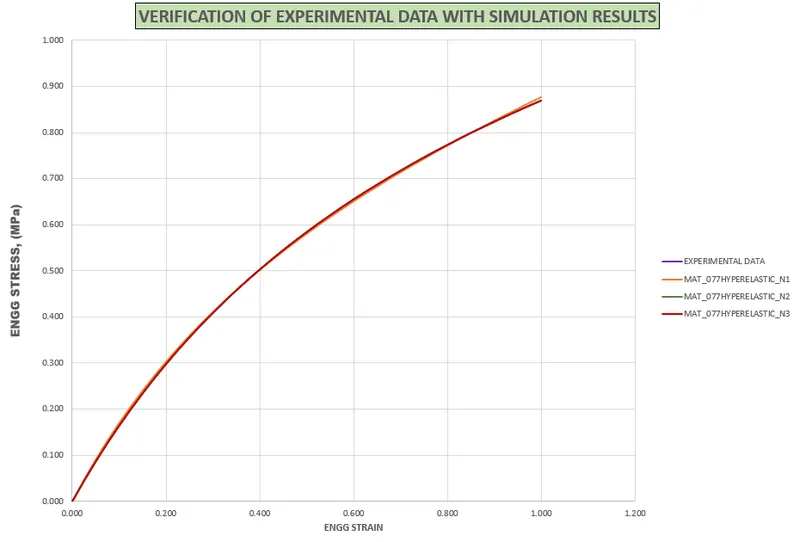
MOONEY CONSTANT value are:
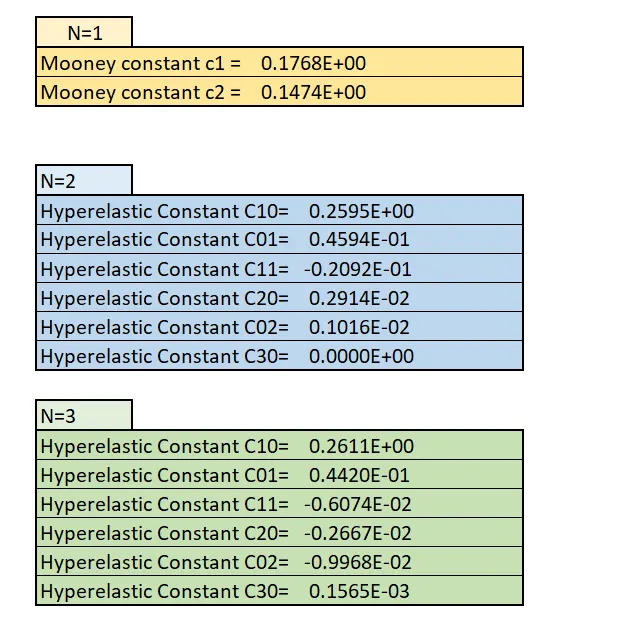
With the Constant value we are now change N=0 and apply the constant value in the Mat_077H card
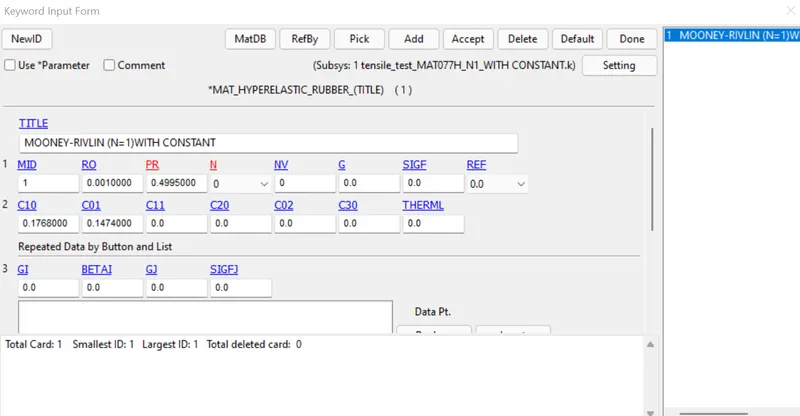
Similarly do the same for the other two card with N=2 and N=3 and run the simulation
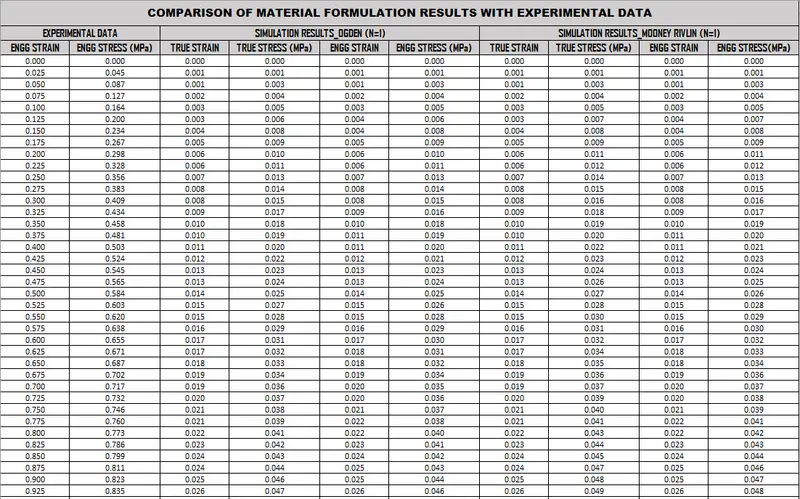
From the output we get the X stress and lower ipt X strain in the history element, Plot the graph and get the stress vs strain data.The data of stress vs strain we got from the three file are listed below:
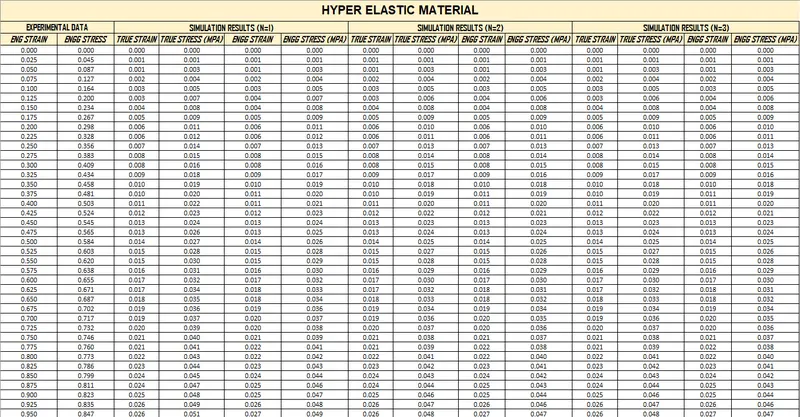
*Engg Strain = EXP(True Strain)-1
*Engg Stress = True stress/(1+Engg Strain)
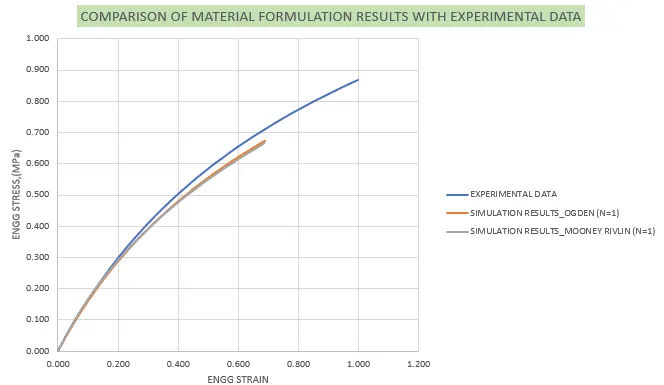
Plot the graph for the experimental data vs the Simulated results of N1,N2,N3 with constant.
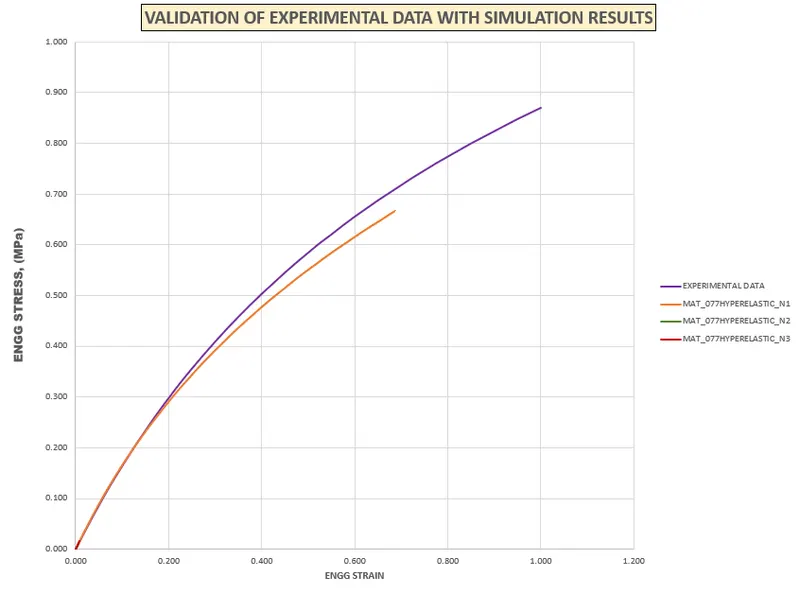
We can see there is small variation of the simulated validation curve with Experimental Data curve
CASE 2: OGDEN MATERIAL MODEL
All the cards are same as above except the material card.here we are using MAT_077O and the curve is defined.
MAT_OGDEN_RUBBER(077_O)
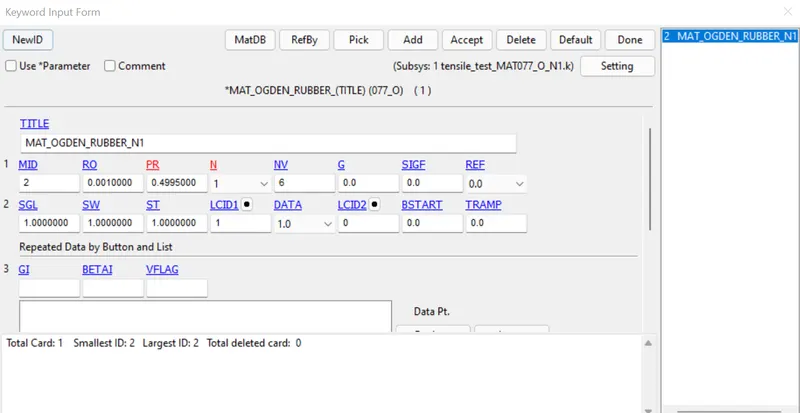 .
.
Similarly do the same for the other two card with N=2 and N=3 and run the simulation
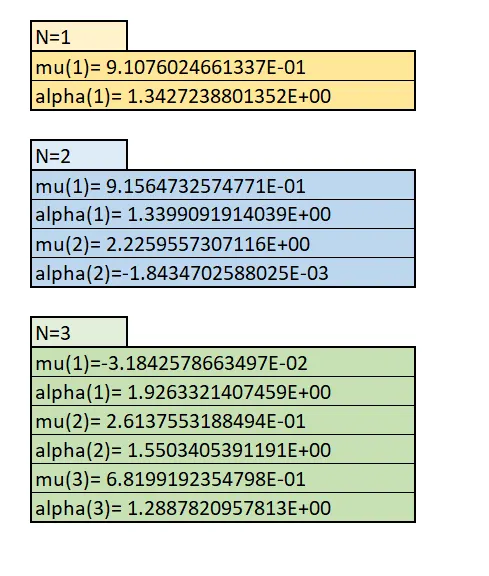
The constants are taken from the D3hsp file from where Stretch vaules are taken and compared with the Experimental Data.
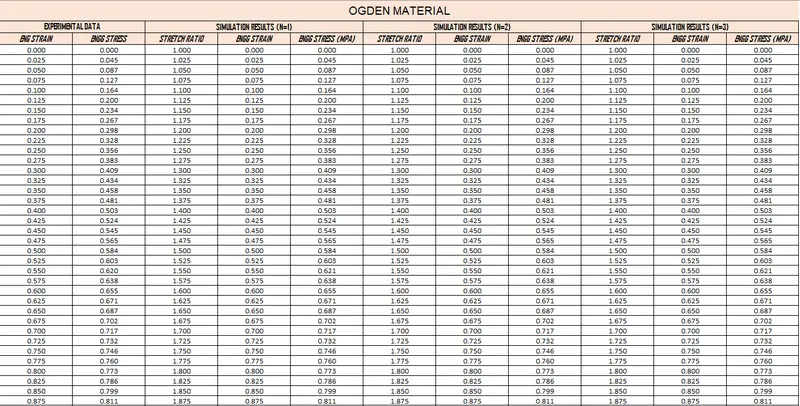
*Engg Strain = Stretch ratio - 1
*Engg Stress = True stress/(1+Engg Strain)
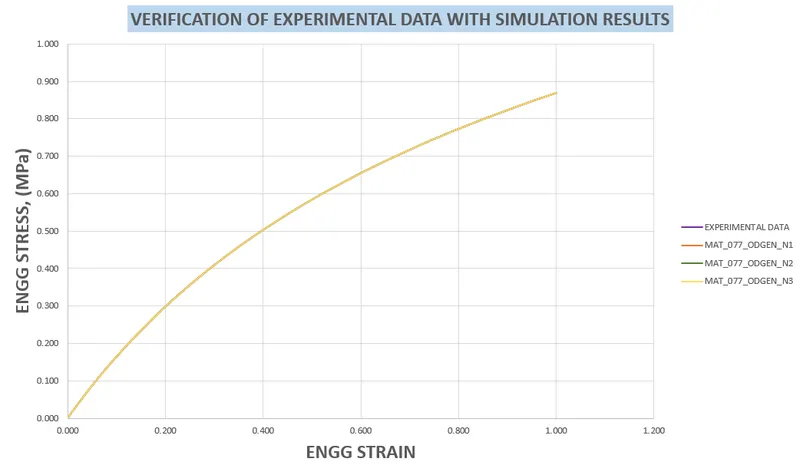
Plot the graph for the experimental data vs the Simulated results of N1,N2,N3.
The constants values are:
With the Constant value we are now change N=0 and apply the constant value in the Mat_077O card
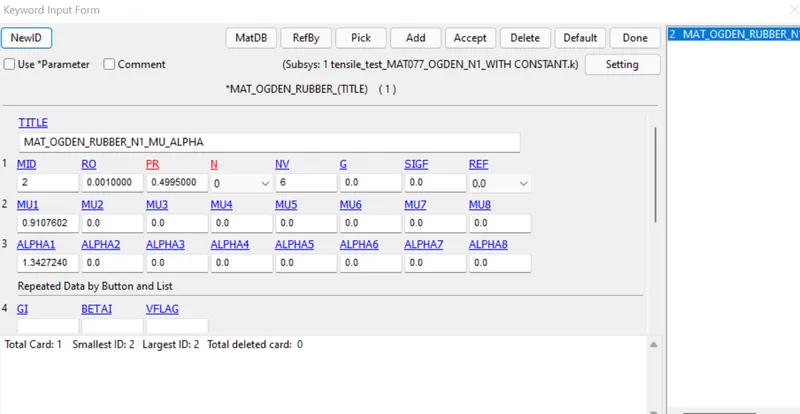
Similarly do the same for the other two card with N=2 and N=3 and run the simulation
From the output we get the X stress and lower ipt X strain in the history element, Plot the graph and get the stress vs strain data.The data of stress vs strain we got from the three file are listed below:
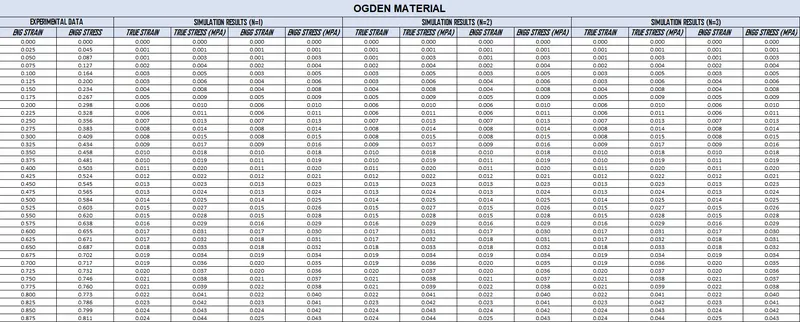
*Engg Strain = EXP(True Strain)-1
*Engg Stress = True stress/(1+Engg Strain)
Plot the graph for the experimental data vs the Simulated results of N1,N2,N3 with constant.
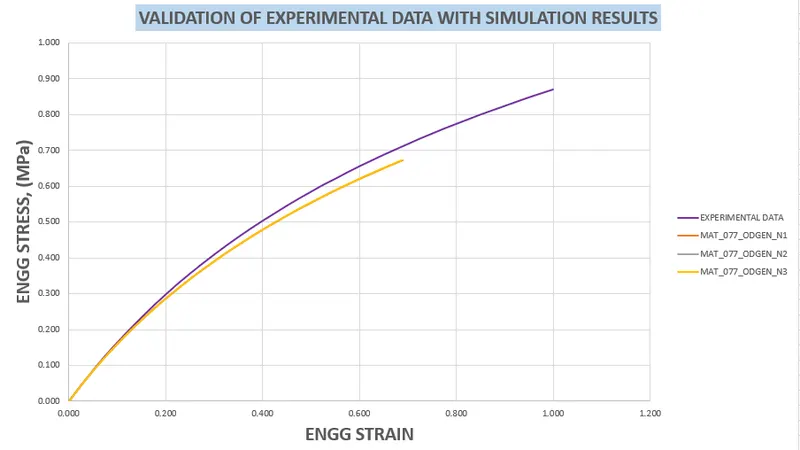
While comparing both the Material Mooney Rivlin and Ogden we are getting the same Stress,strain value with some small variations and it differ with the experimental Data.
OUTPUT OF SIMULATION:
ANIMATION OF X-STRESS IN MOONEY RIVLIN MATERIAL MODEL:
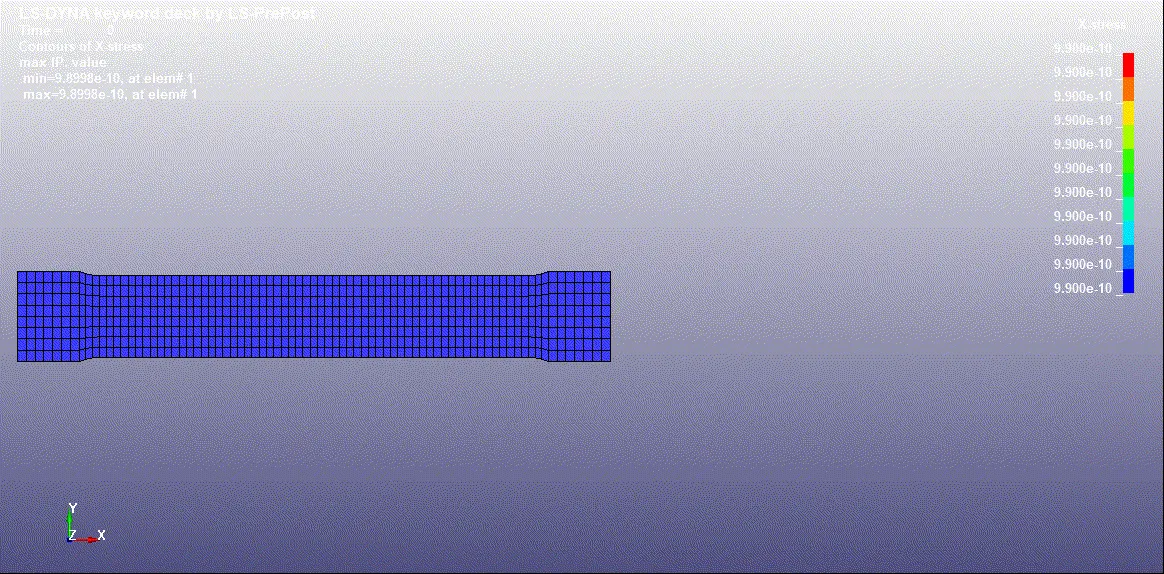
MAX STRESS : 1.21706MPa
ANIMATION OF LOWER IPT X-STRAIN IN MOONEY RIVLIN MATERIAL MODEL:
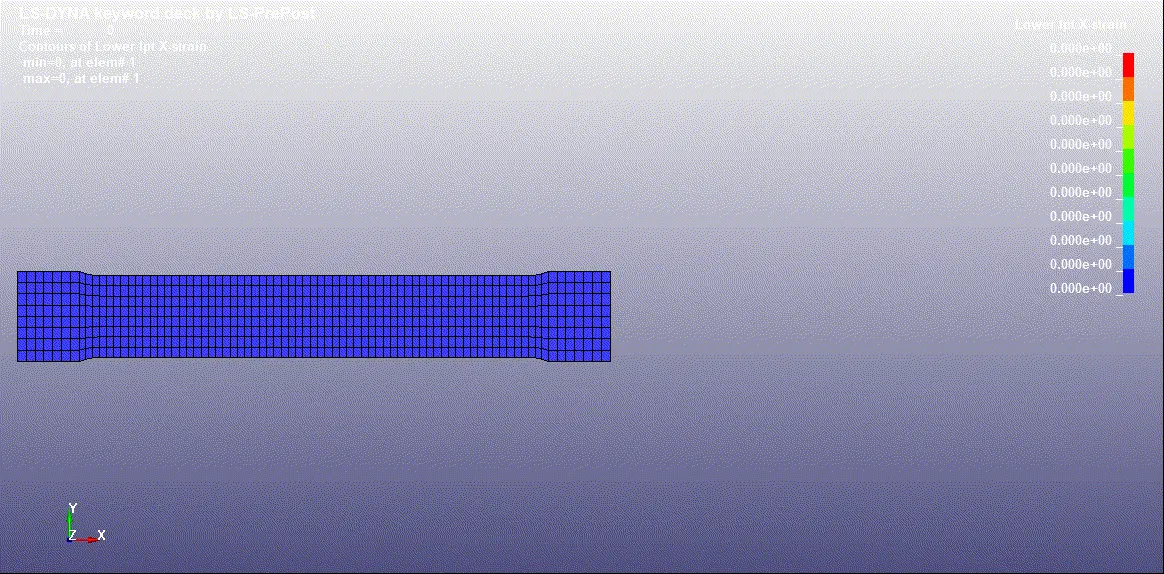
MAX STRAIN :0.555456
ANIMATION OF X-STRESS IN OGDEN MATERIAL MODEL:
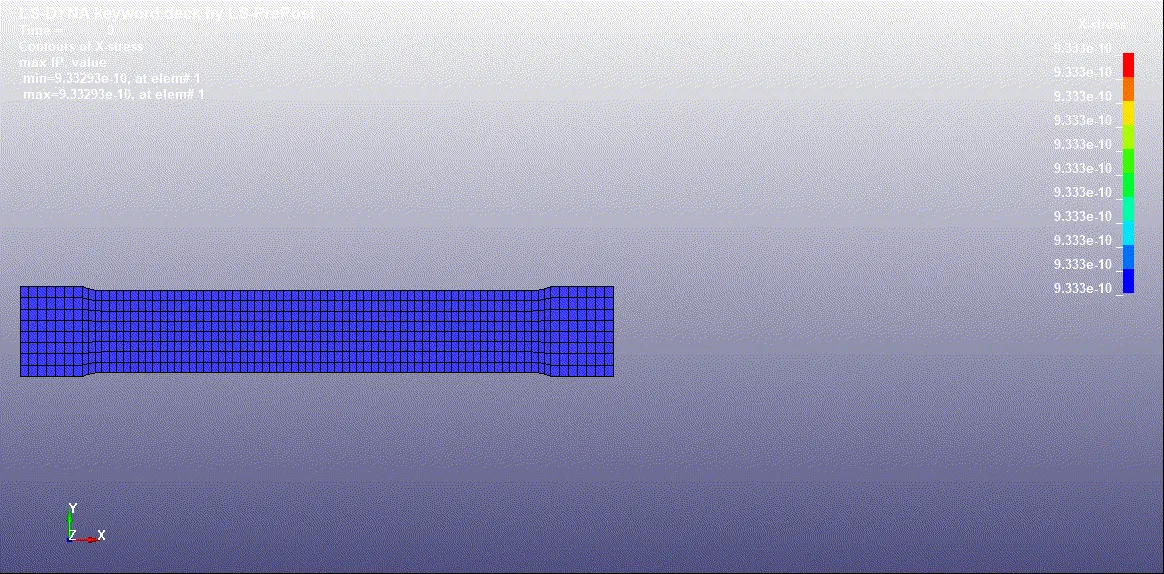
MAX STRESS : 1.22554MPa
ANIMATION OF LOWER IPT X-STRAIN IN OGDEN MATERIAL MODEL:
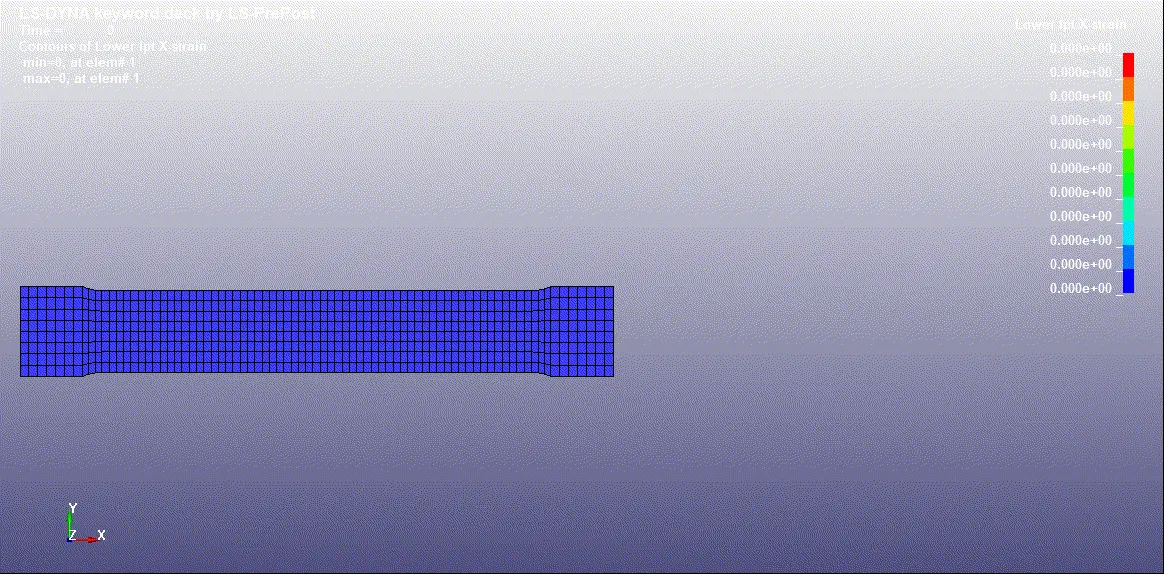
MAX STRAIN :0.555702
While the comparison Both the material with experimental Data the Maximum Stress,Strain value are :

From this we know that the Stress and Strain we got from the Mooney Rivlin and Ogden Material is less than the Experimental Data of Stress and Strain.
CONCLUSION:
Both the Hyperelastic model has been created and evaluated the constants for both,with the constant value we get the true stress and true strain and converted into Engineering stress and Strain and compared both with the Experimental data.