Week - 10 Hyperelastic Material Models
Aim: To perform the material modelling from the data given and calculate the money-Rivlin and Ogden material constants and compare them both using stress-strain data from a Dog-bone specimen tensile test with 100% strain.
Procedure:
Mooney Rivlin Constant
1. Import the .k file.
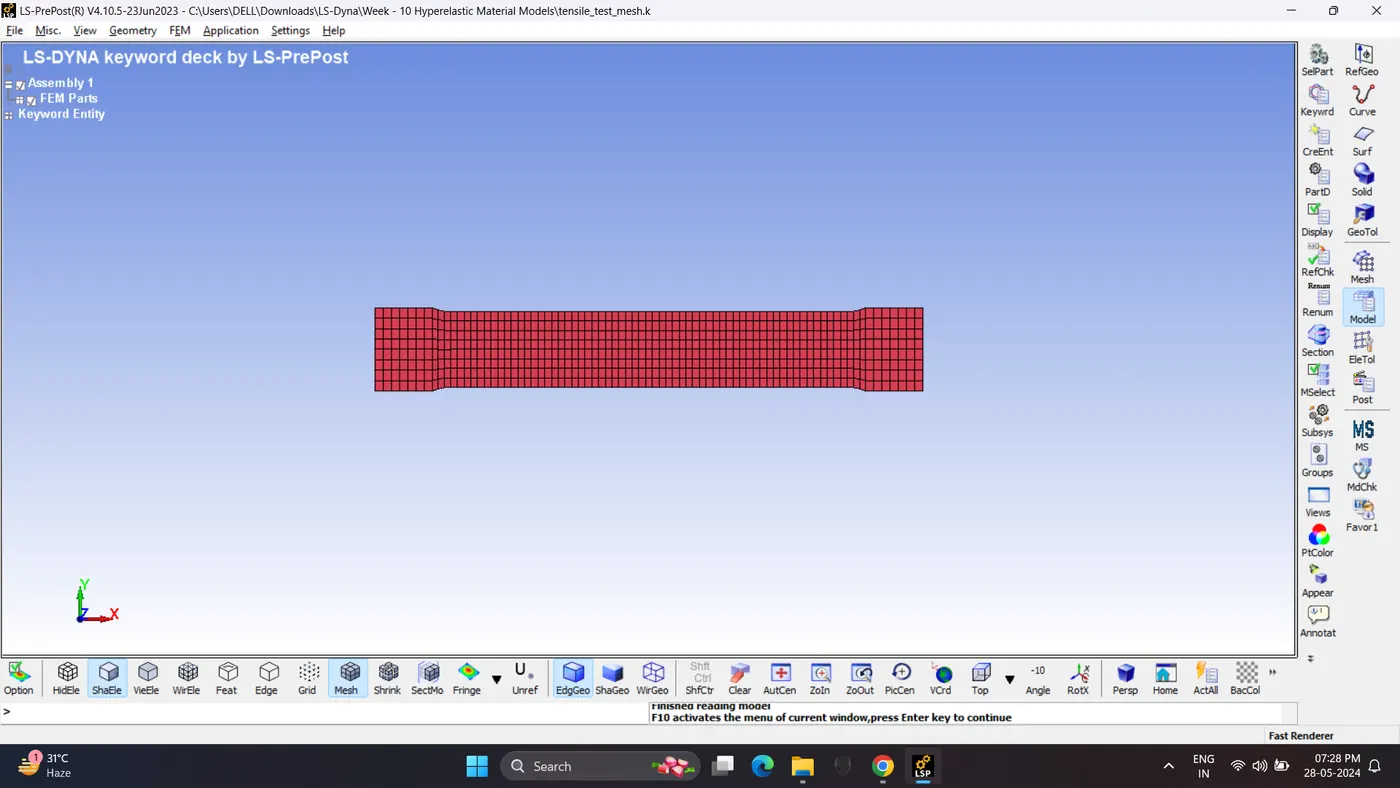
2. Lock all the DOF of left side of specimen.
Go to Model - Create entity - Boundary - SPC.
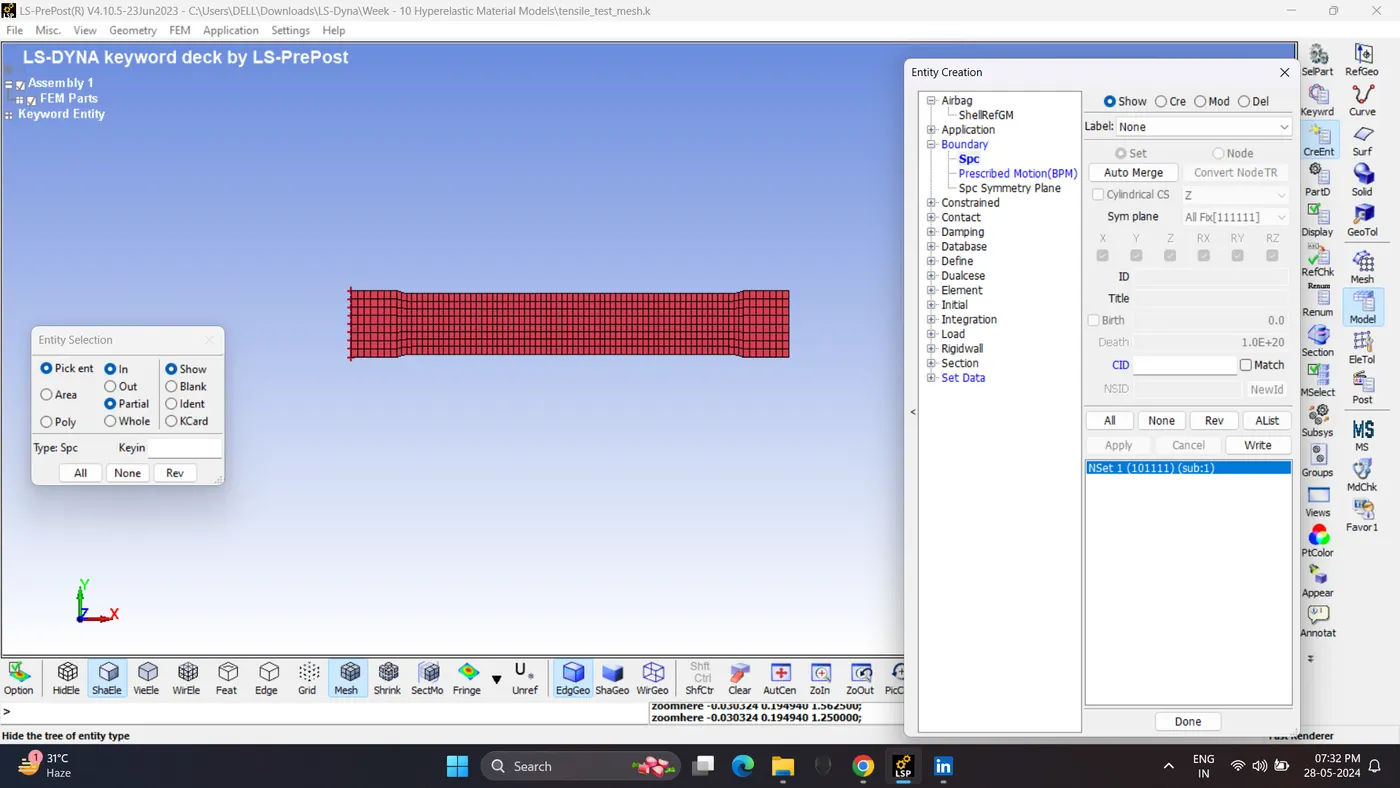
3. Create a node set for the other end.
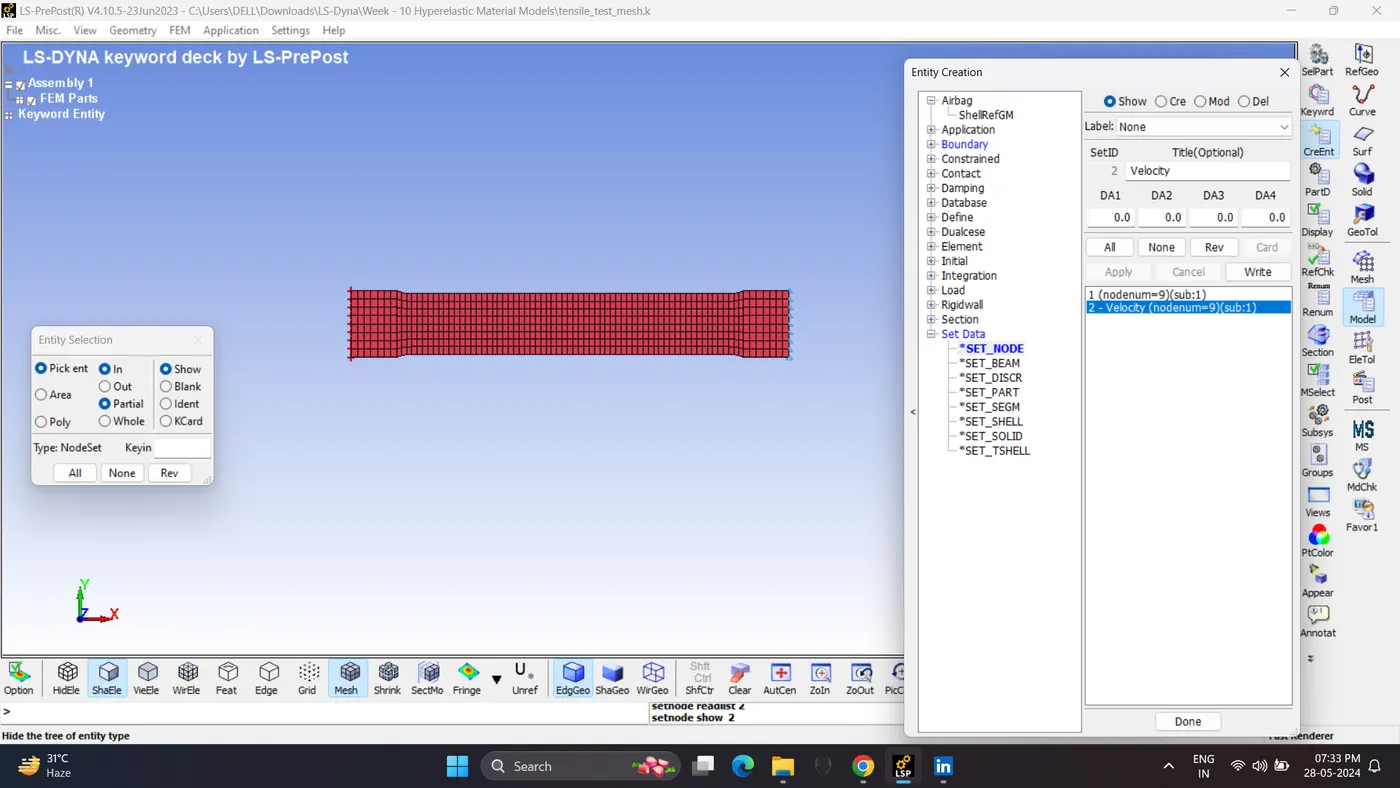
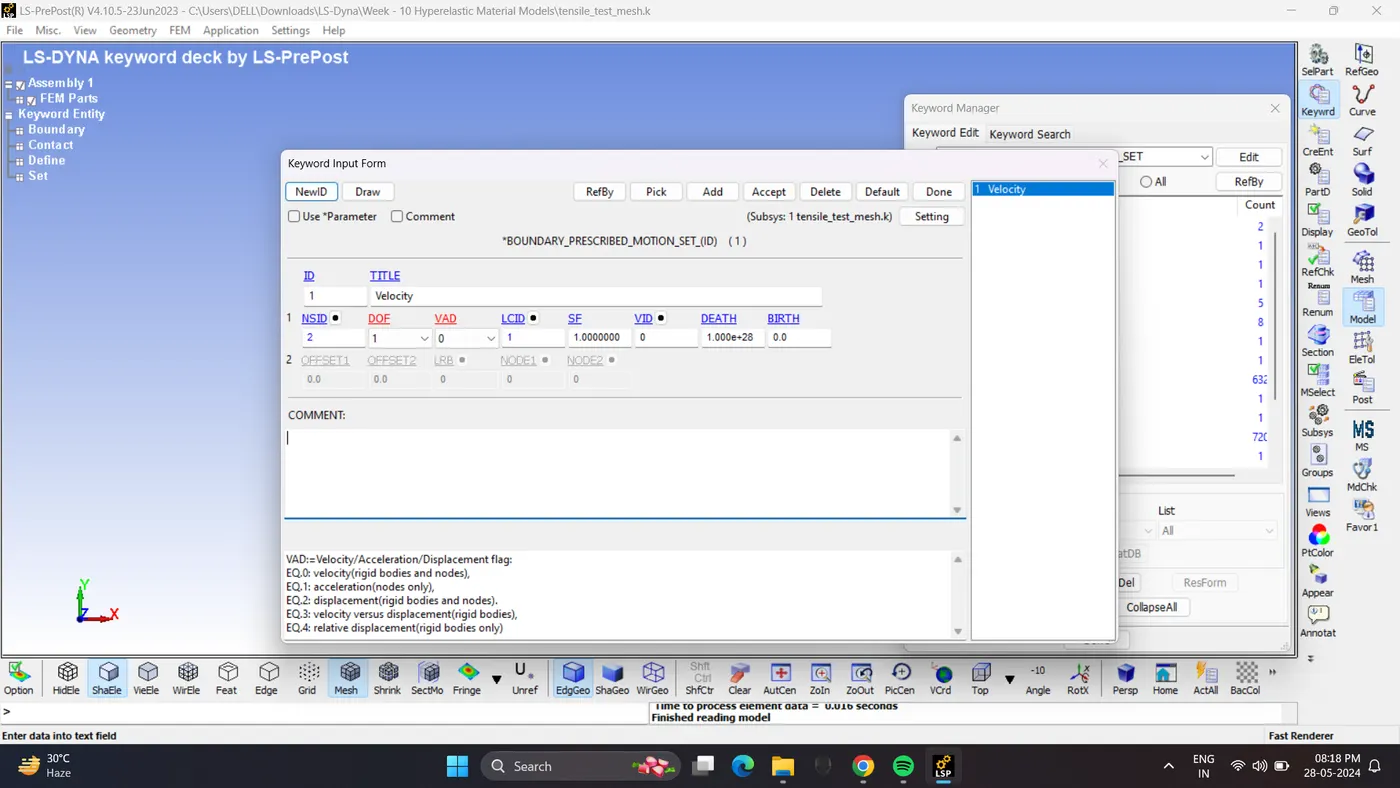
4. Create a Velocity card. Go to Model - Keyword Manager - Boundary - Prescribed Motion Set.
Give 1 mm/ms velocity.
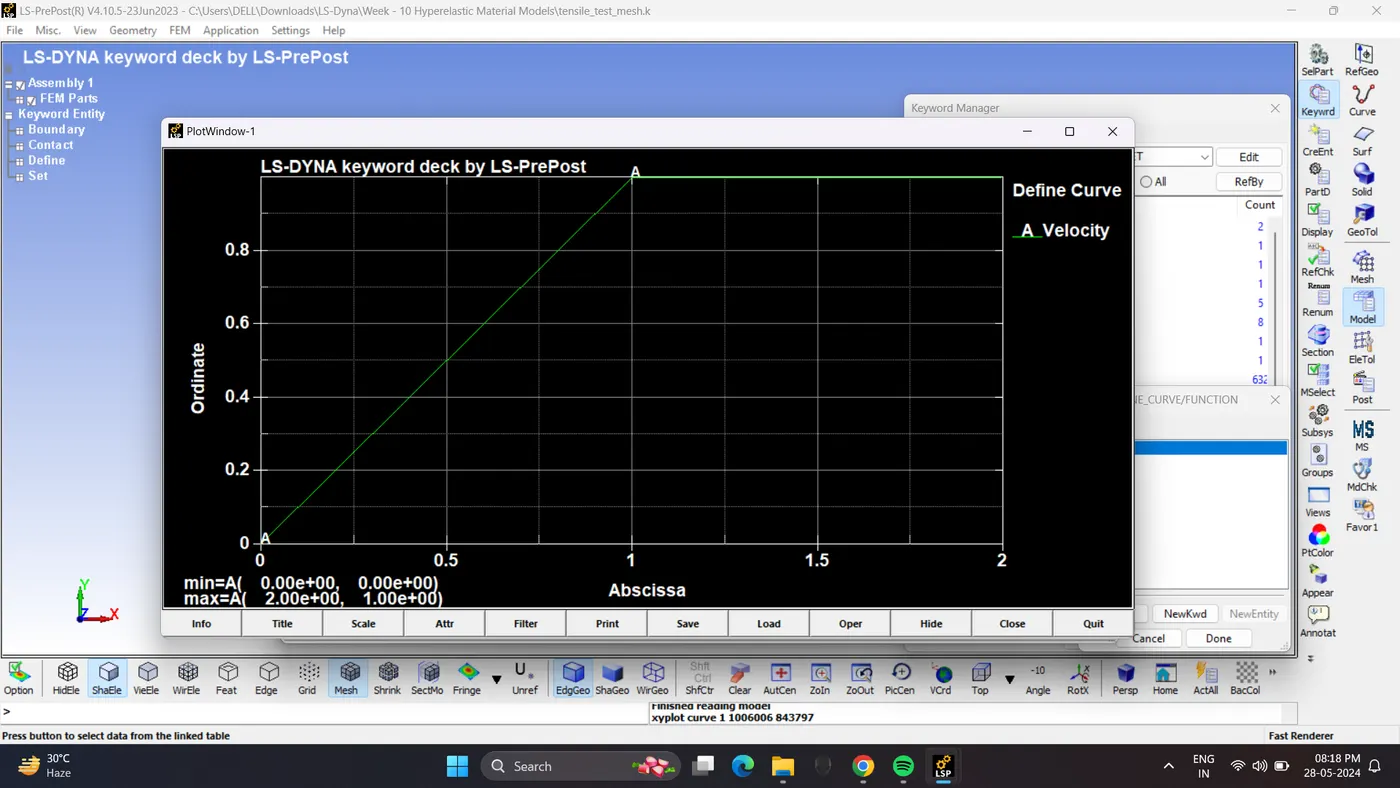
5. Create a Curve for material.
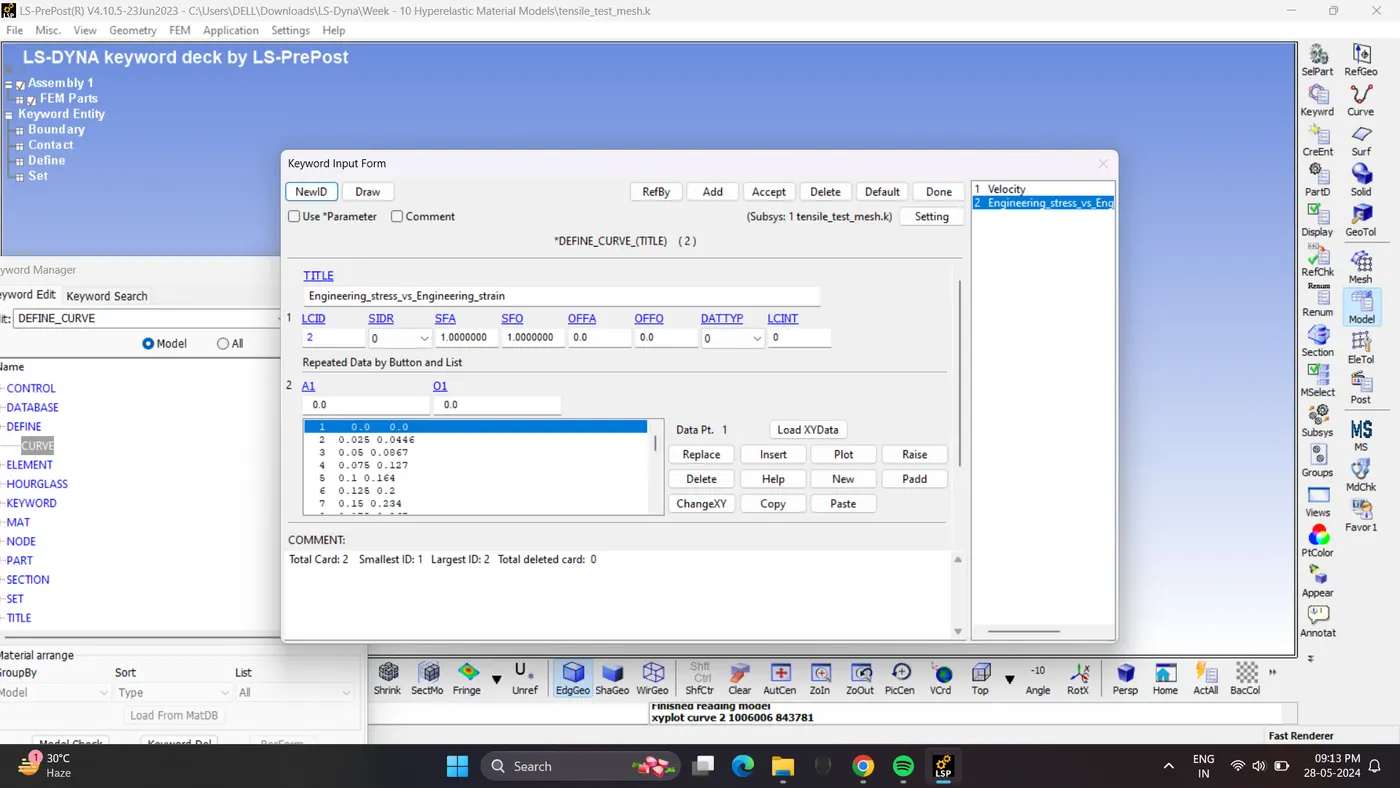
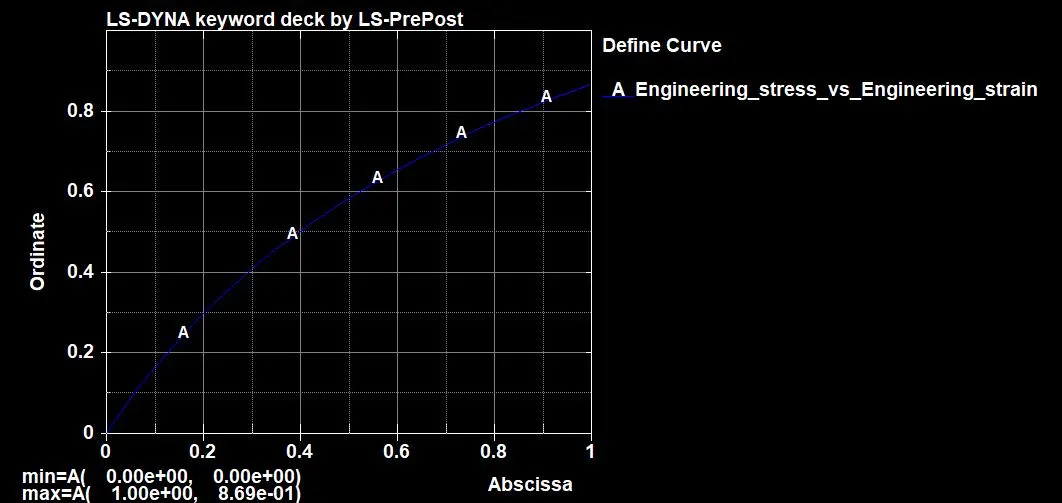
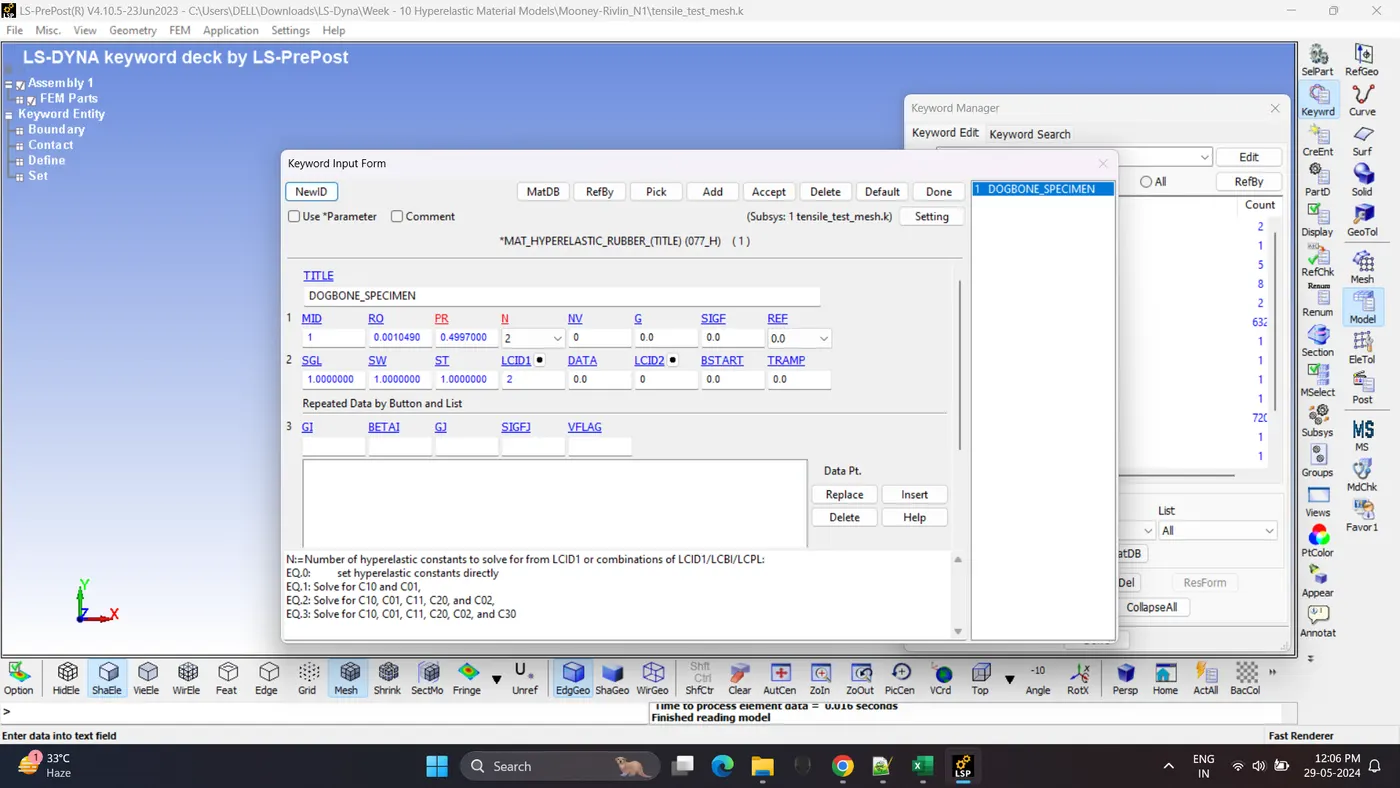
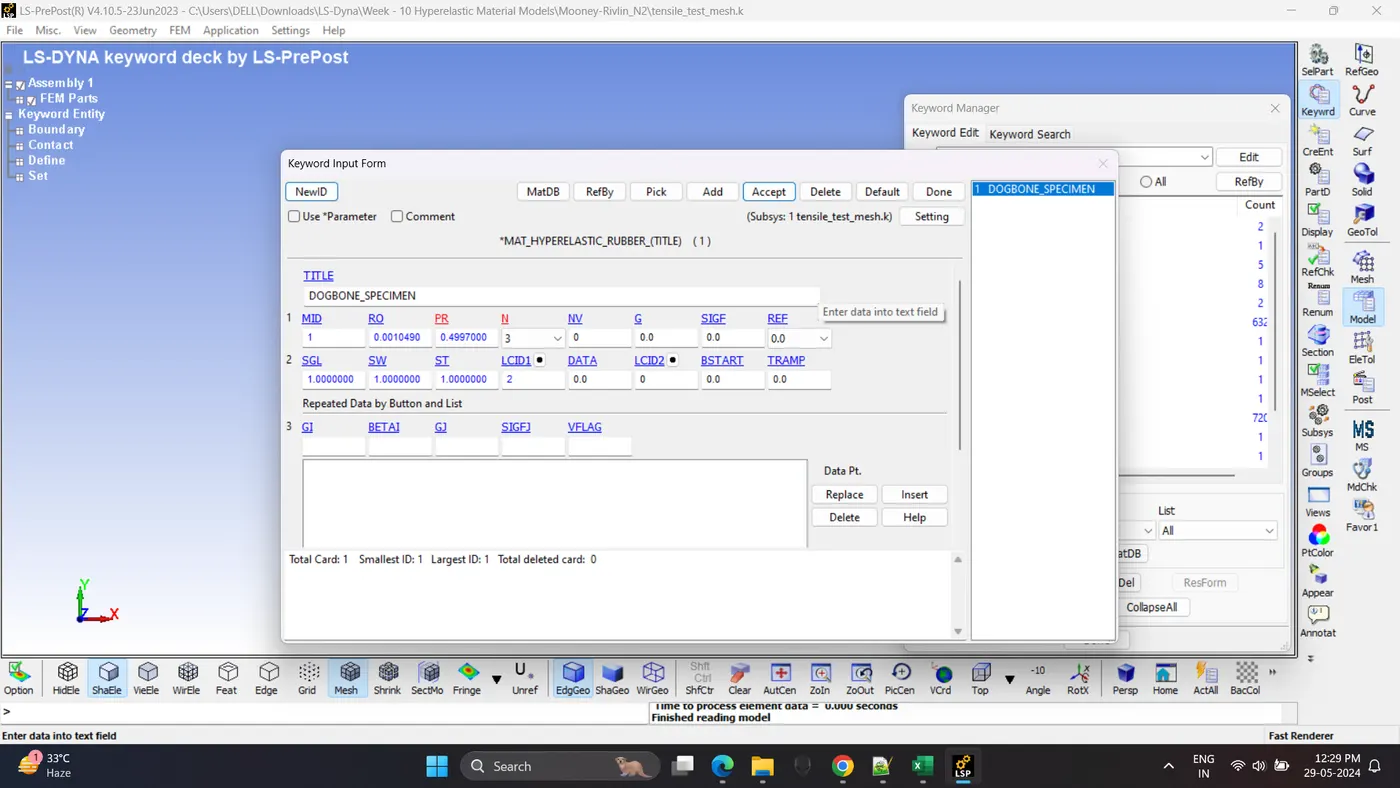
6. Create a Material card. Go to Model - Keyword Manager - Mat - 077_H-HYPERELASTIC_RUBBER.
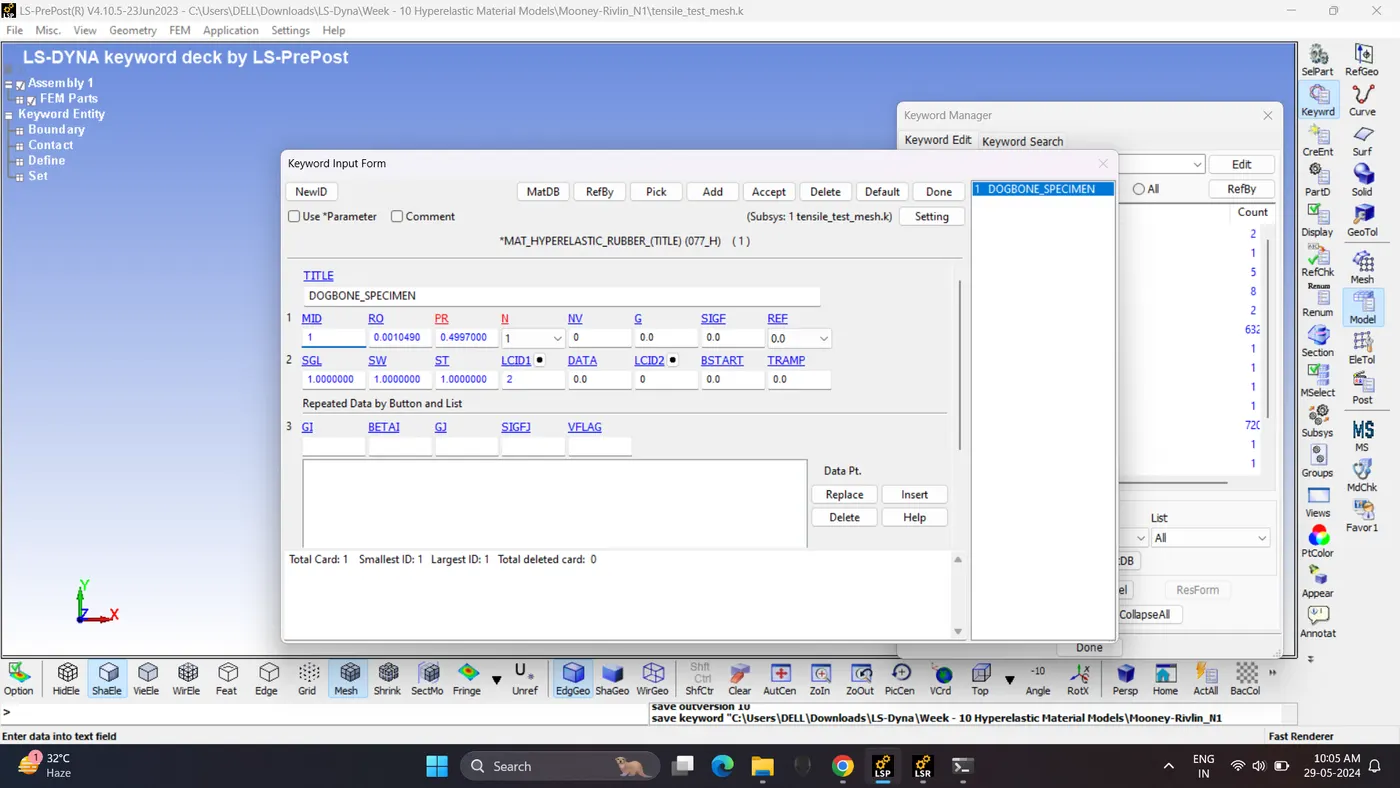
Ro-Density of hyperelastic rubber= 0.001049 gm /mm³.
PR- poissons ratio = 0.4997
N parameter in the *MAT77_H material card represents the order of polynomial for which the constants are required to solve. This involves N1, N2, and N3 cases where constants are solved along with stretch and true stress data.
The Mooney-Rivlin constants for each polynomial order cases are:-
N1 Solves for Two Polynomials C10, C01
N2 Solves for five Polynomials C10, C01, C11, C20, C02
N3 Solves for Six Polynomials C10, C01, C11, C20, C02, C30
7. Create section and hourglass card. Assign Material, section and Hourglass card to part.
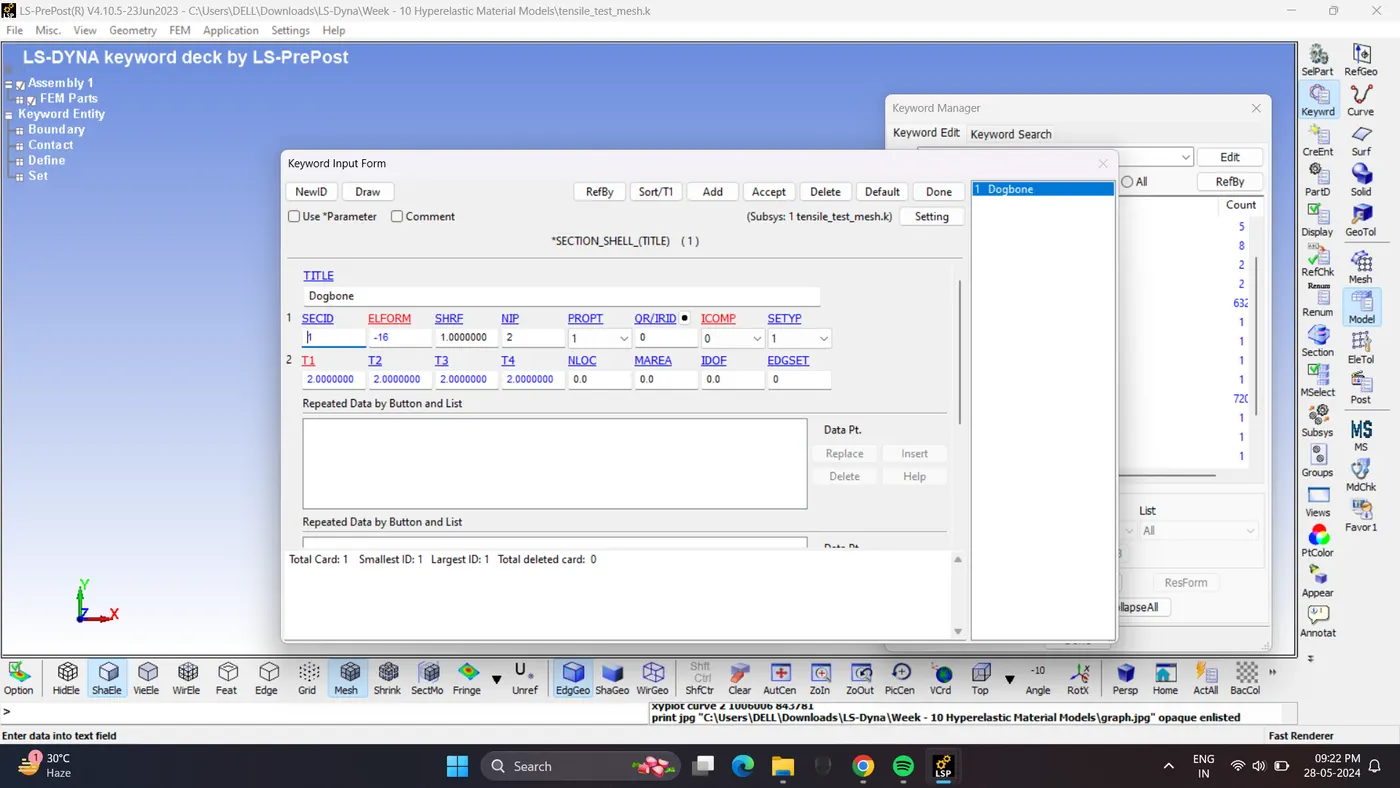
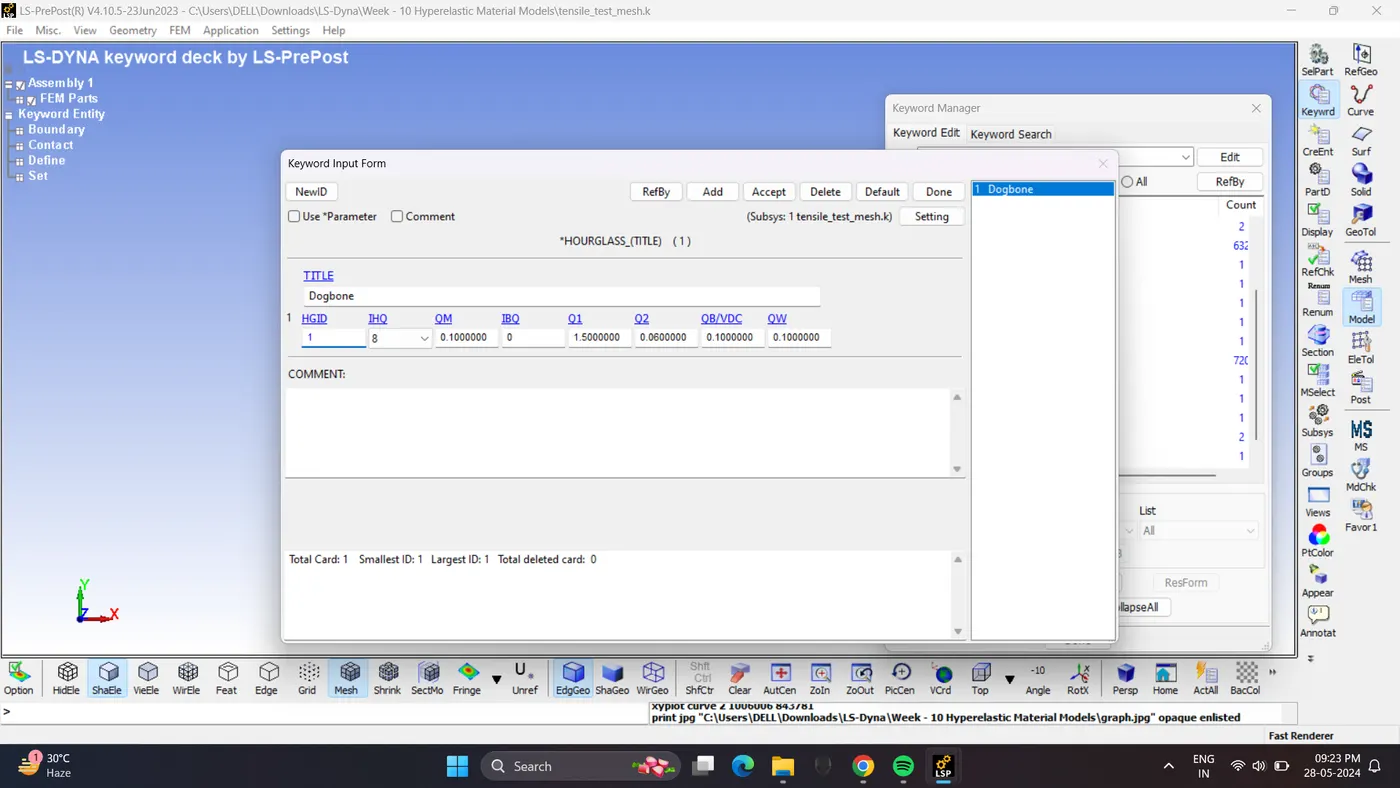
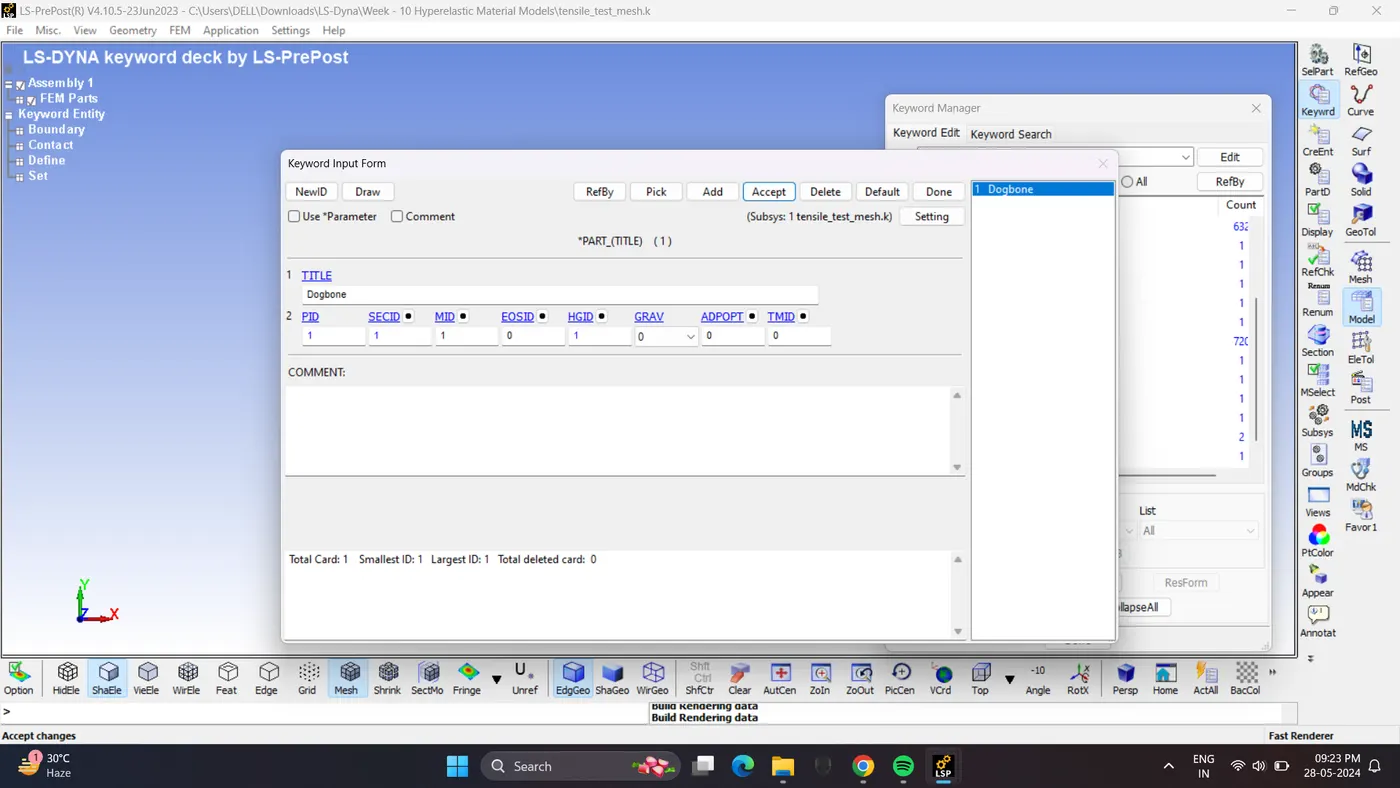
8. Create all the required control and database cards.
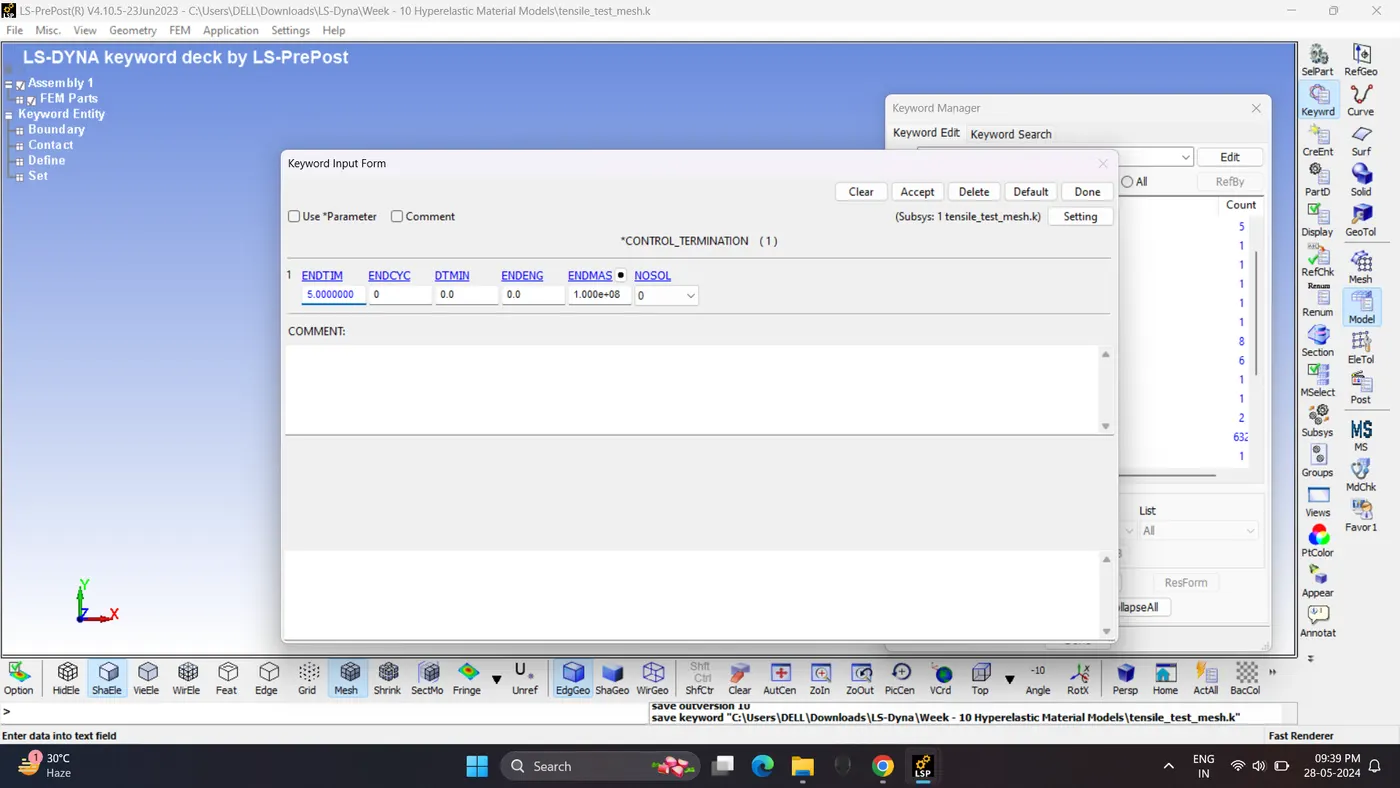
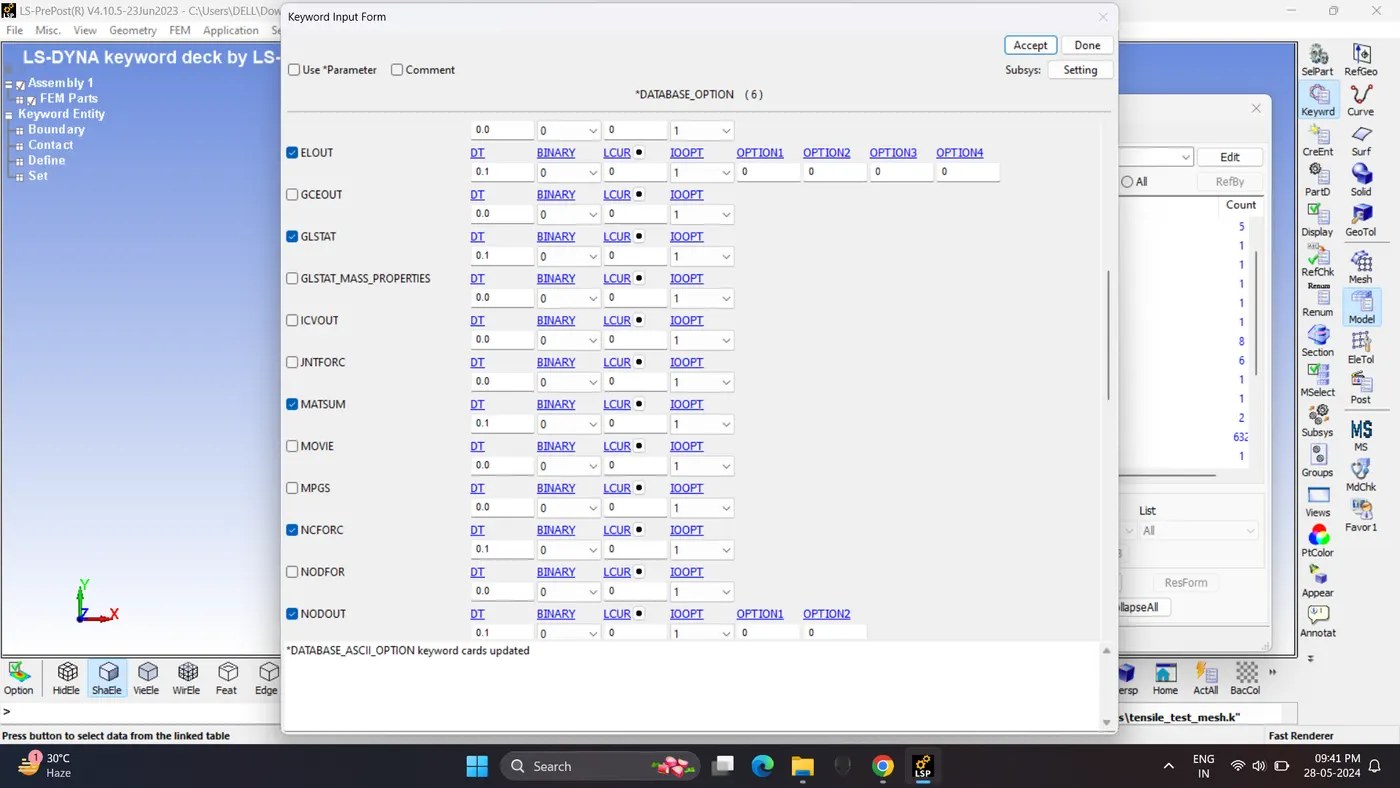
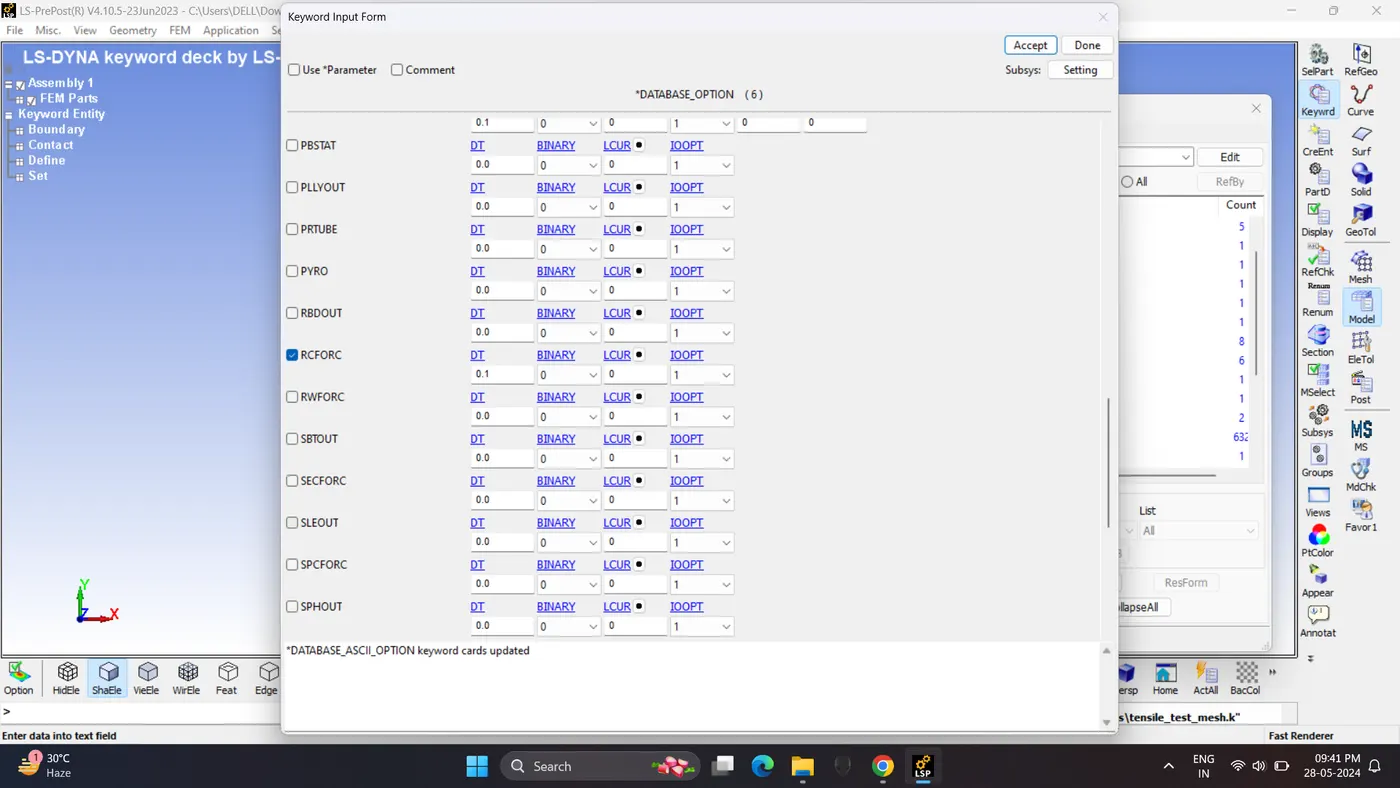
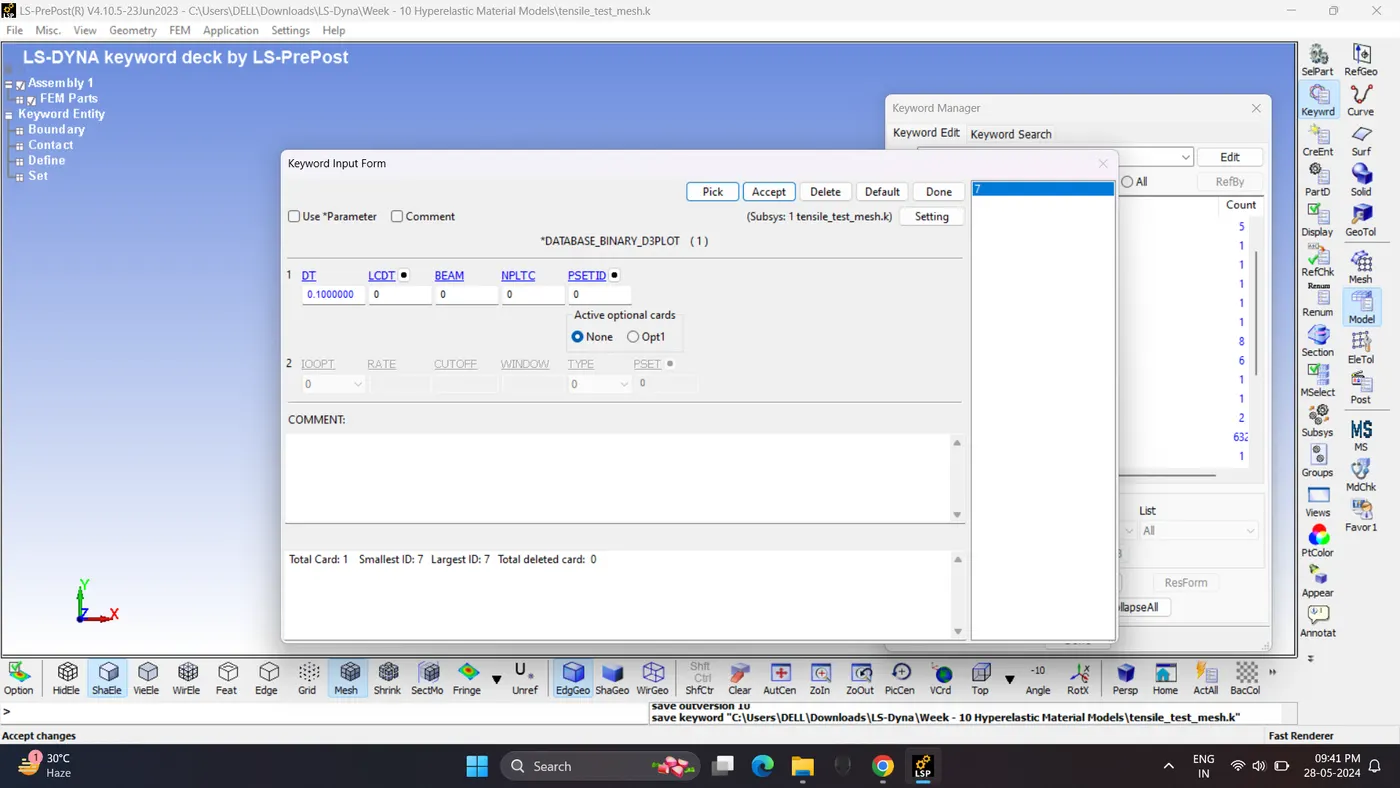
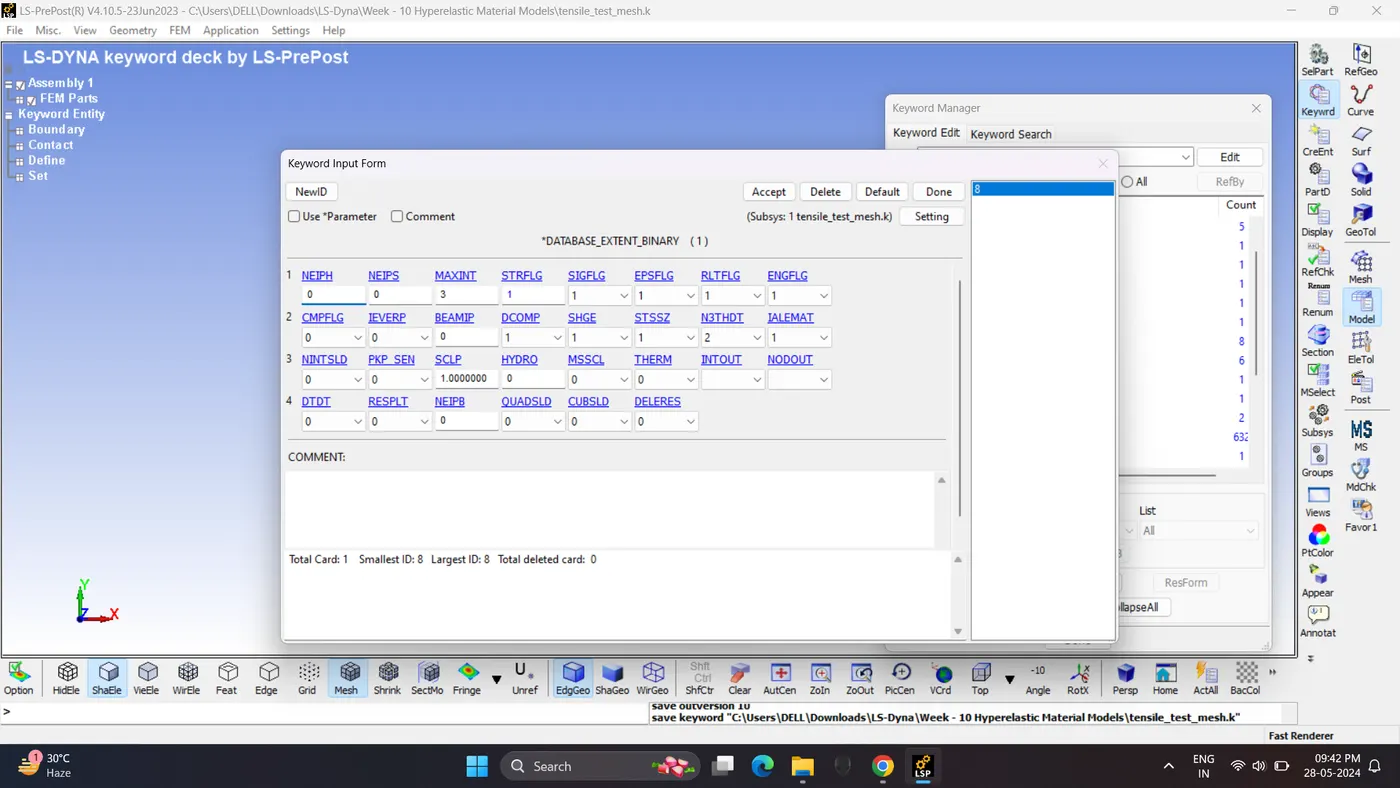
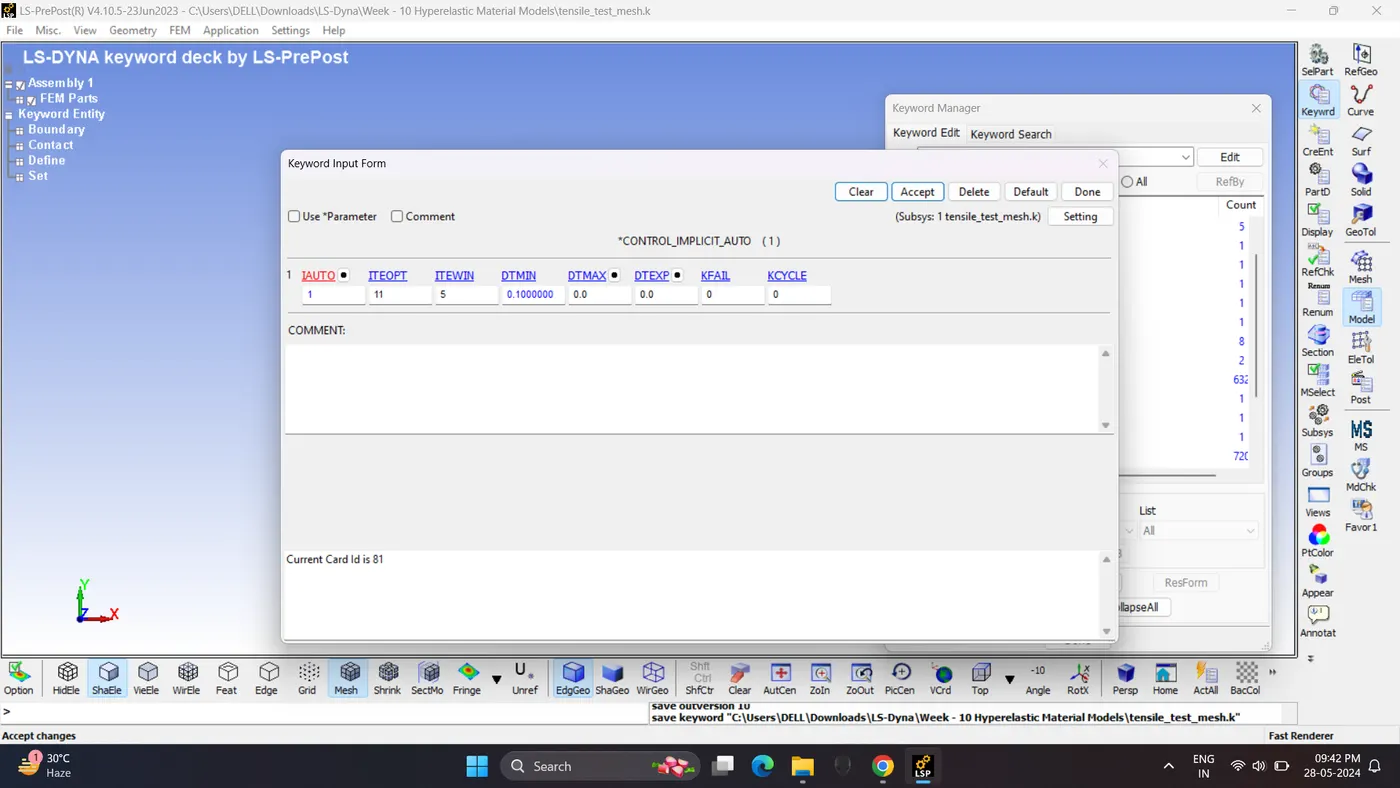
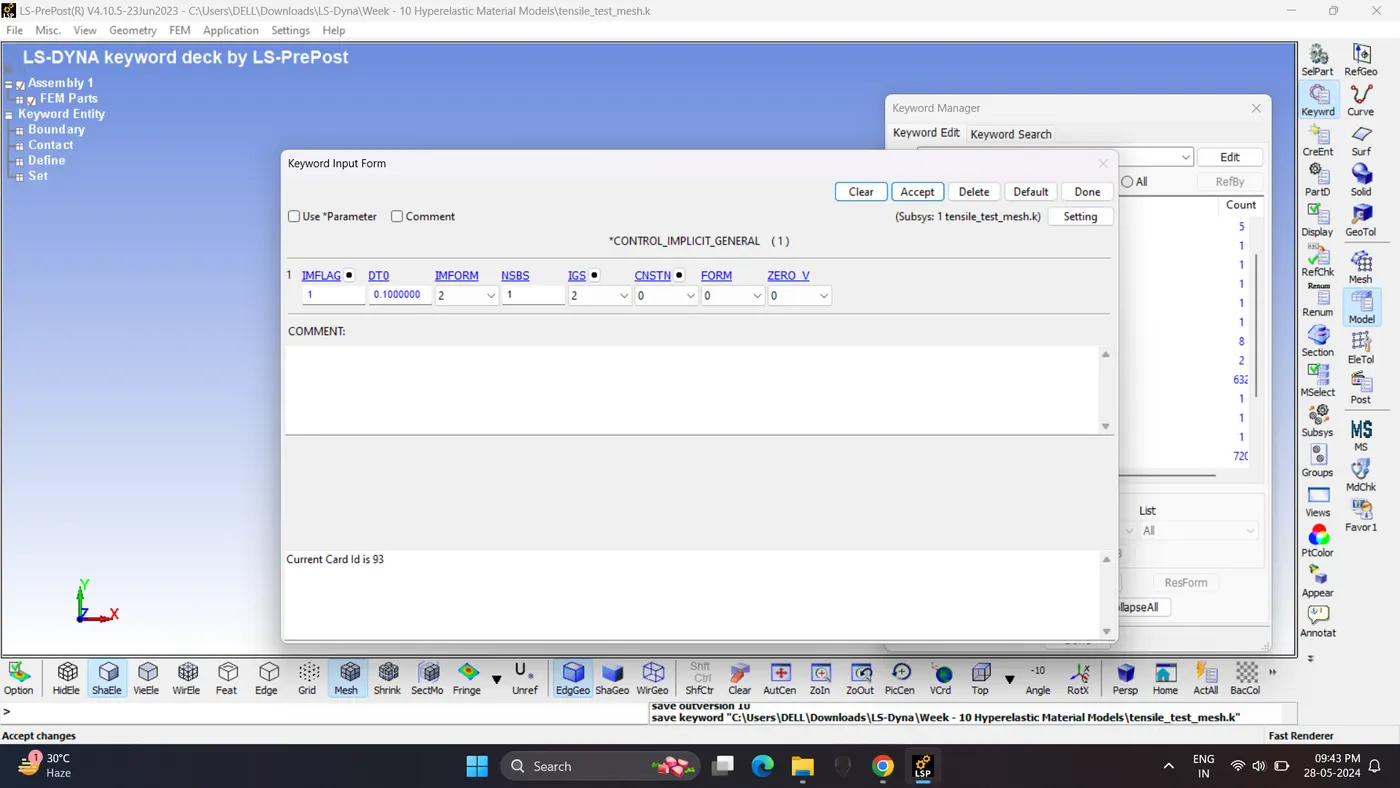
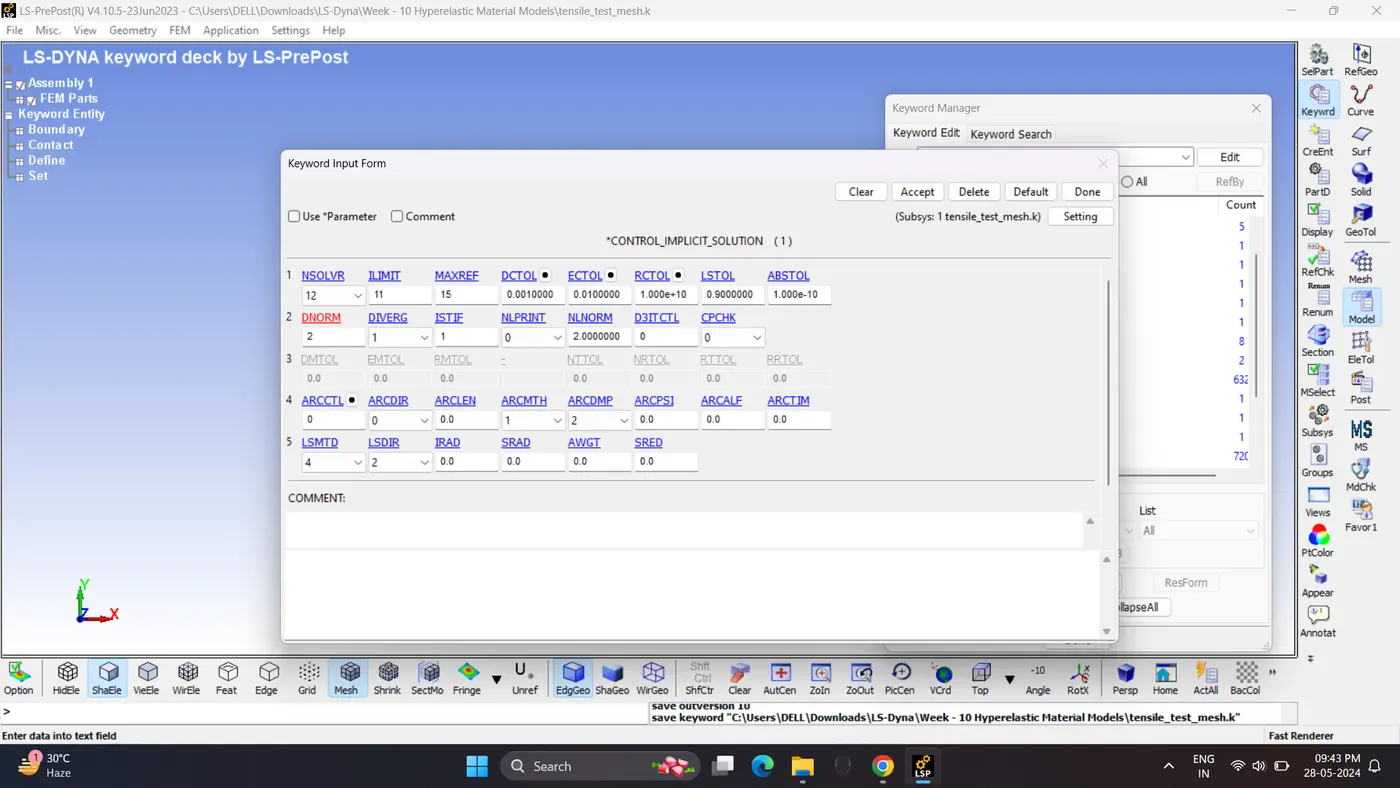
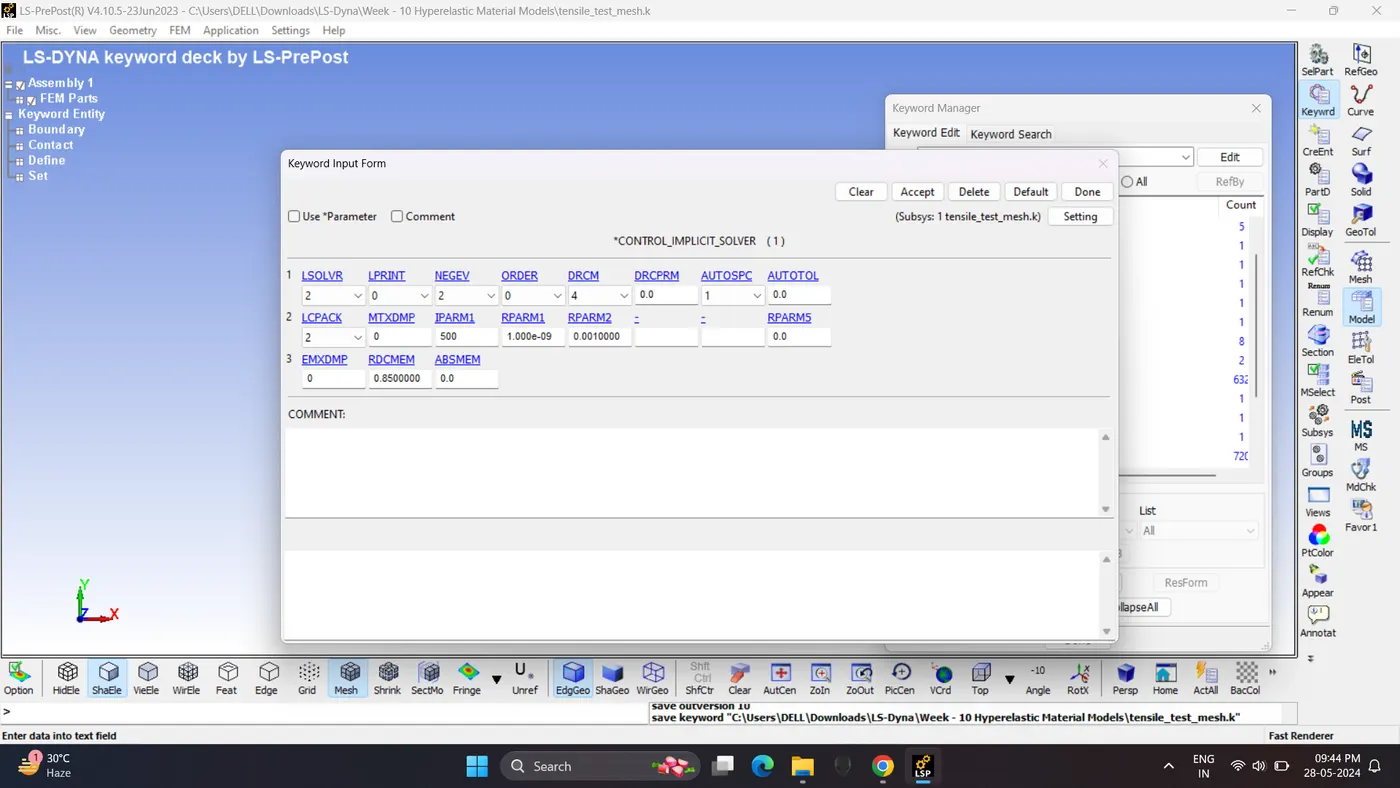
9. Run the model checker. Checke for any errors.
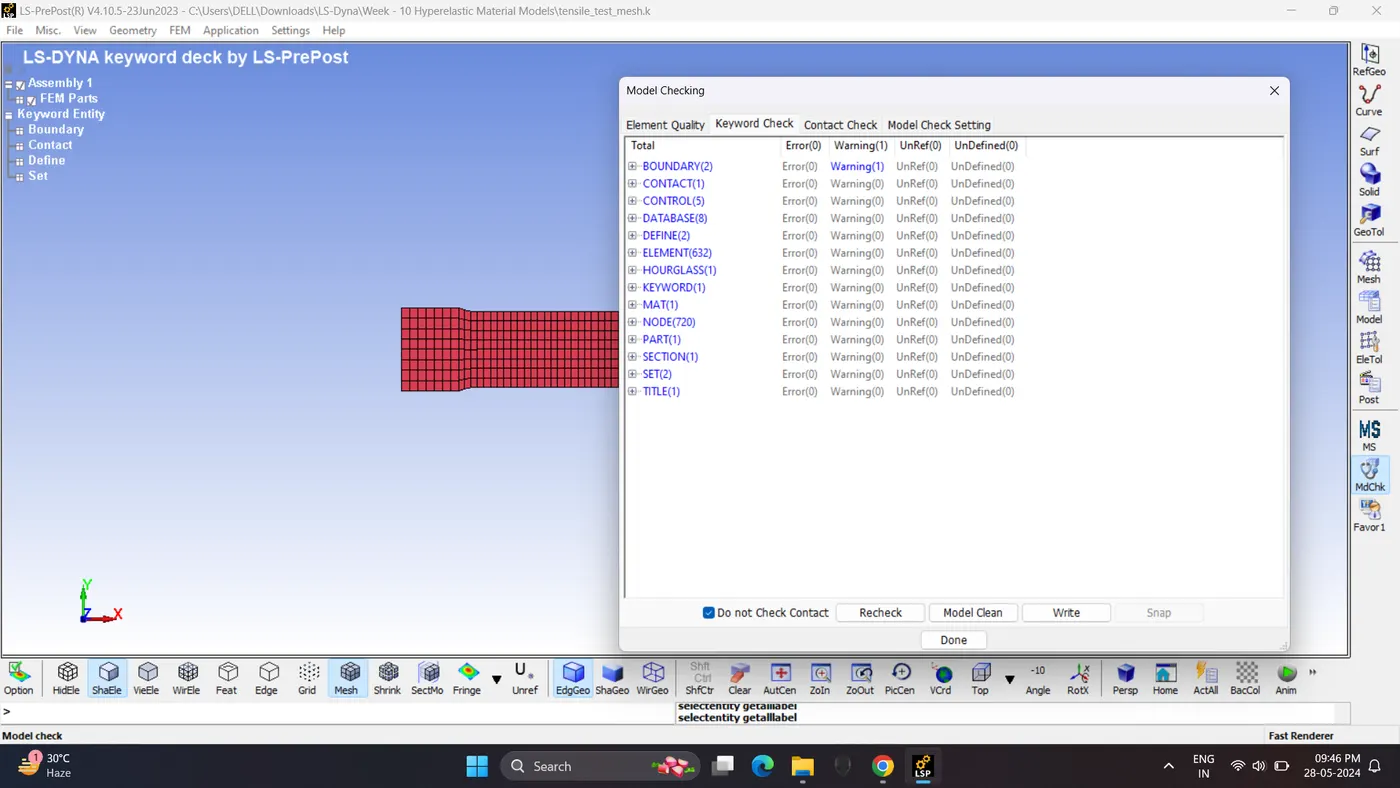
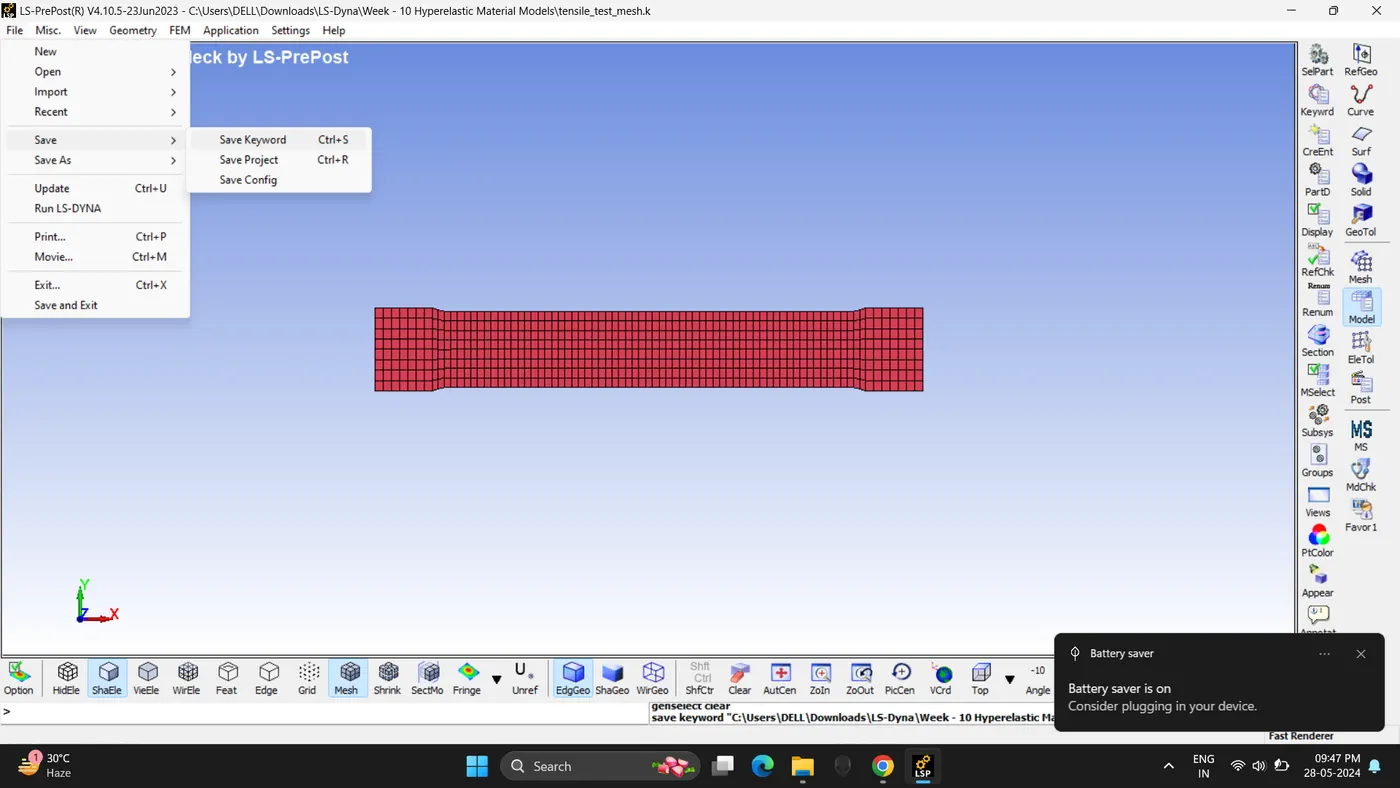
10. Save the Keyword File. Go to File - Save - Save Keyword.
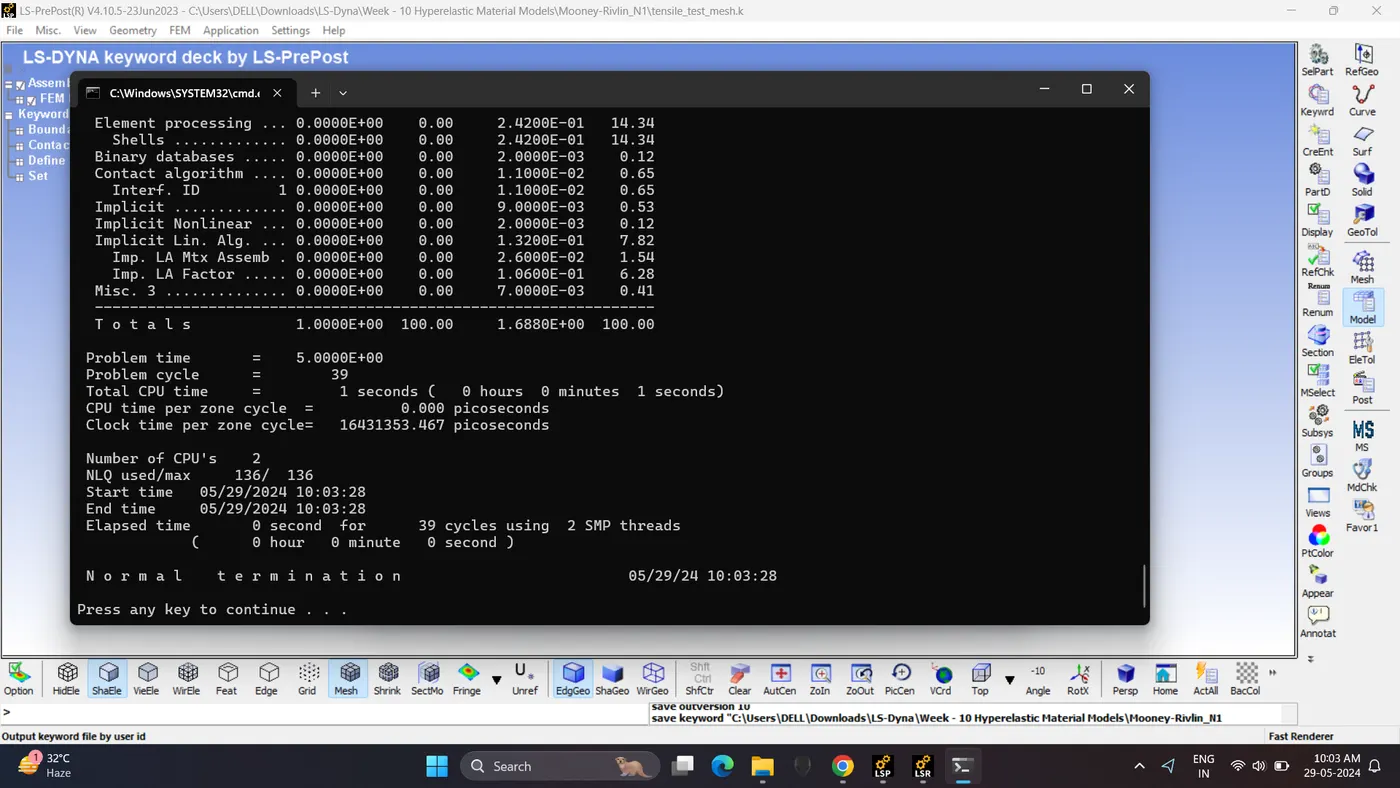
11. Run the Simulation. Open LS_Run - Select File - Click Add job to local queue.
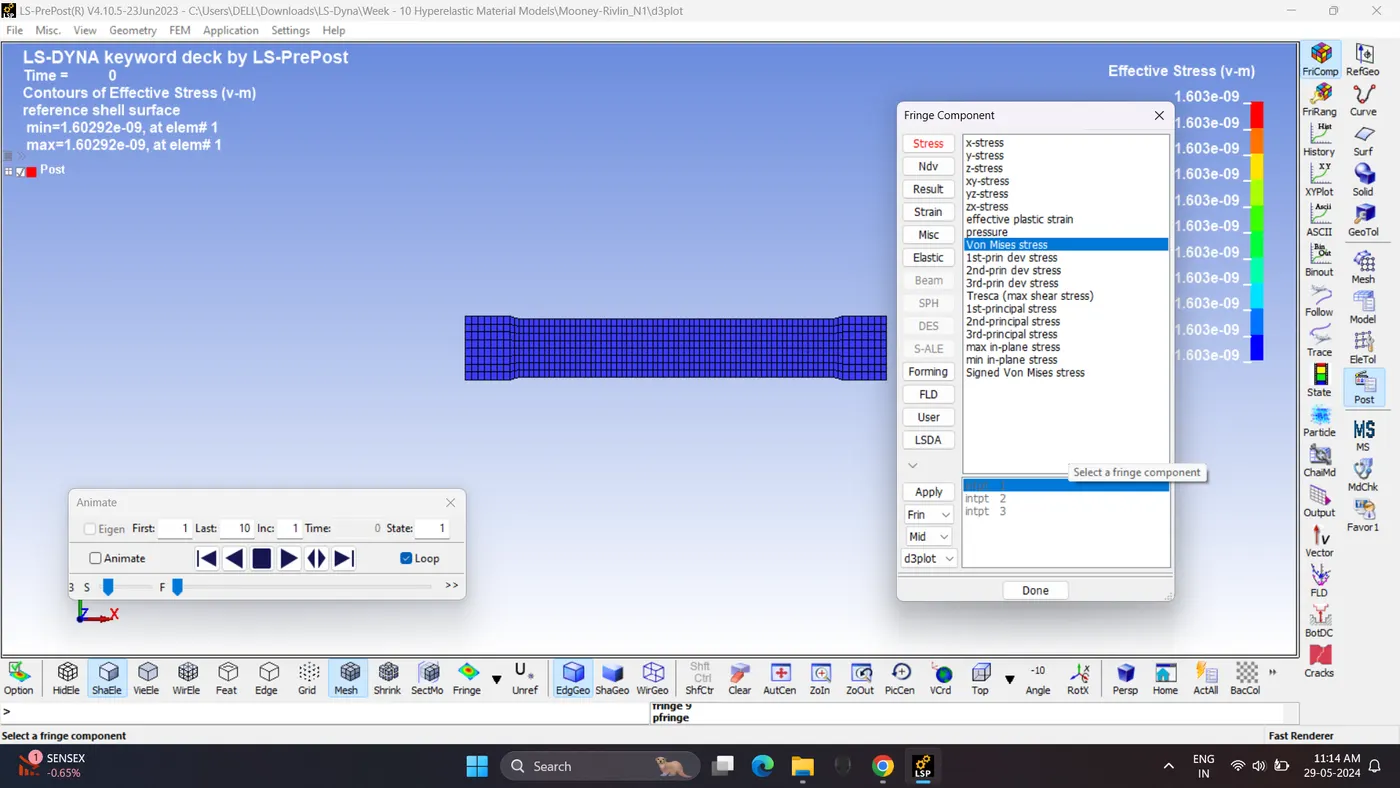
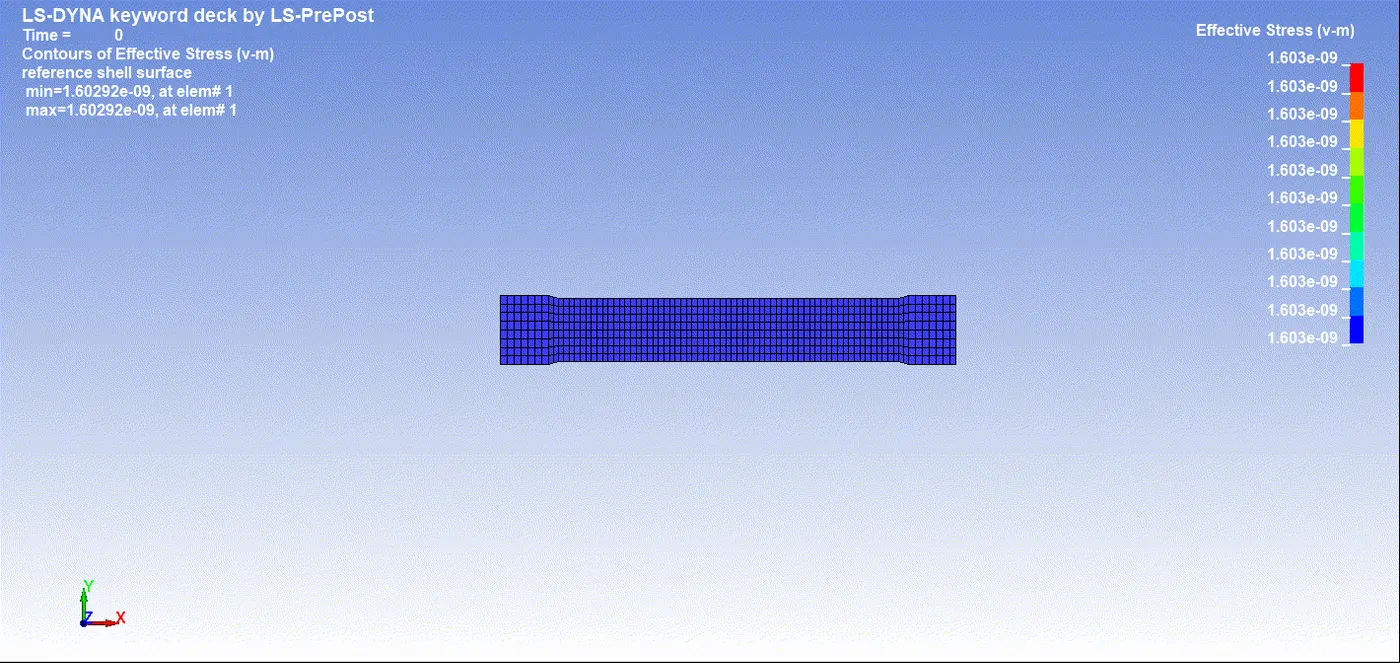
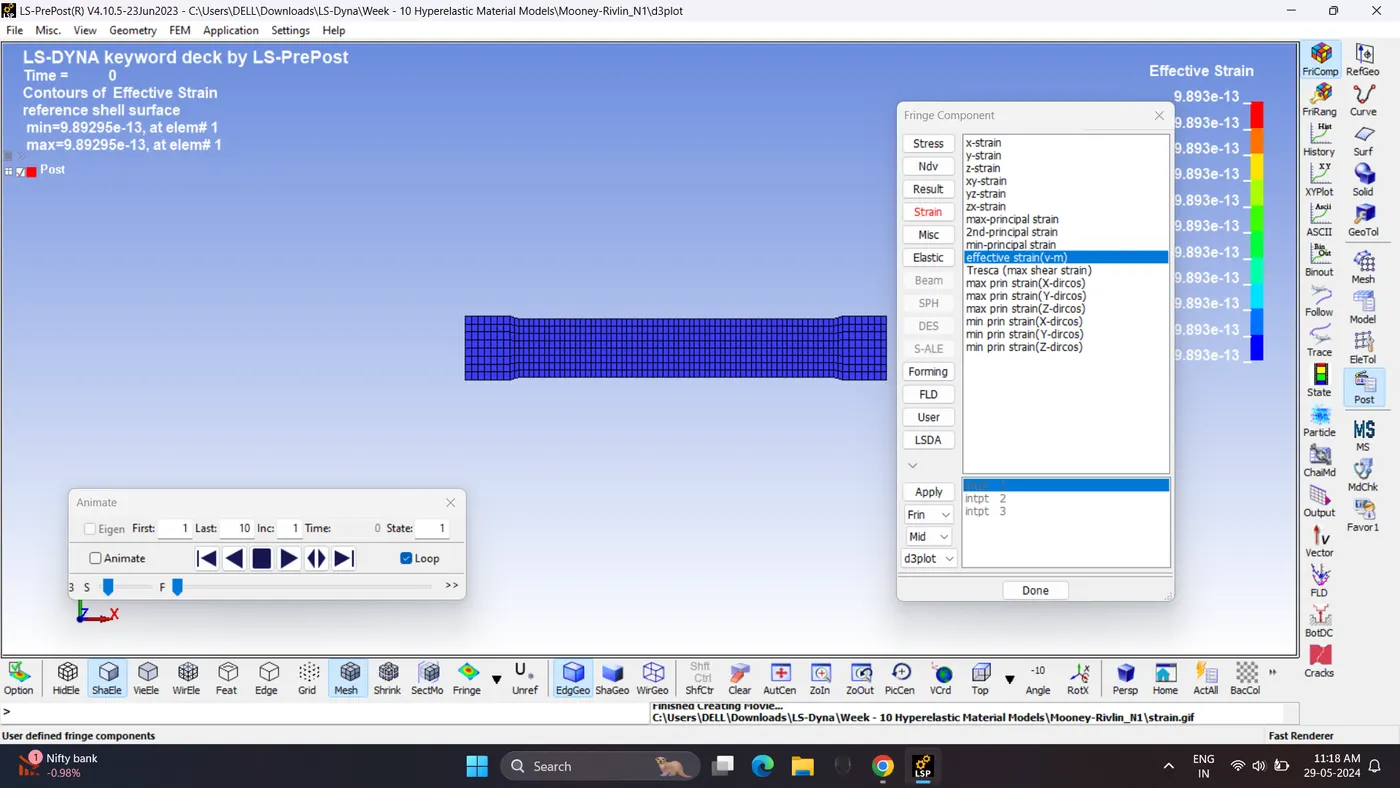
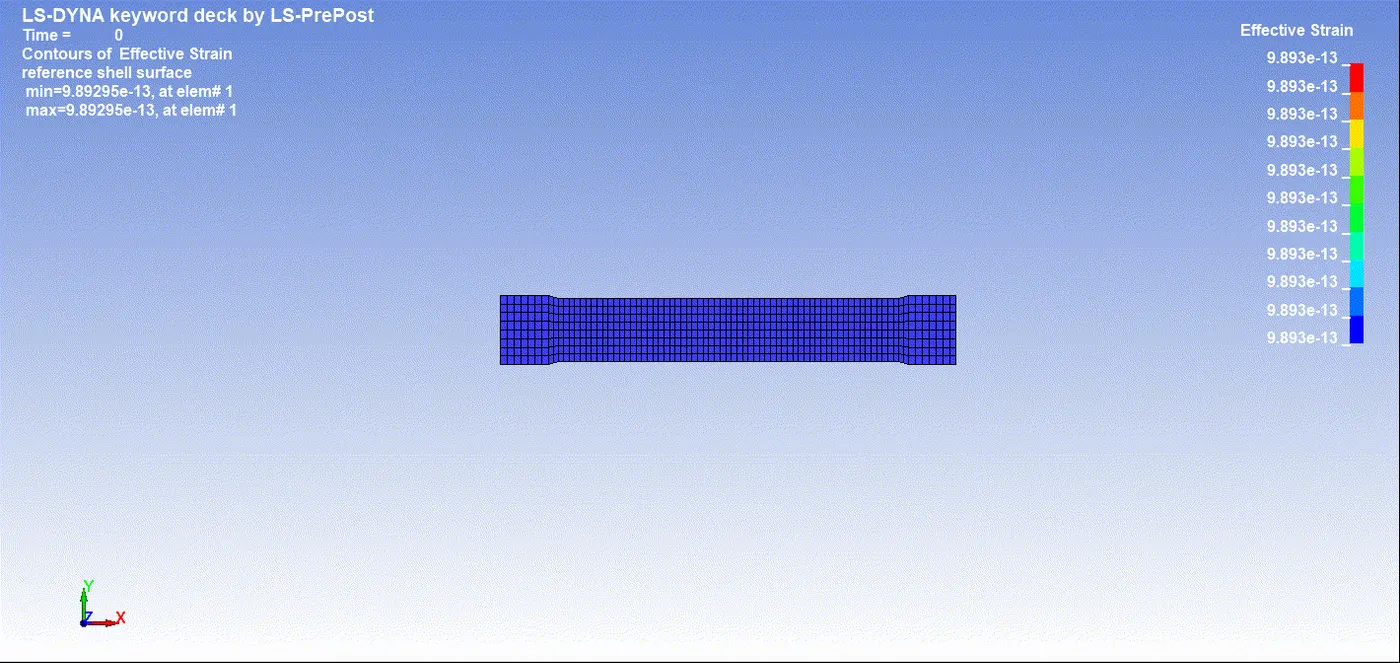
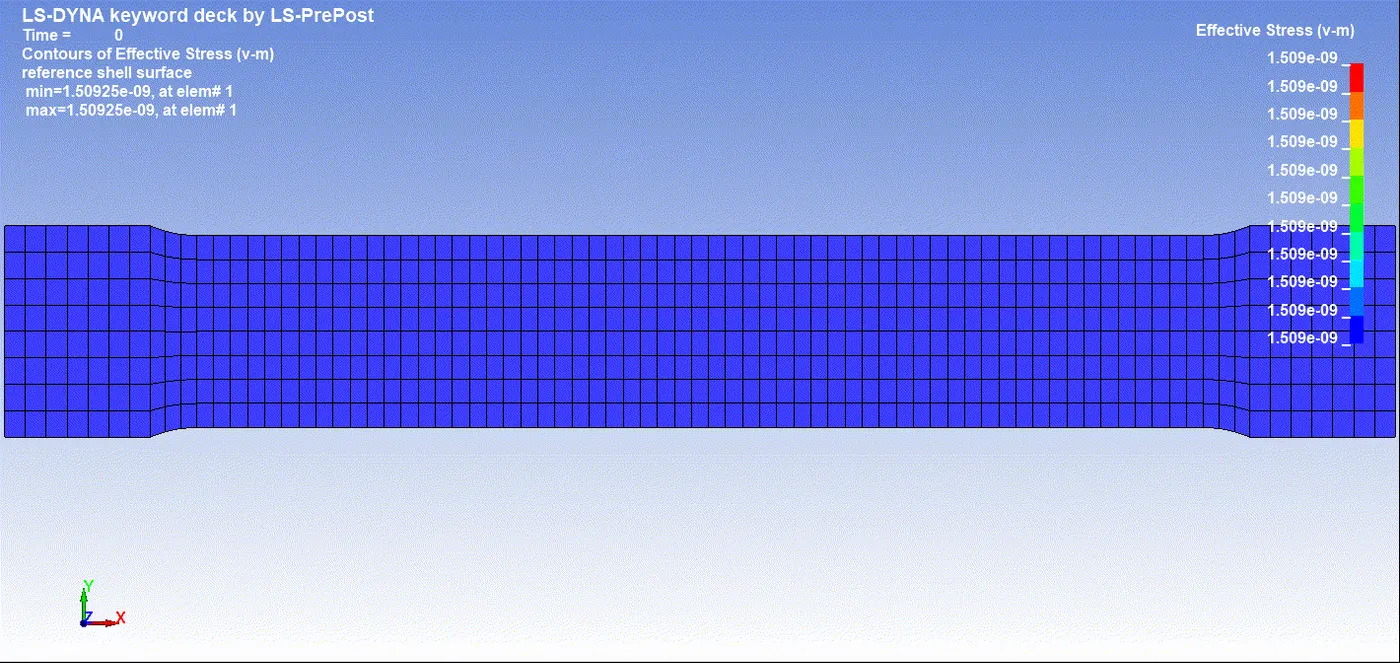
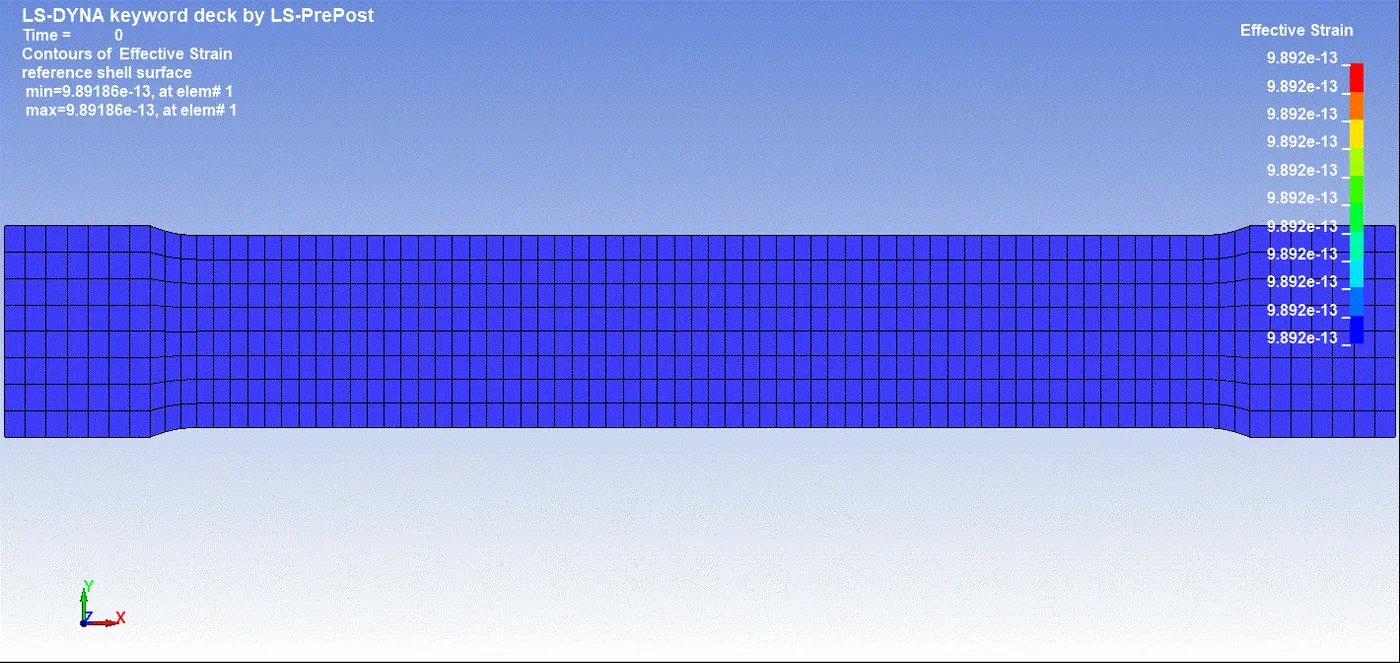
12. Open the Keyword and D3_plot in Ls-PrePost. Play the simulation and contour the von mises stress and effective strain.
Max Vin mises stress = 0.0217775 gm/mm*ms^2.
Maximum Effective Plastic Strain = 0.0347253
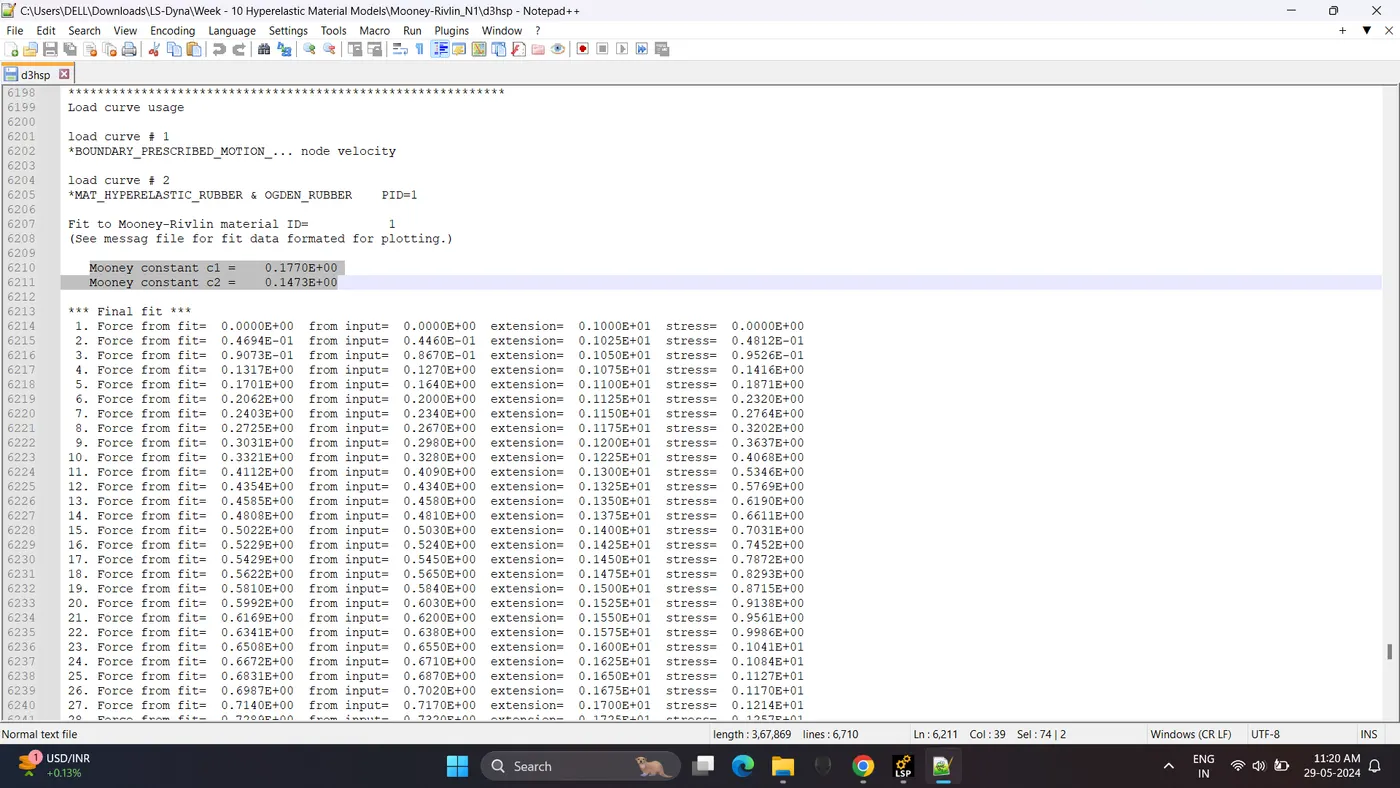
13. To find out hyperelastic constants in simulated open d3hsp file in Notepad++.
Mooney Constant
c1 = 0.177
c2 = 0.1473
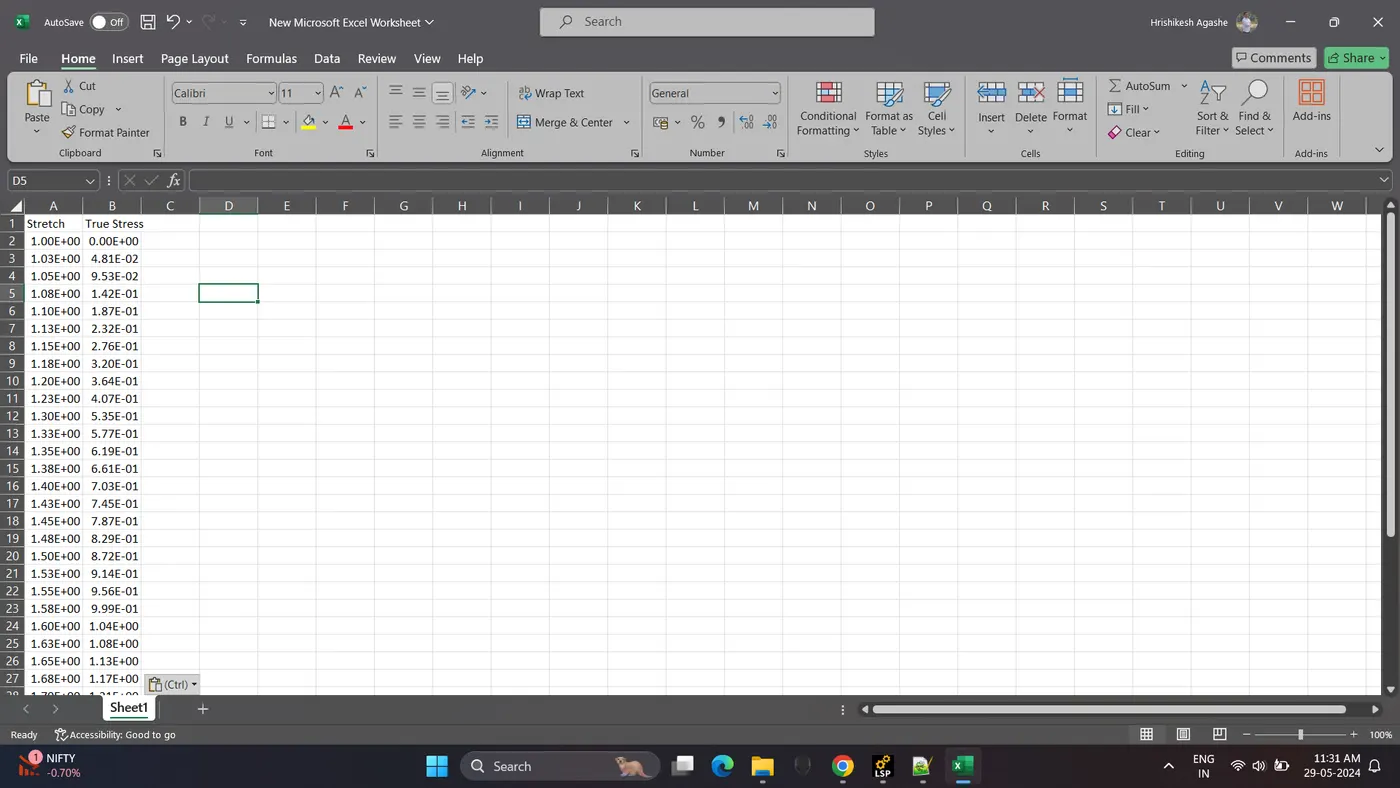
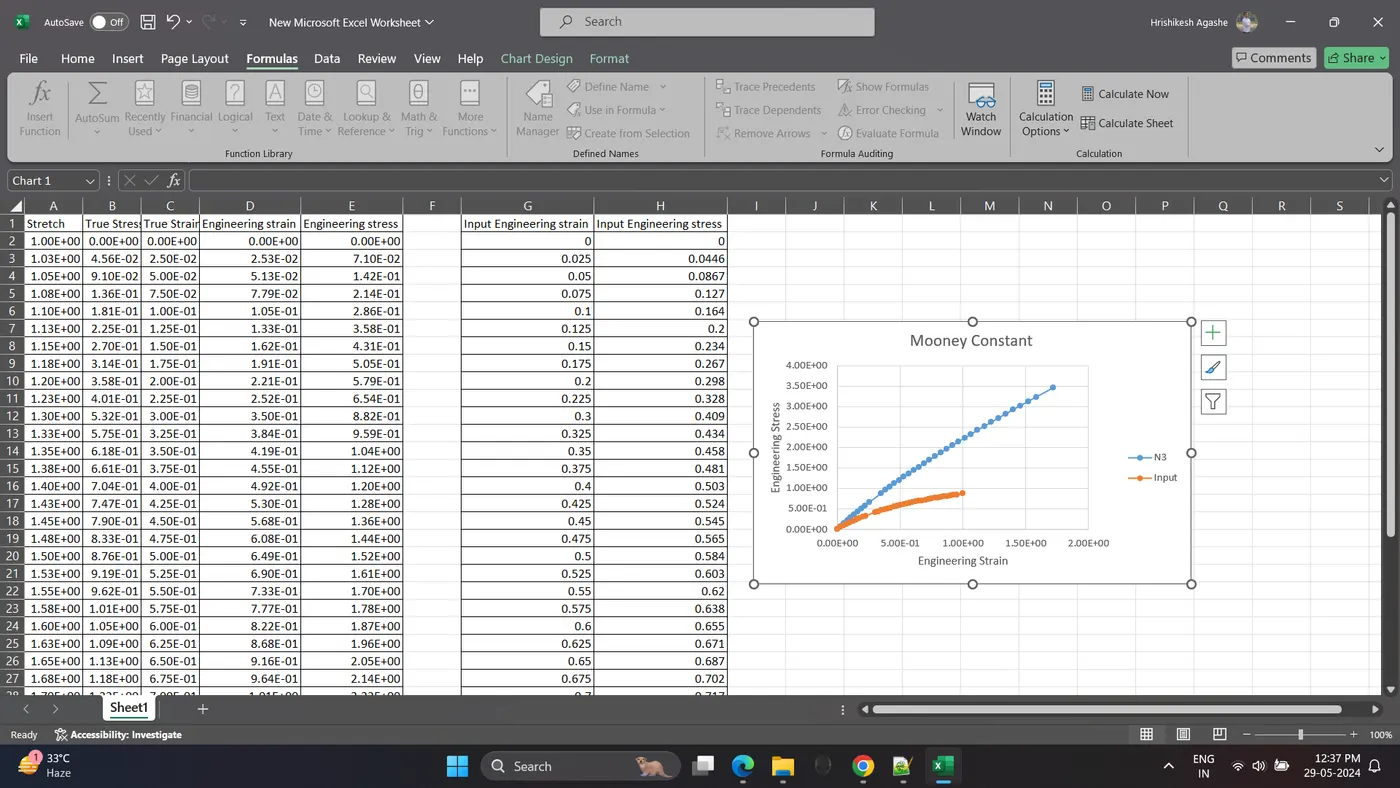
14. Copy the extention (stretch) and stress data from d3hsp file to excel.
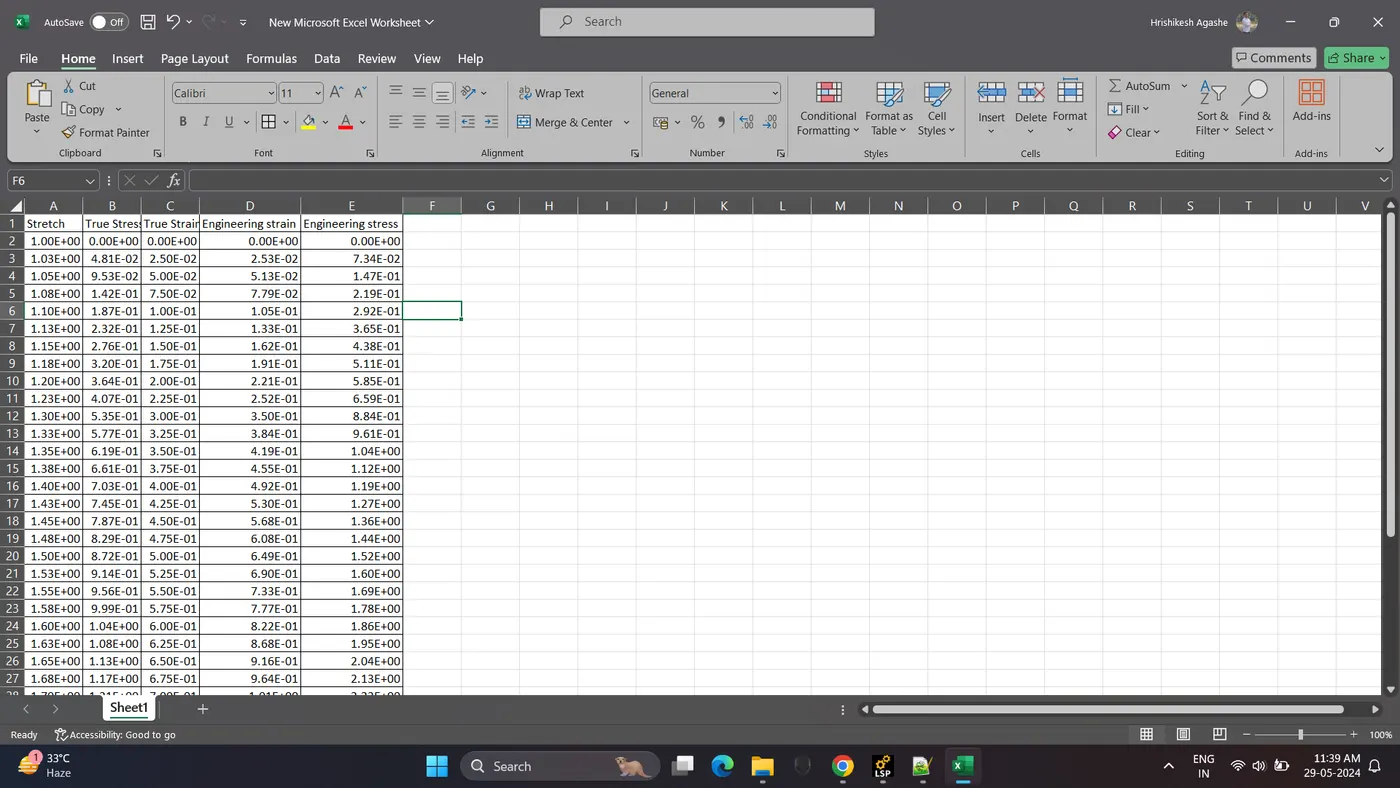
Convert the data to Engineering stress and Engineering strain.
True Strain = 1 - Extension (Stretch)
Engineering Strain = Exp(True strain) - 1
Engineering stress = True stress/(1+Engineering strain)
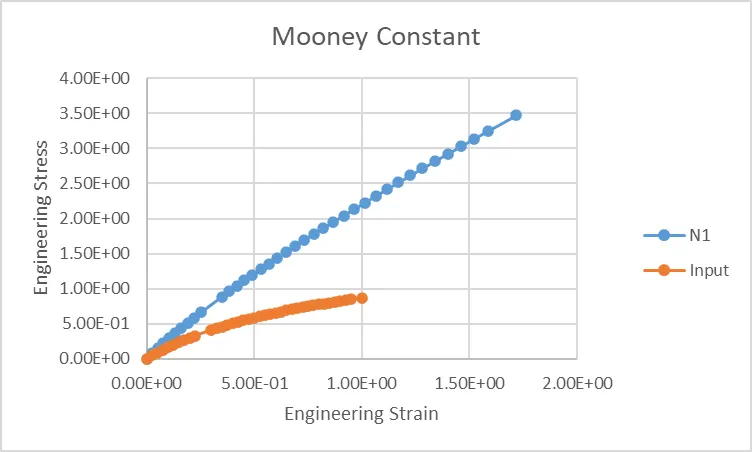
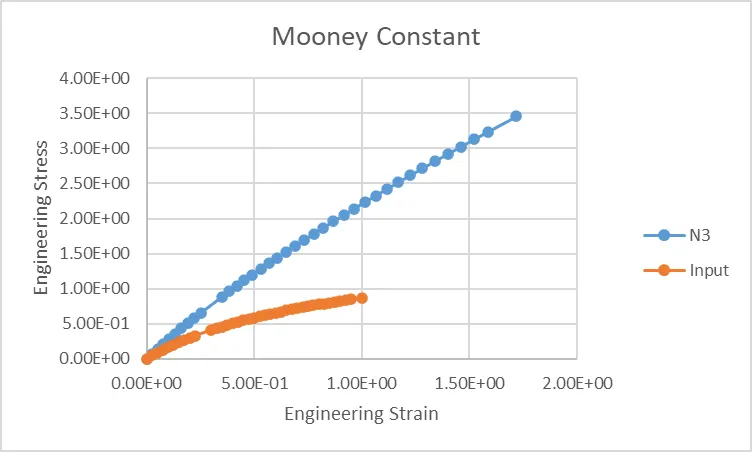
15. Plot comparison graph of Input and output of Engineering Stress and Engineering Strain.
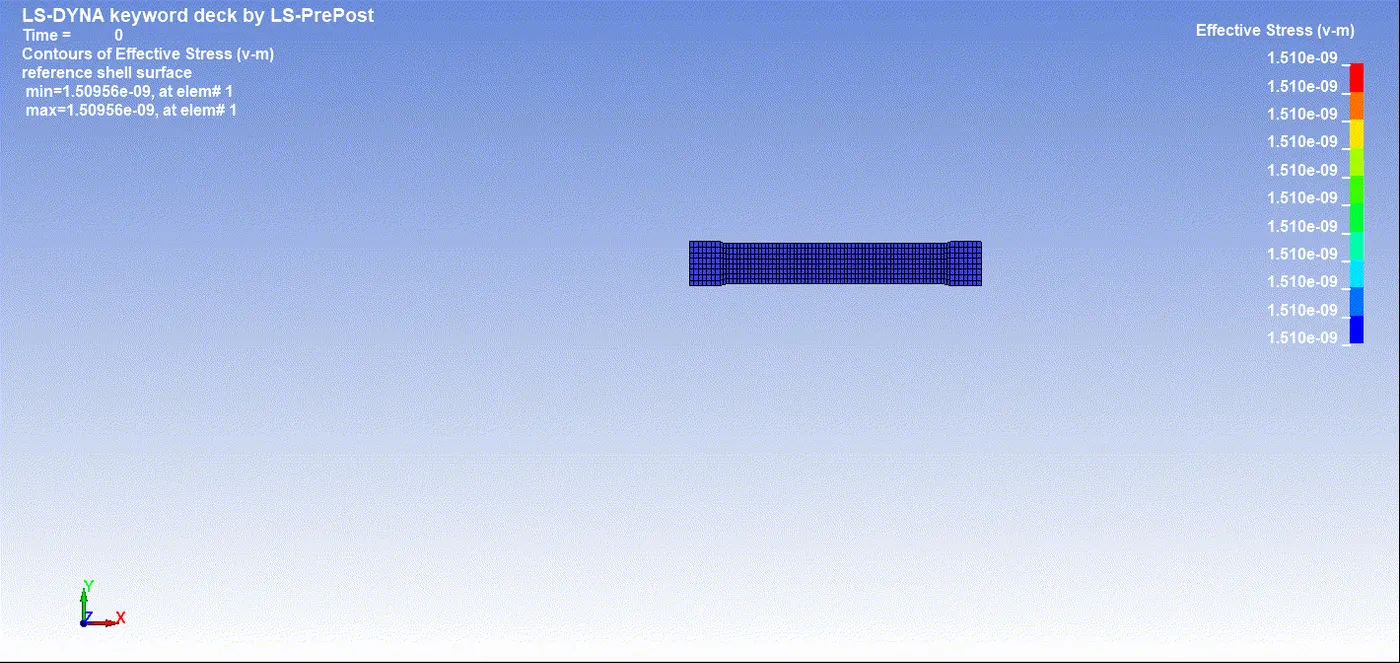
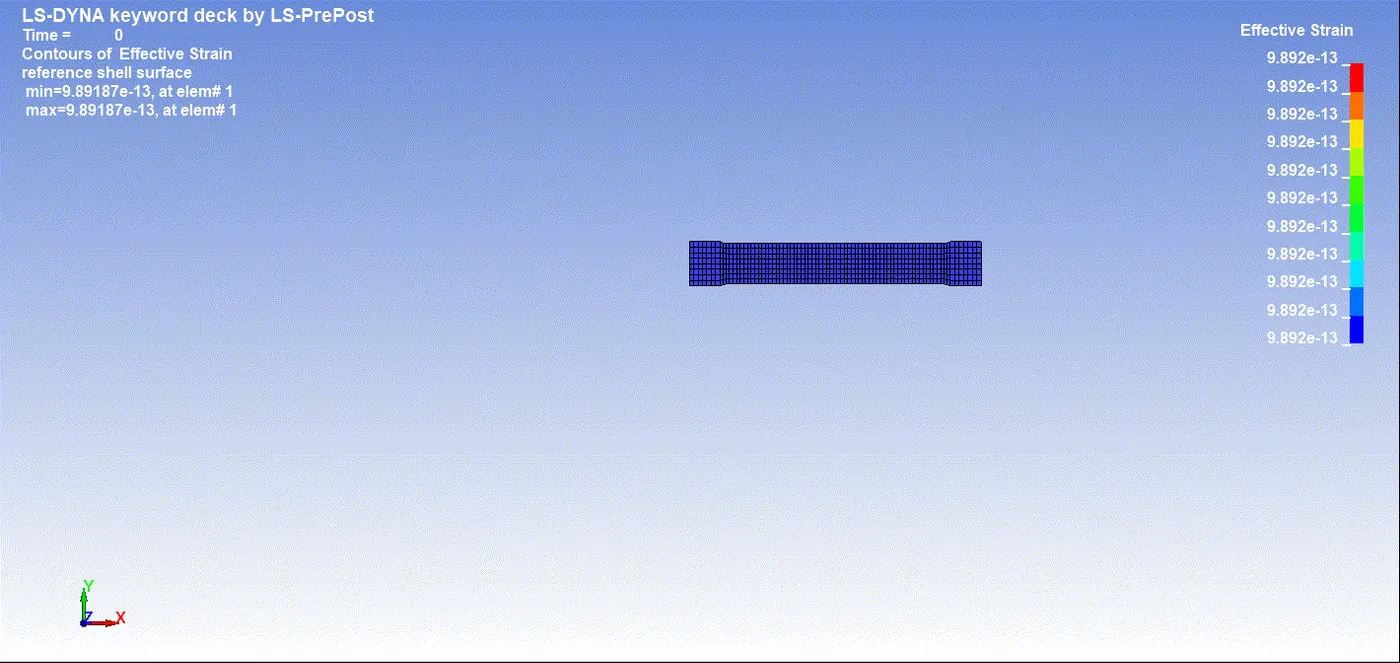
16. In the material change N = 1 to N = 2 and run the simulation. Contour Von mises stress and effective plastic strain.
Max Vin mises stress = 0.0205755 gm/mm*ms^2.
Maximum Effective Plastic Strain = 0.0112038
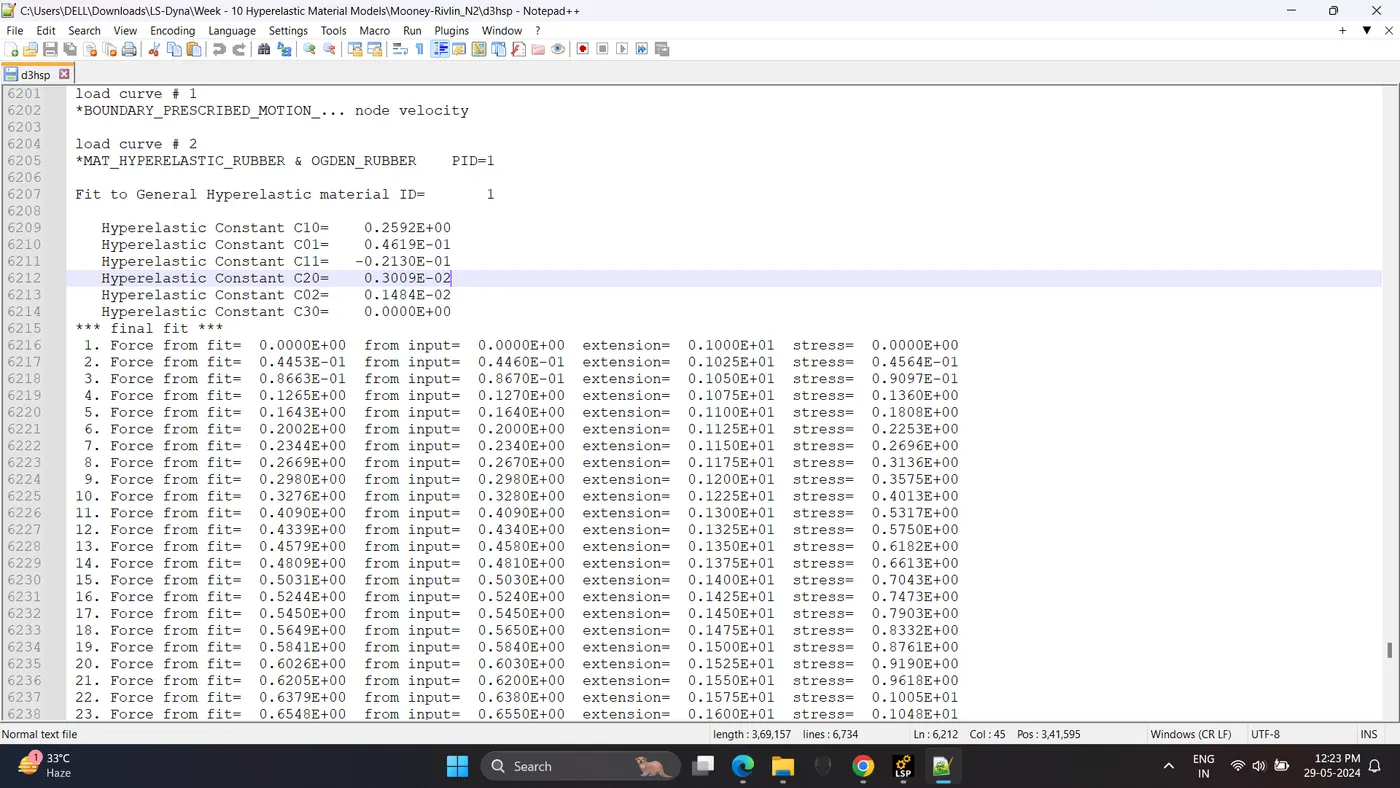
17. To find out hyperelastic constants in simulated open d3hsp file in Notepad++.
Mooney ConstantHyperelastic Constant C10= 0.2592E+00
Hyperelastic Constant C01= 0.4619E-01
Hyperelastic Constant C11= -0.2130E-01
Hyperelastic Constant C20= 0.3009E-02
Hyperelastic Constant C02= 0.1484E-02
Hyperelastic Constant C30= 0.0000E+00
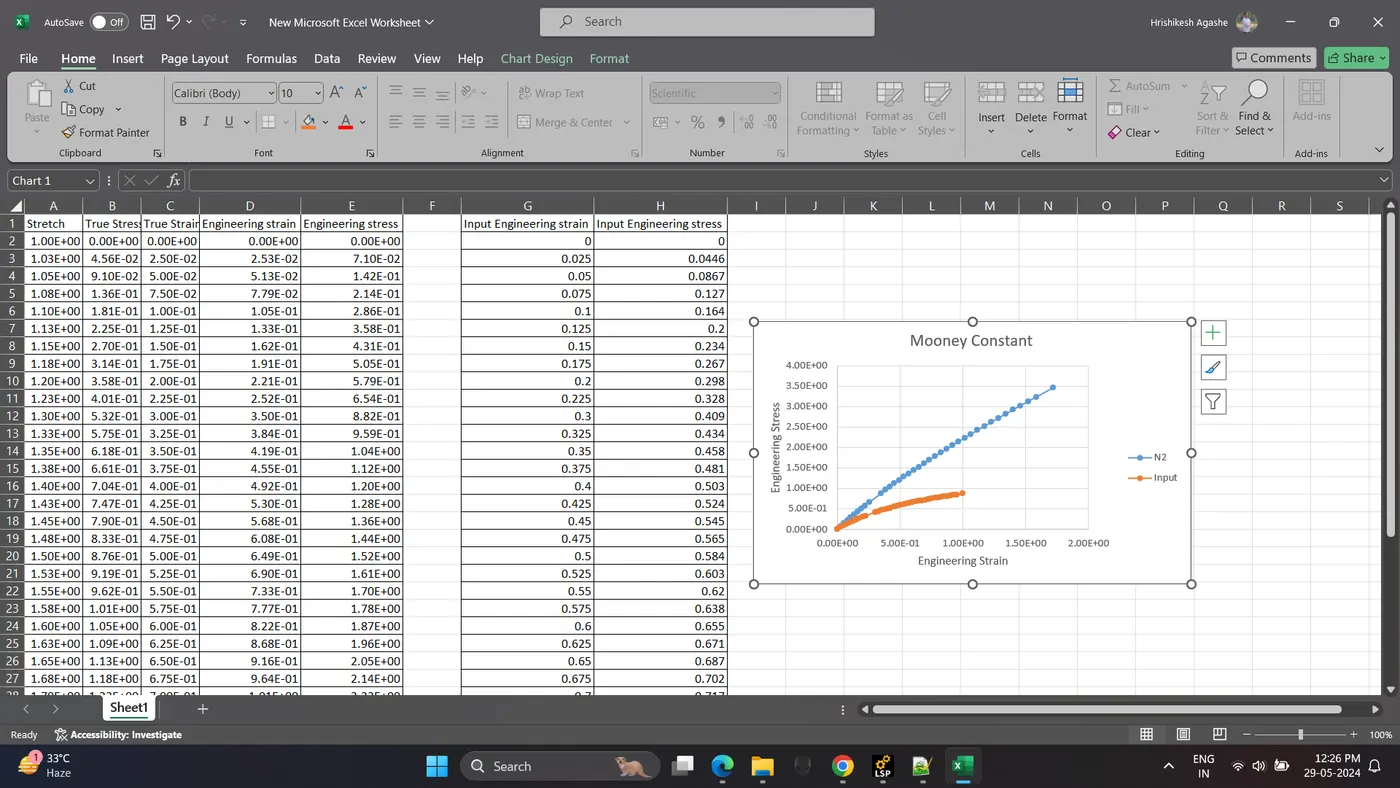
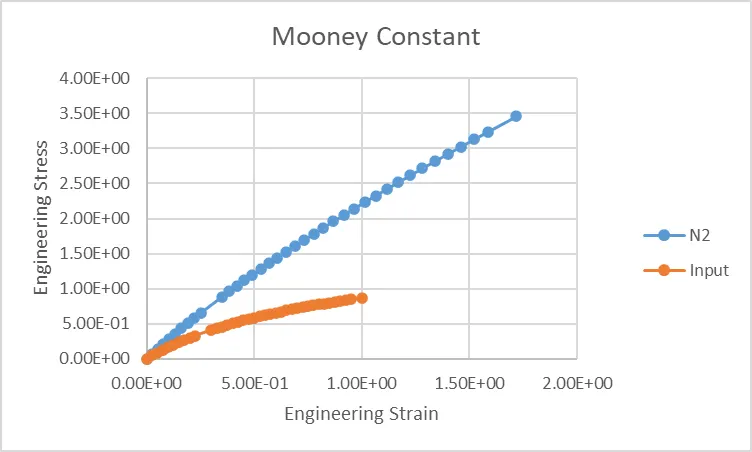
18. Copy the extention (stretch) and stress data from d3hsp file to excel and plot the comparison graph
Convert the data to Engineering stress and Engineering strain.
19. In the material change N = 2 to N = 3 and run the simulation. Contour Von mises stress and effective plastic strain.
Max Vin mises stress = 0.0205721 gm/mm*ms^2.
Maximum Effective Plastic Strain = 0.0112038
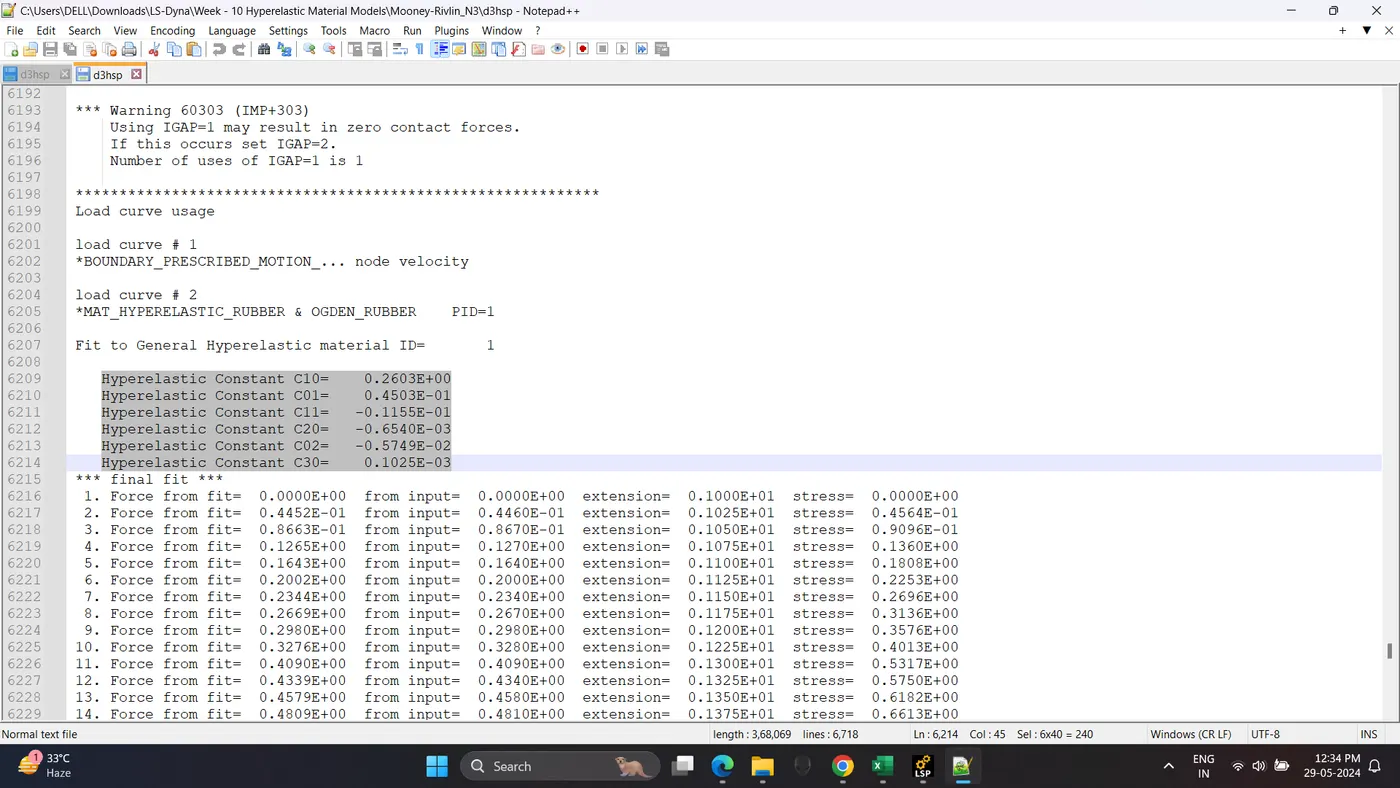
20. To find out hyperelastic constants in simulated open d3hsp file in Notepad++.
Hyperelastic Constant C10= 0.2603E+00
Hyperelastic Constant C01= 0.4503E-01
Hyperelastic Constant C11= -0.1155E-01
Hyperelastic Constant C20= -0.6540E-03
Hyperelastic Constant C02= -0.5749E-02
Hyperelastic Constant C30= 0.1025E-03
21. Copy the extention (stretch) and stress data from d3hsp file to excel and plot the comparison graph
Convert the data to Engineering stress and Engineering strain.
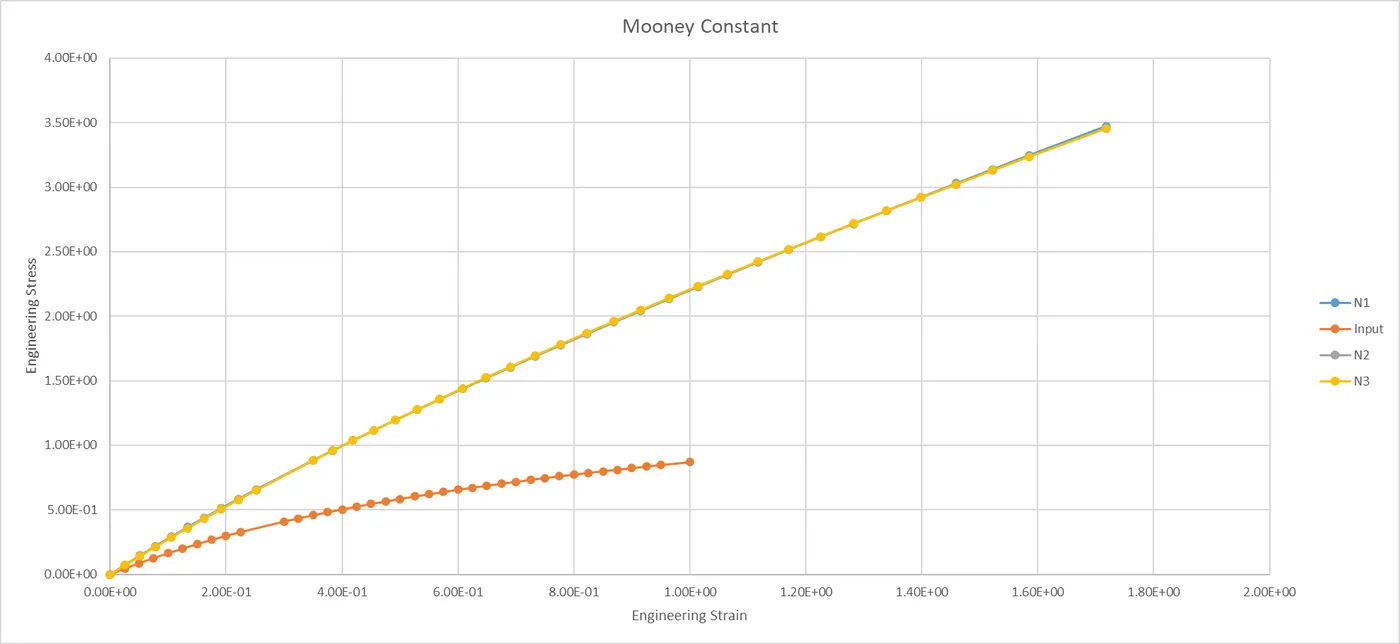
22. Plot all the three comparison in one graph.
It is seen all the cases are similar to each other. N3 is looking little more closer.
Odgen Material Constant
1. Delete the 077_H-HYPERELASTIC_RUBBER and Create 077_O-HYPERELASTIC_RUBBER Material.
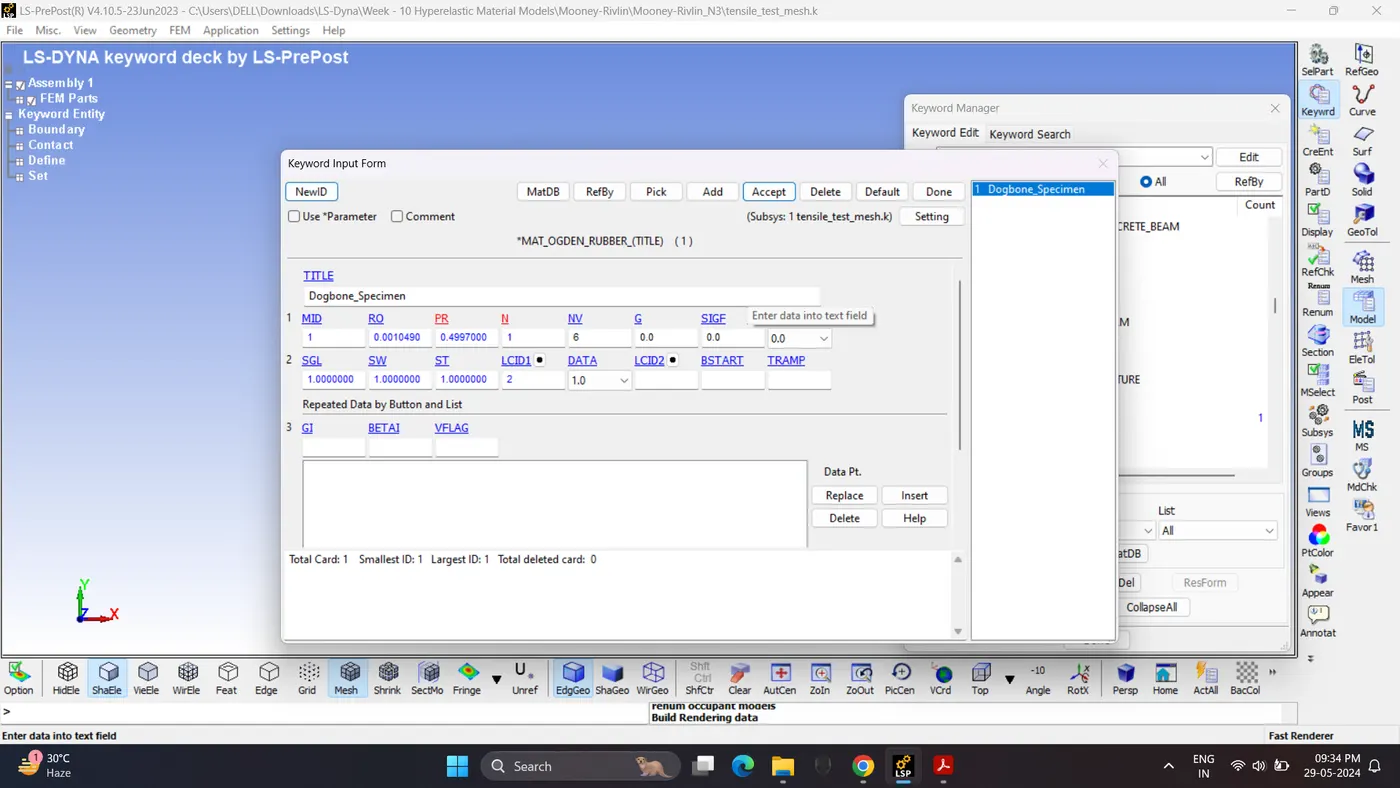
2. Save the model and run the Simulation. Open LS_Run - Select File - Click Add job to local queue.
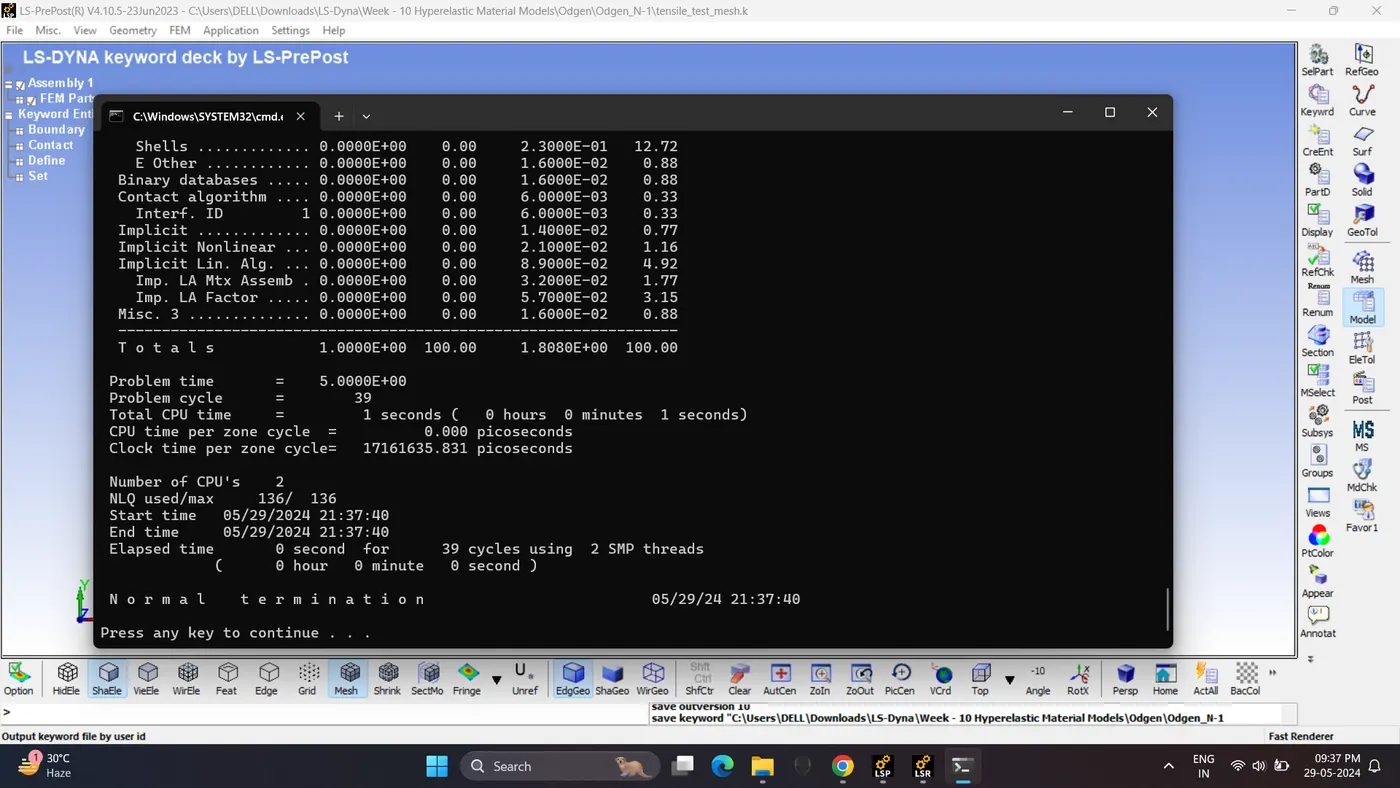
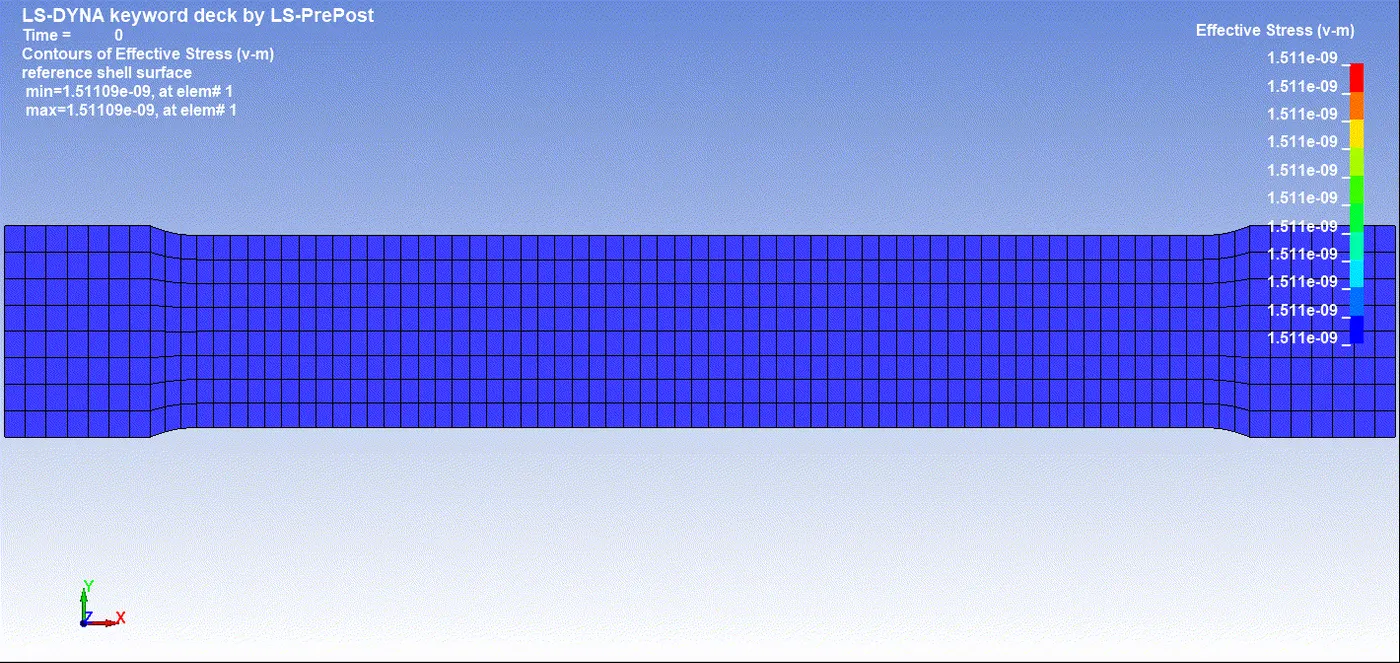
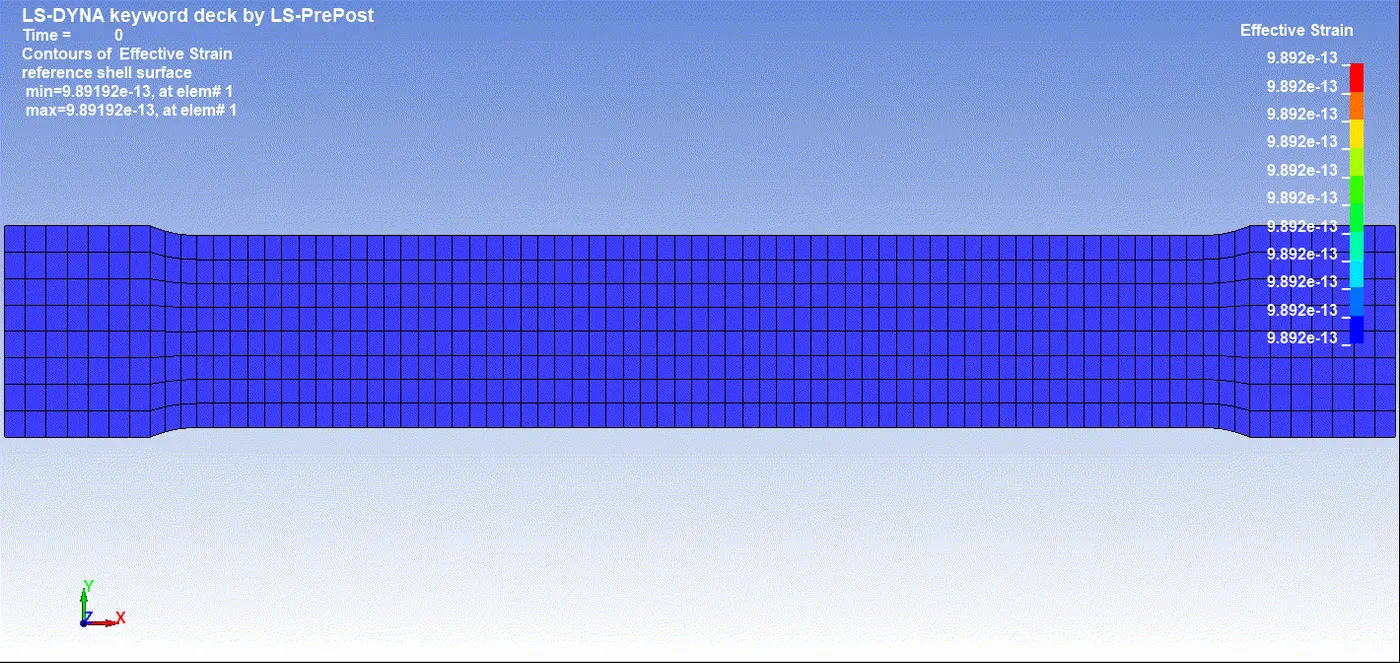
3. Open the Keyword and D3_plot in Ls-PrePost. Play the simulation and contour the von mises stress and effective strain.
Max Vin mises stress = 0.0205935 gm/mm*ms^2.
Maximum Effective Plastic Strain = 0.0112039
4. To find out ogden constants in simulated open d3hsp file in Notepad++.
Ogden Constant
mu(1)= 9.1070556680917E-01
alpha(1)= 1.3427851092734E+00
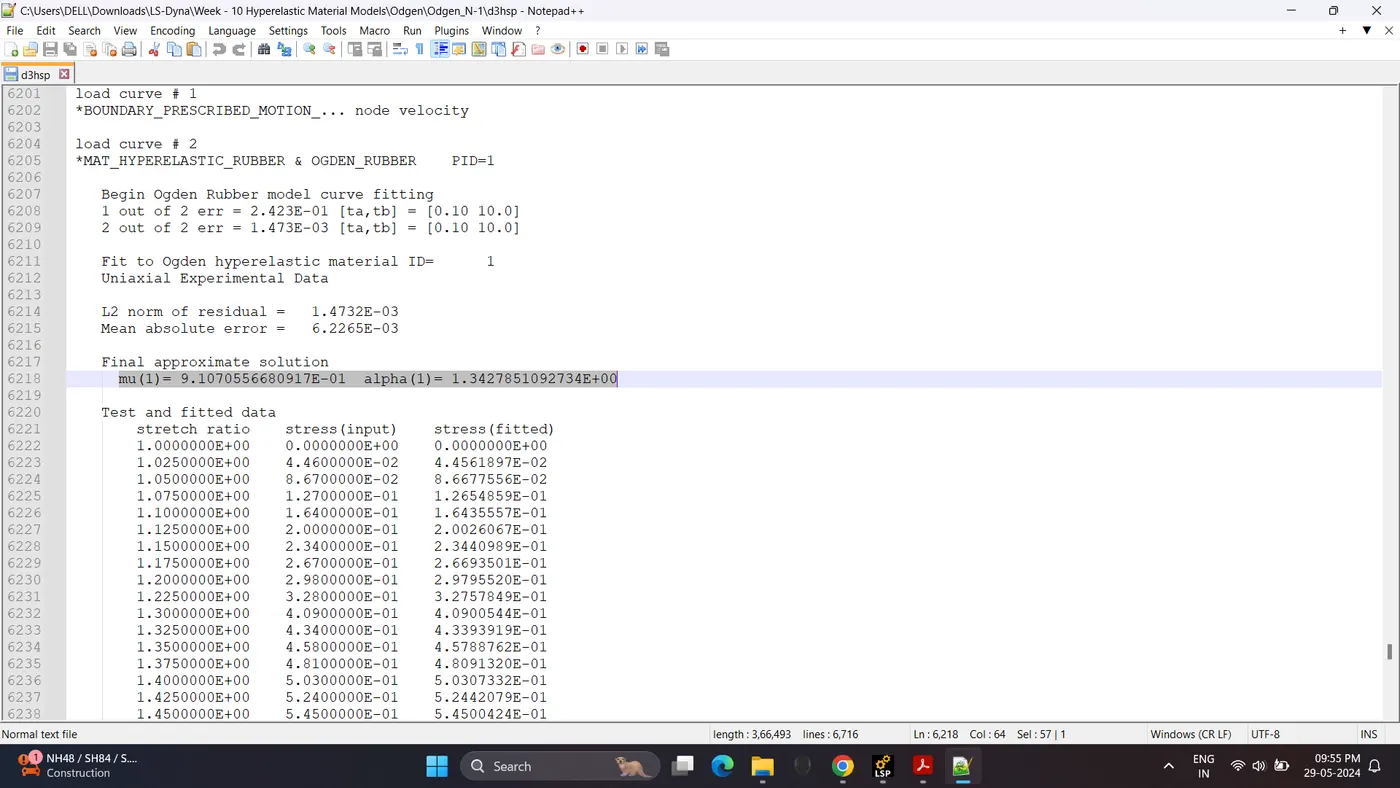
5. Copy the stretch ratio and stress data from d3hsp file to excel and plot the comparison graph
Convert the data to Engineering stress and Engineering strain.
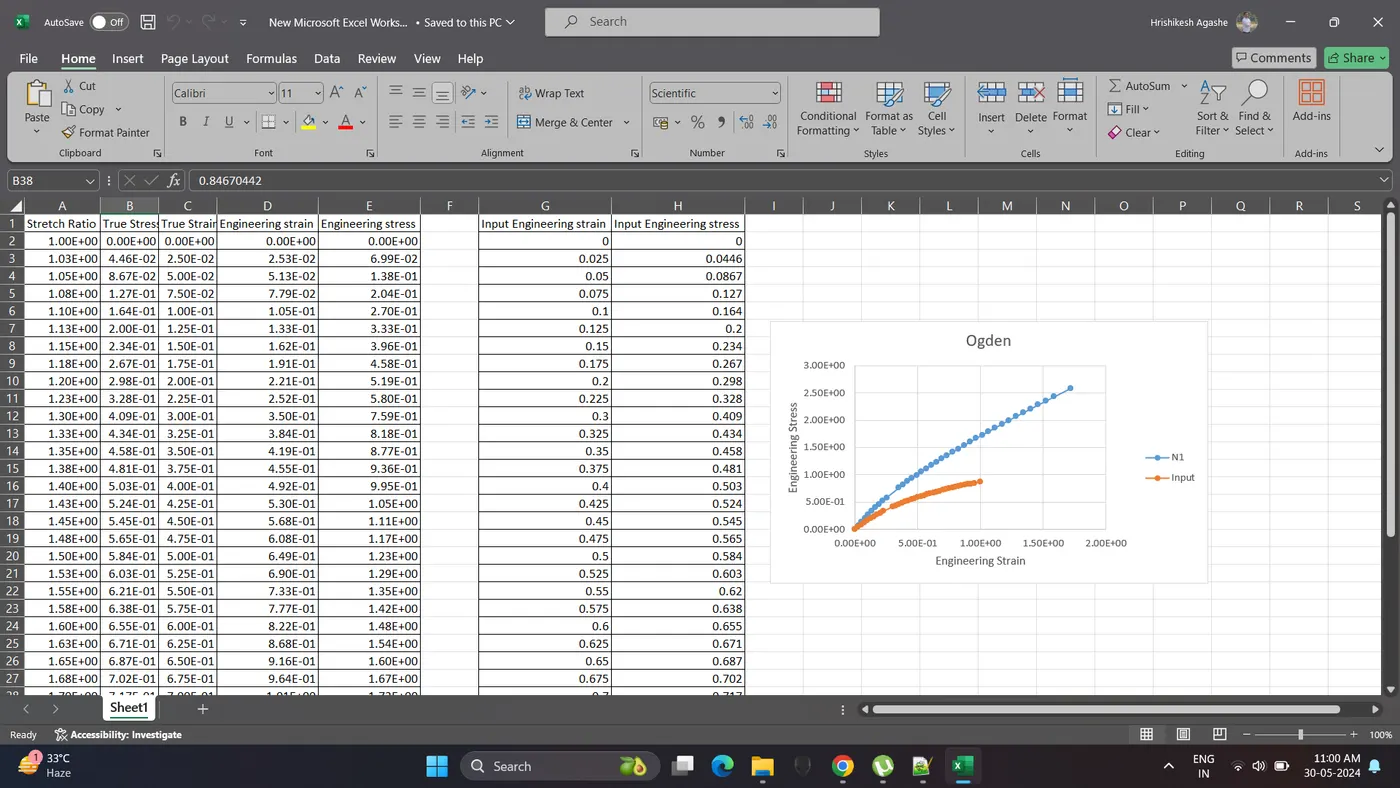
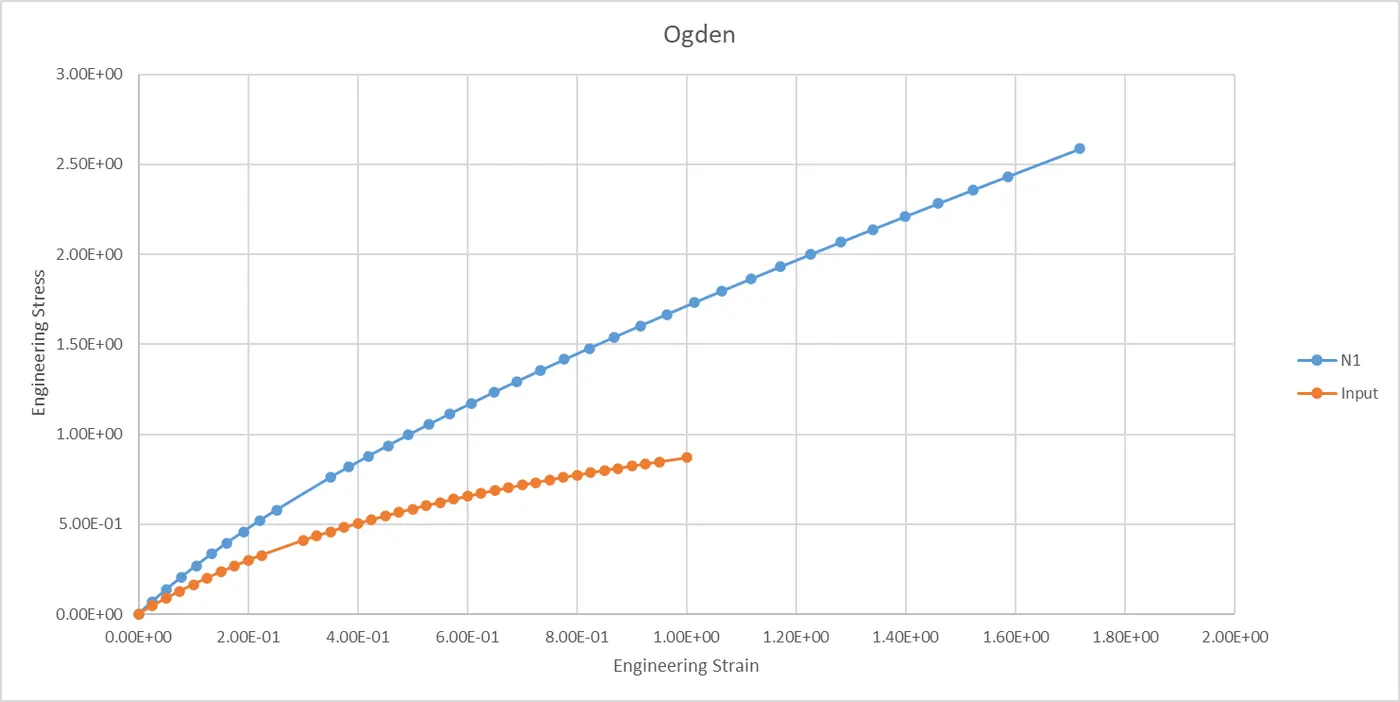
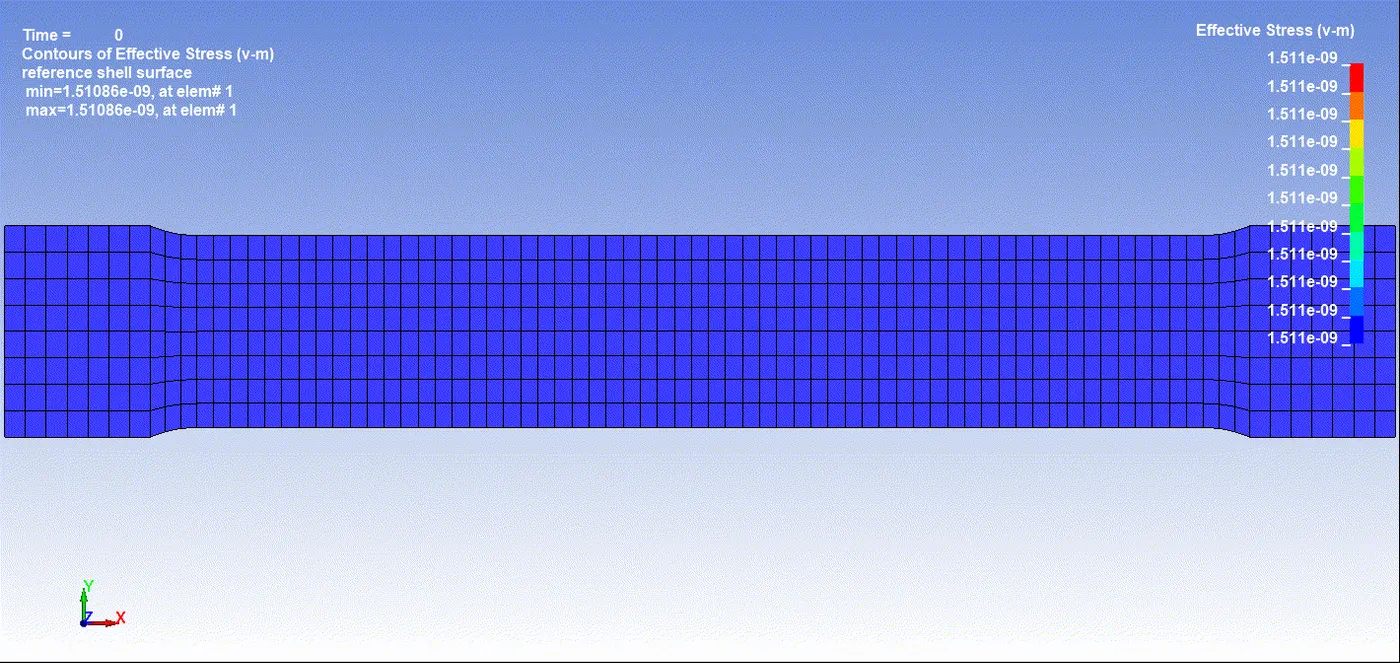
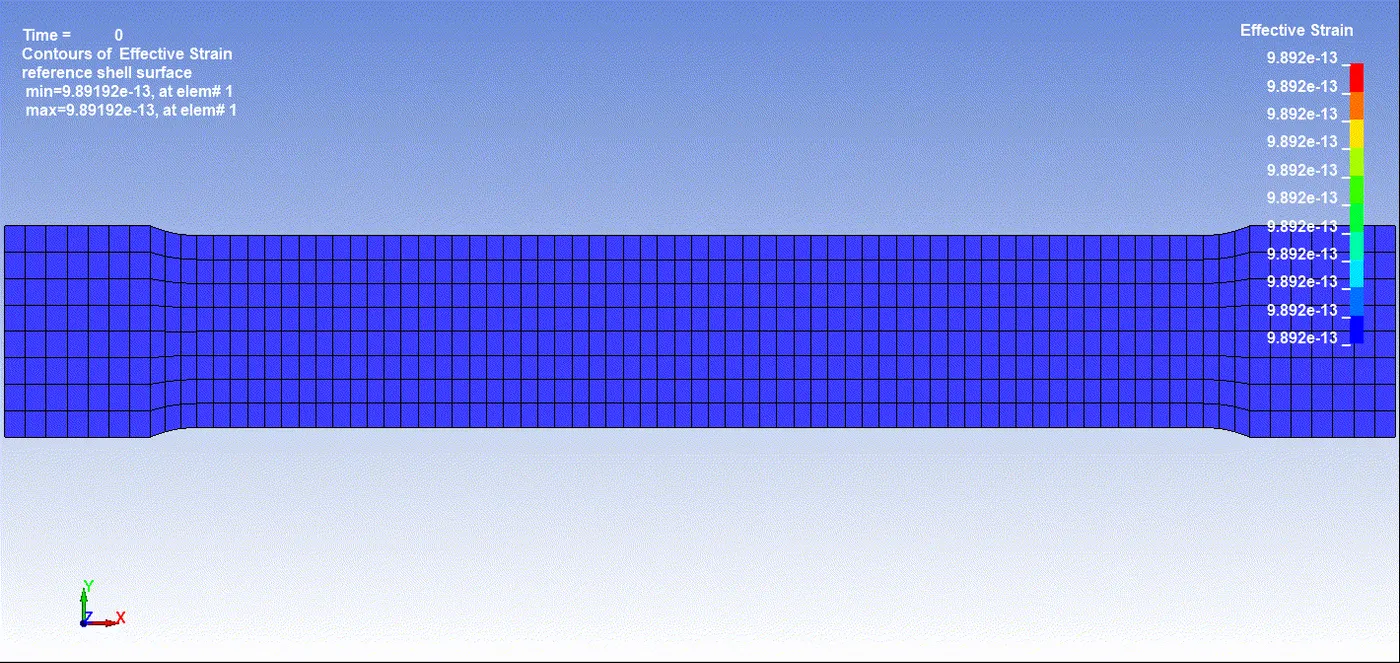
6. In the material change N = 1 to N = 2 and run the simulation. Contour Von mises stress and effective plastic strain.
Max Vin mises stress = 1.13294 E-08 gm/mm*ms^2.
Maximum Effective Plastic Strain = 6.16619 E-09
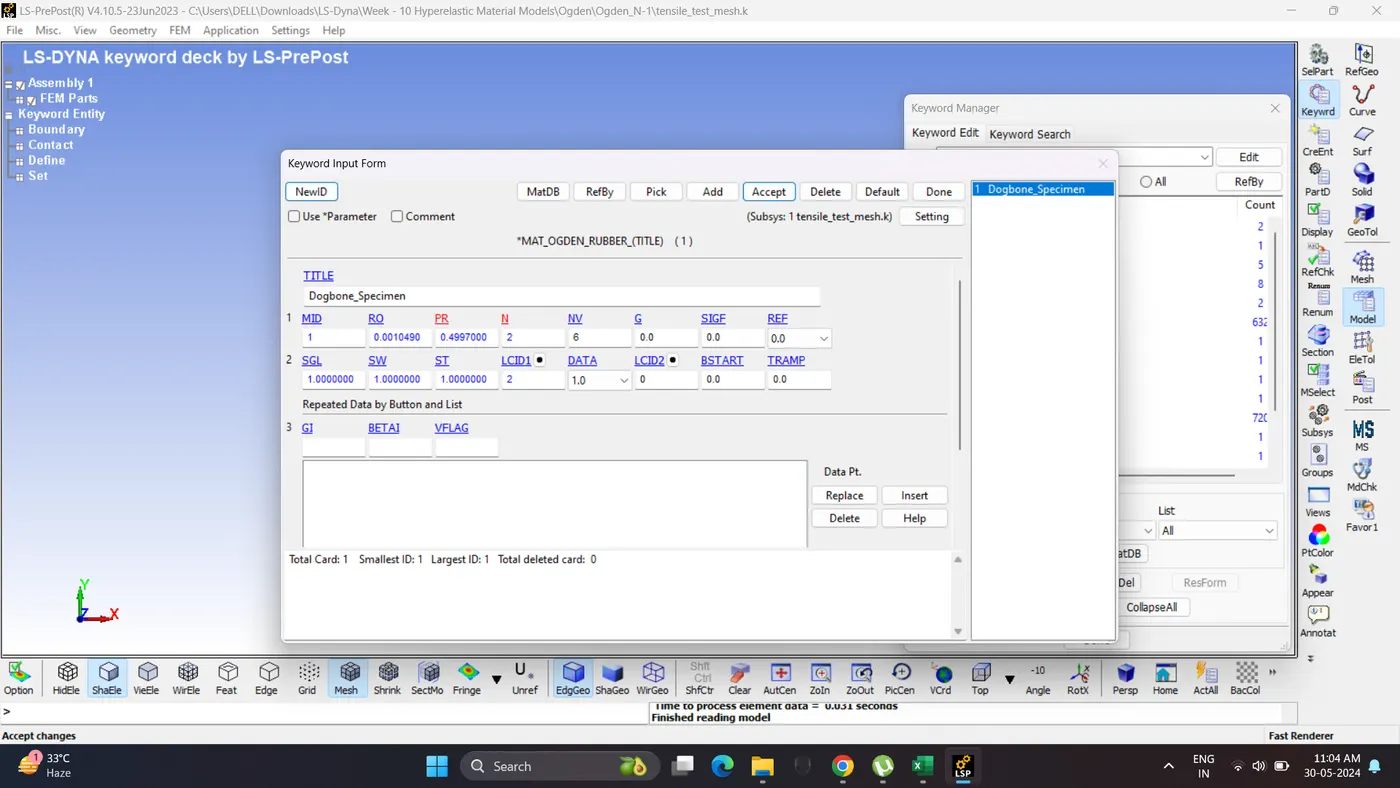
7. To find out ogden constants in simulated open d3hsp file in Notepad++.
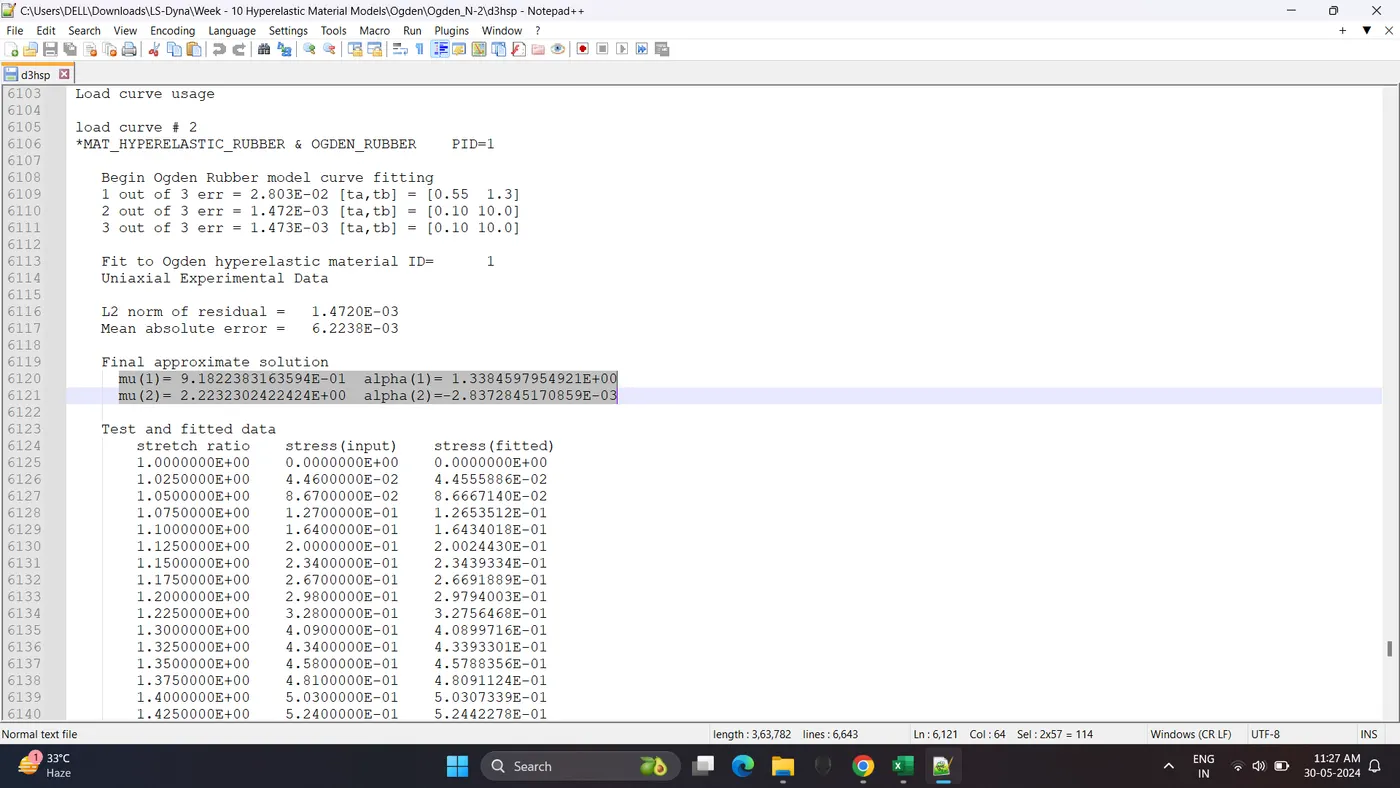
Ogden Constant
mu(1)= 9.1822383163594E-01 alpha(1)= 1.3384597954921E+00
mu(2)= 2.2232302422424E+00 alpha(2)=-2.8372845170859E-03
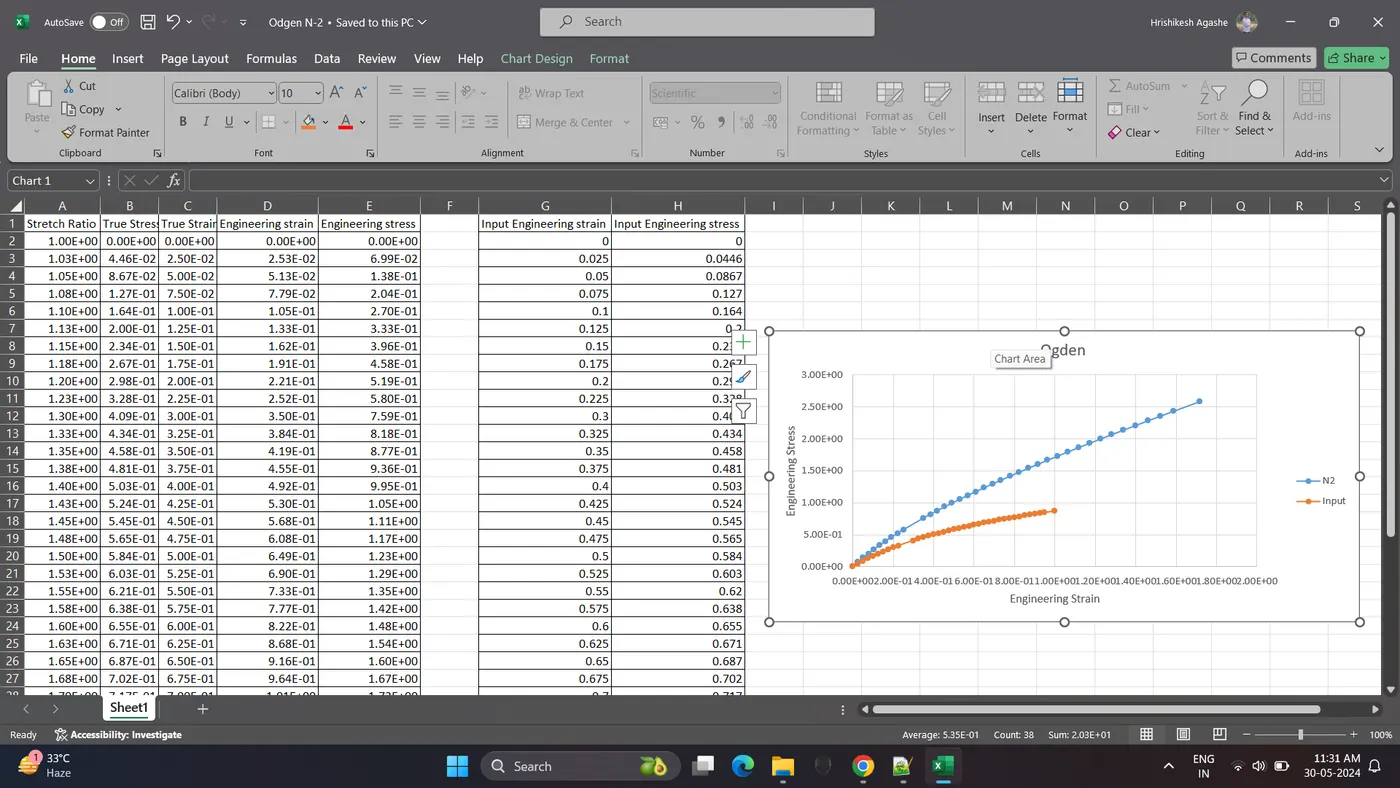
8. Copy the stretch ratio and stress data from d3hsp file to excel and plot the comparison graph
Convert the data to Engineering stress and Engineering strain.
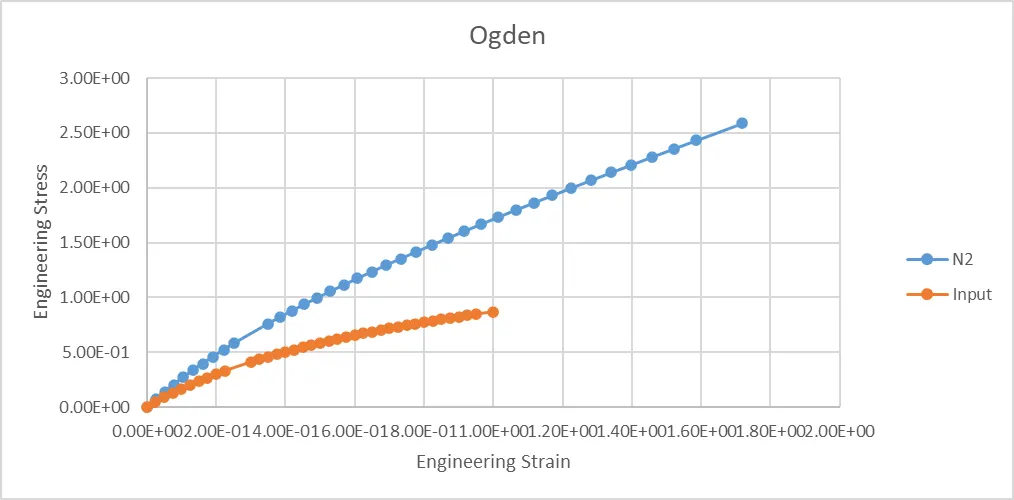
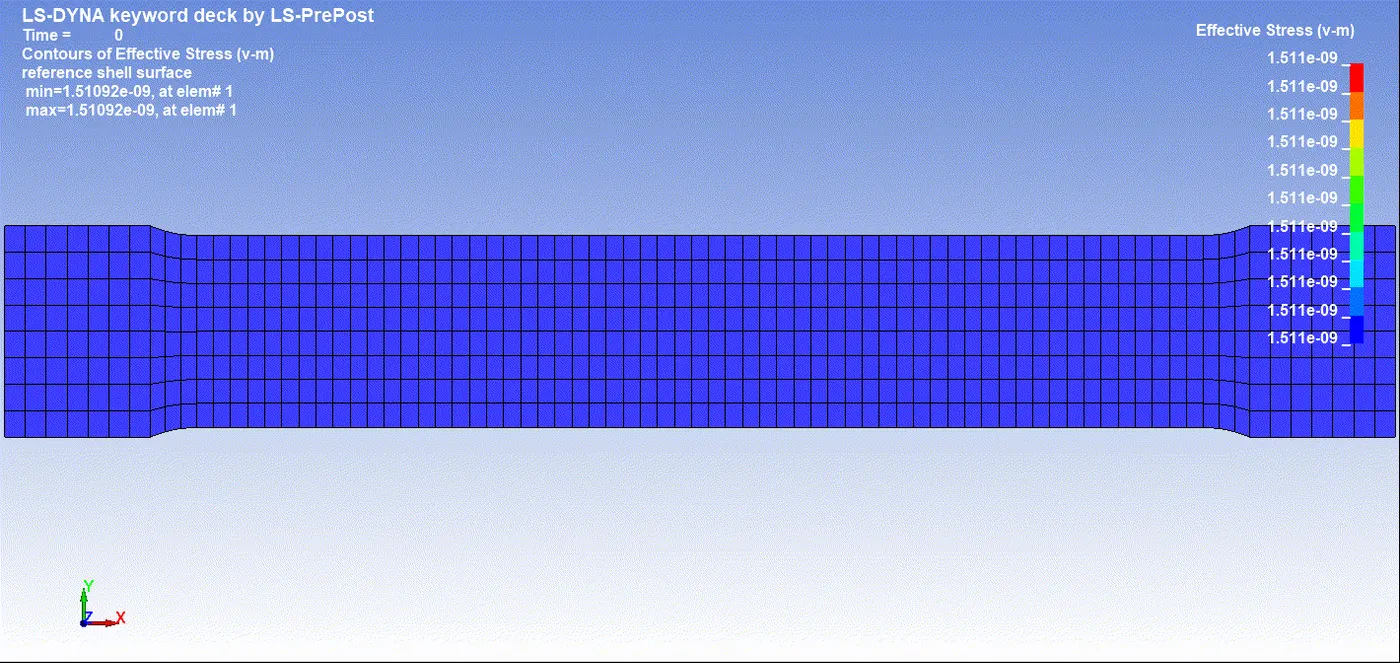
9. In the material change N = 2 to N = 3 and run the simulation. Contour Von mises stress and effective plastic strain.
Max Vin mises stress = 1.31872 E-08 gm/mm*ms^2.
Maximum Effective Plastic Strain = 7.14843 E-09
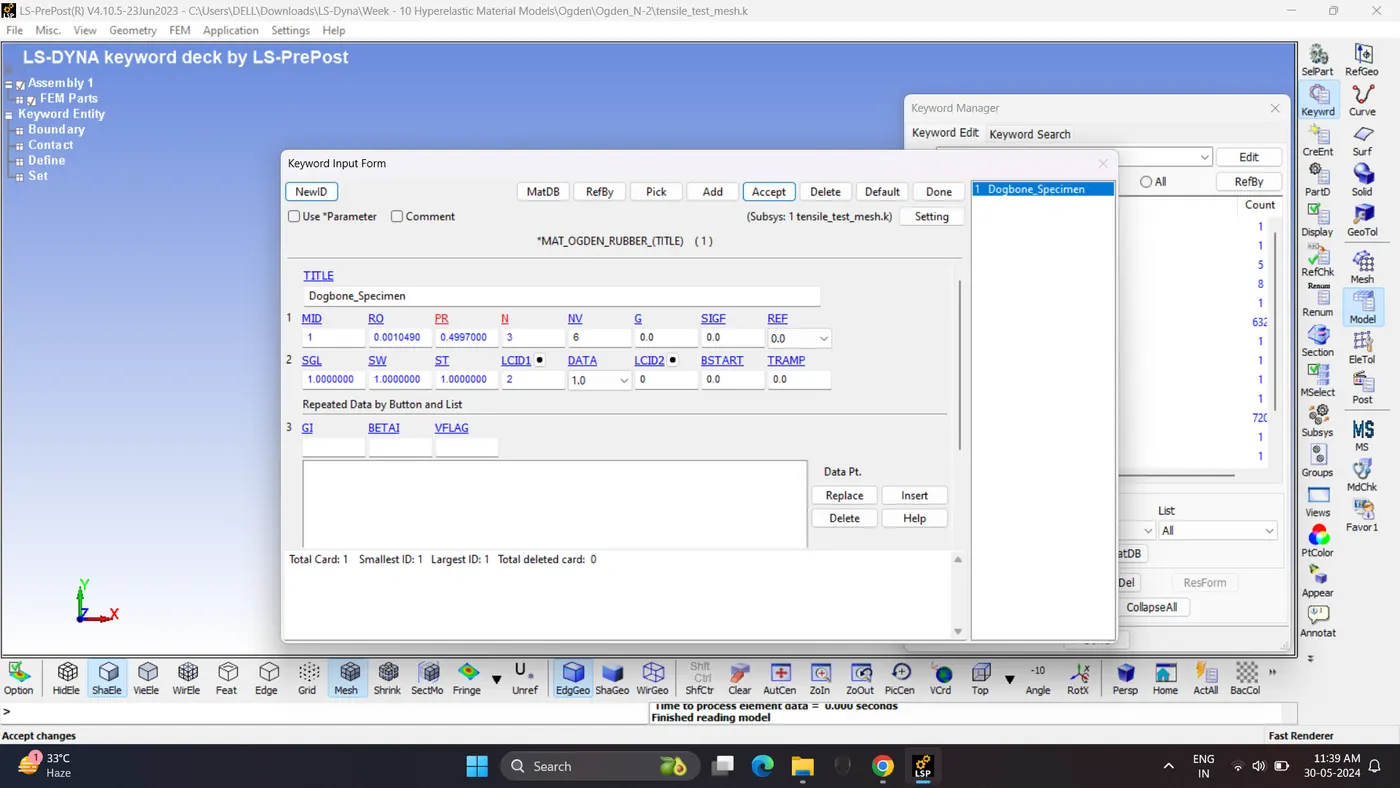
10. To find out ogden constants in simulated open d3hsp file in Notepad++.
Ogden Constant
mu(1)=-3.2332419081357E-02 alpha(1)= 1.9388192445342E+00
mu(2)= 2.6283520228266E-01 alpha(2)= 1.5475147476077E+00
mu(3)= 6.7982524293466E-01 alpha(3)= 1.2925247293290E+00
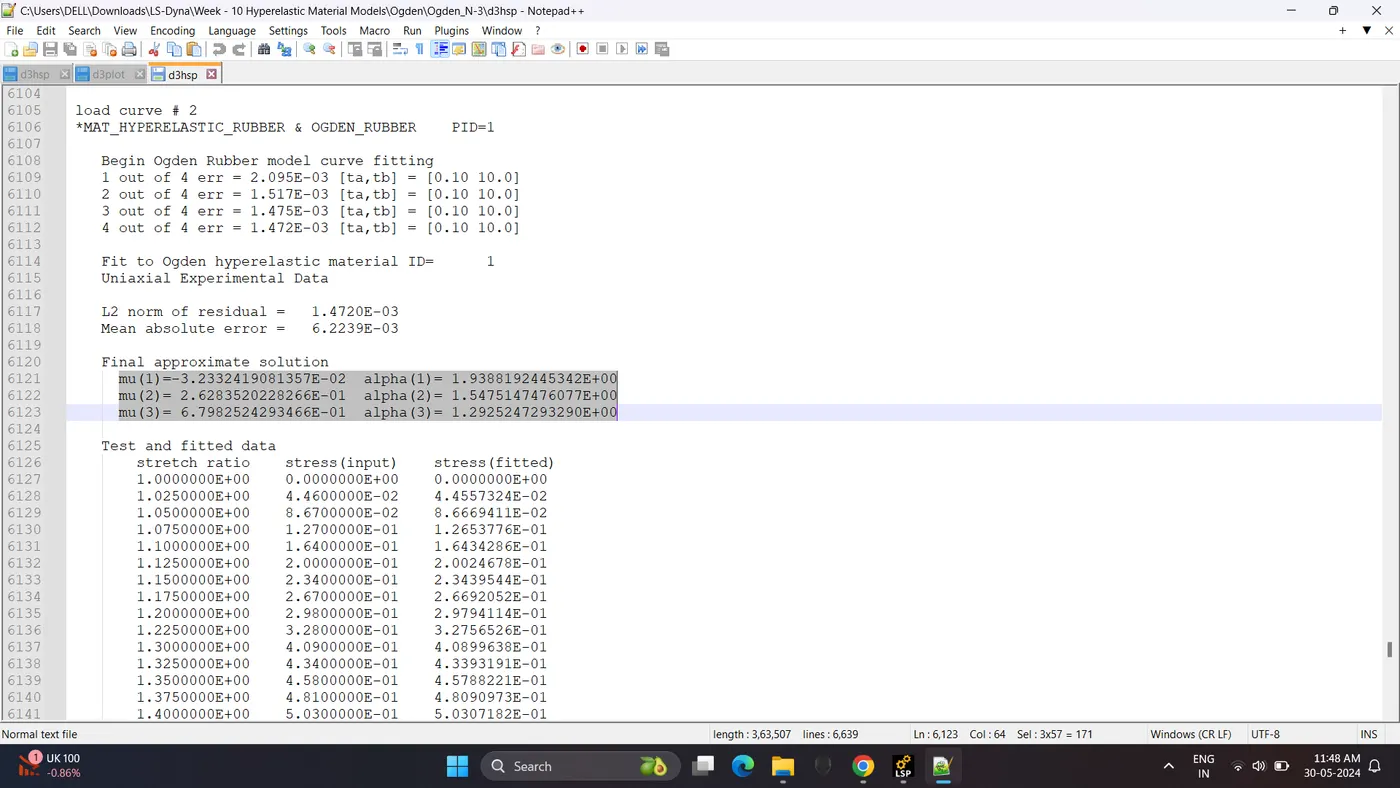
11. Copy the stretch ratio and stress data from d3hsp file to excel and plot the comparison graph
Convert the data to Engineering stress and Engineering strain.
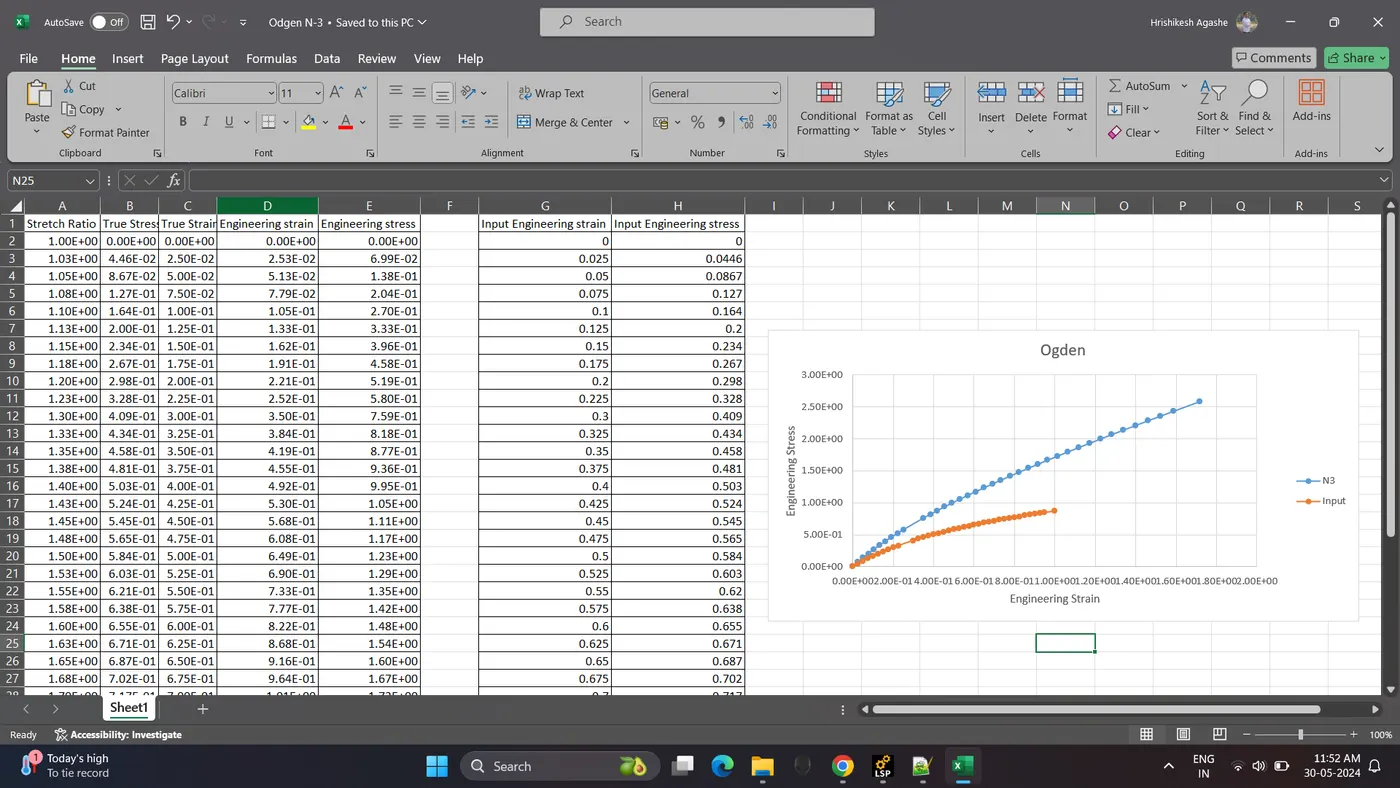
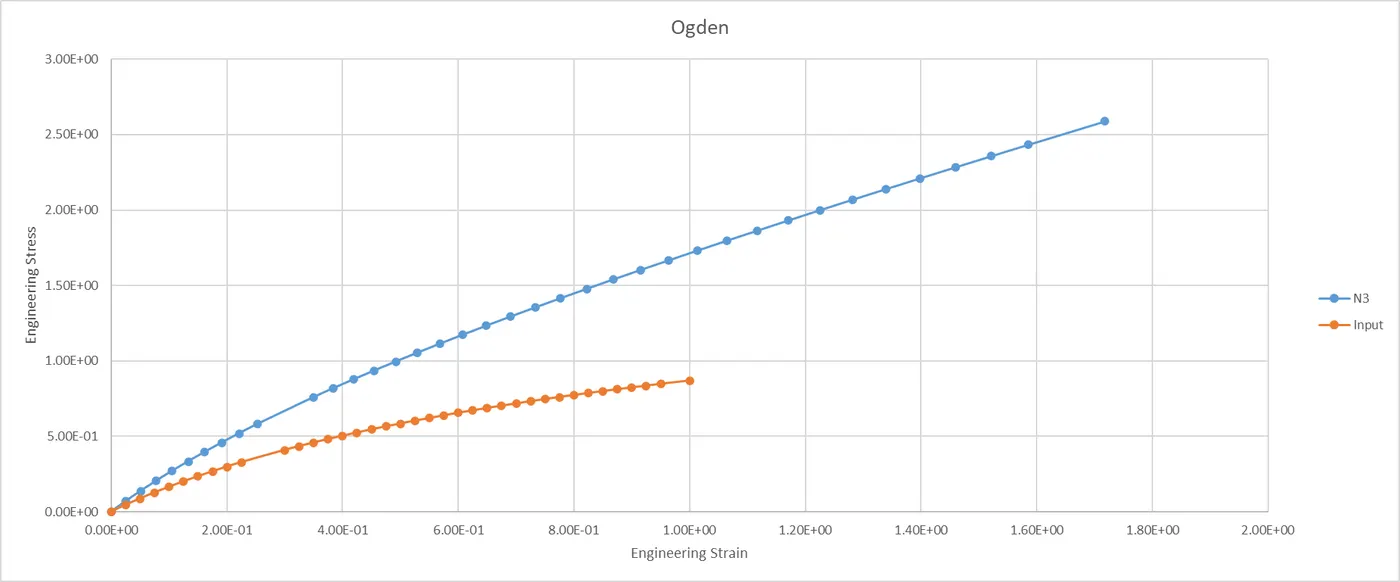
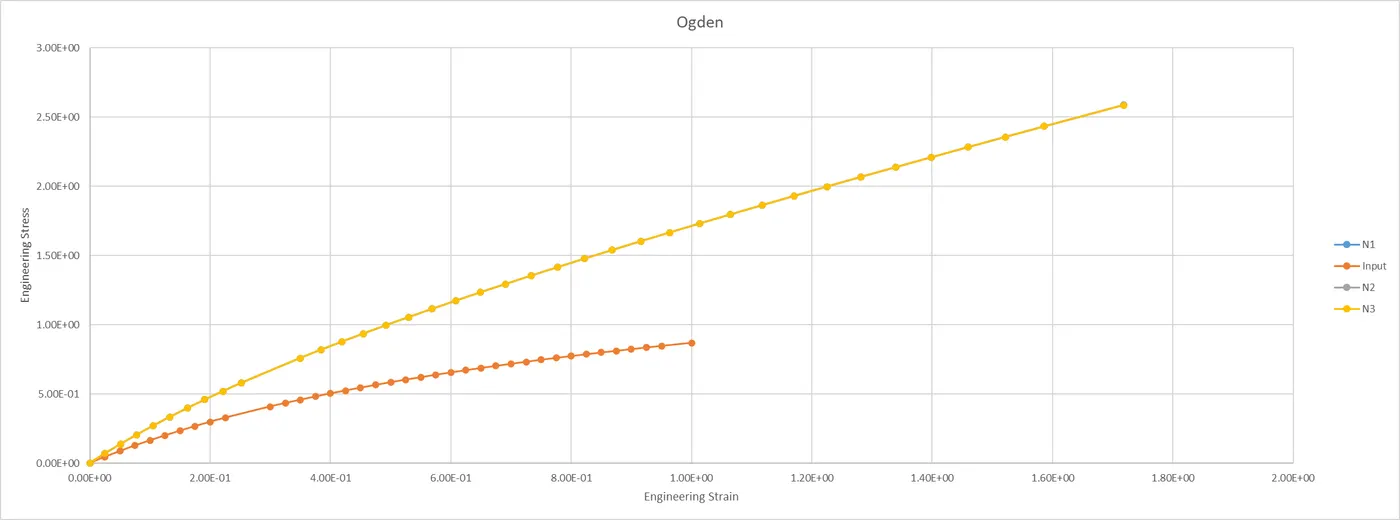
13. Plot all the three comparison in one graph.
It is seen all the cases are similar to each other. N3 is looking little more closer.
Comparison of Mooney rivin and Ogden Engineering Stress vs Engineering Strain.
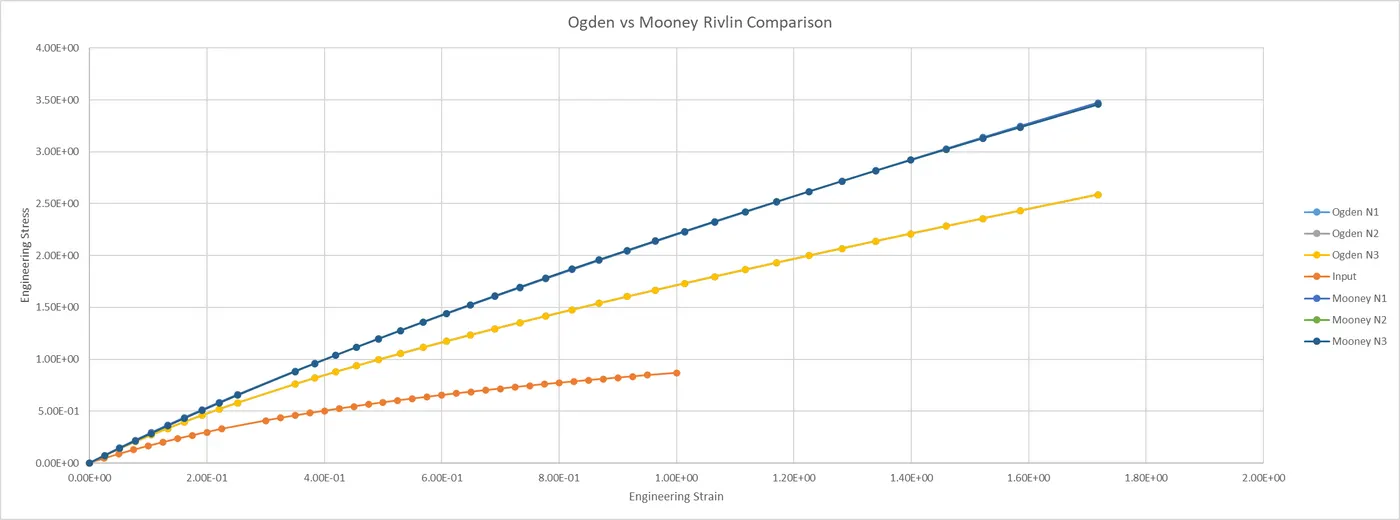
By comparing raw data with 077_H-HYPERELASTIC_RUBBER model and 077_O-HYPERELASTIC_RUBBER material model we can say that,
1. During same material at different N all the output curve comes Identically.
2. As per the above graph it is seen that 77_O-HYPERELASTIC_RUBBER is suitable for this Model.
3. For Better accuracy in 77_O-HYPERELASTIC_RUBBER N2 and N3 are recommended to use.
Constant for N2
mu(1)= 9.1822383163594E-01 alpha(1)= 1.3384597954921E+00
mu(2)= 2.2232302422424E+00 alpha(2)=-2.8372845170859E-03
Constant for N3
mu(1)=-3.2332419081357E-02 alpha(1)= 1.9388192445342E+00
mu(2)= 2.6283520228266E-01 alpha(2)= 1.5475147476077E+00
mu(3)= 6.7982524293466E-01 alpha(3)= 1.2925247293290E+00
Conclusion:
Material modelling from the data given and calculation of Money-Rivlin and Ogden material constants and comparison them using stress-strain data are done Successfully.