Week - 10 Hyperelastic Material Models
Aim:-
To calculate theMooney Rivlin and Ogden material constants from the material data and validate them using stress-strain data from the tensile test of a dogbone specimen.
Theory-
- Hyper elastic materials are the material which has the capability to stretch with more than 100 % strain without any sort of failure.
- These material are hard to replicate as the strain value are high. These materials have Poisson’s ratio of almost 0.5. Although keeping 0.5 poisson’s ratio creates instability so for simulation purpose the value is assigned that is almost equal to 0.5 but not 0.5 like 0.4999, 0.4995 etc
- Various material models like Mooney Rivlin, Ogden, Yeoh etc are used to model these materials.
- These materials can be defined using strain energy vs stretch relations, where strain energy is the area under stress-strain graph.
- Here we will discuss modelling of Mooney Rivlin and Ogden material using the given stress strain data.
Procedure-
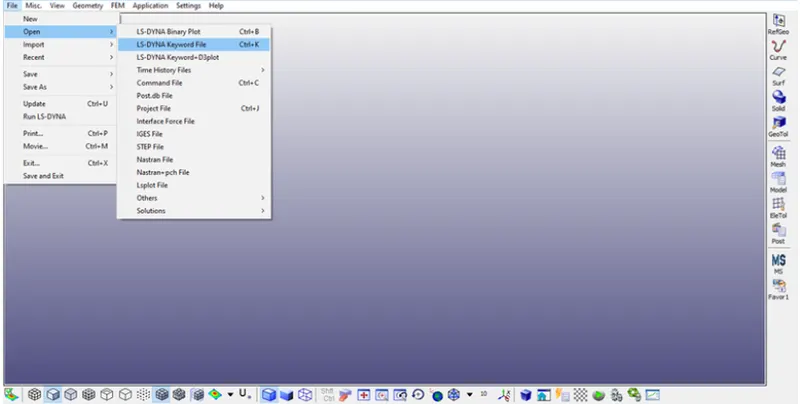
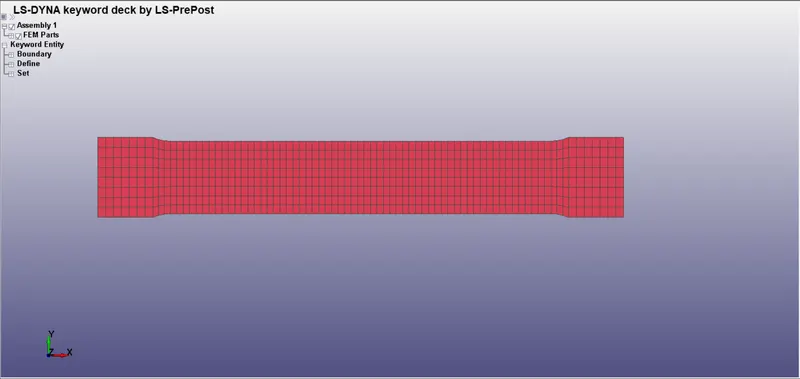
- We have to open the given LS-Dyna keyword (.k file) file in LS-PrePost, using option File>Open>LS-Dyna Keyword File as shown in below snap.
MAT 77 - Hyperelastic
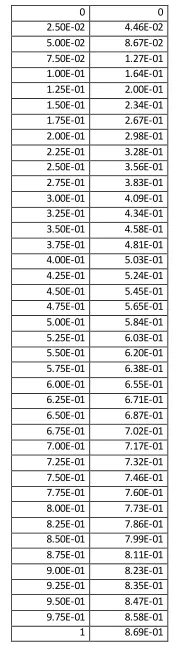
Step 1: Material test data - Engineering stress vs Engineering strain.
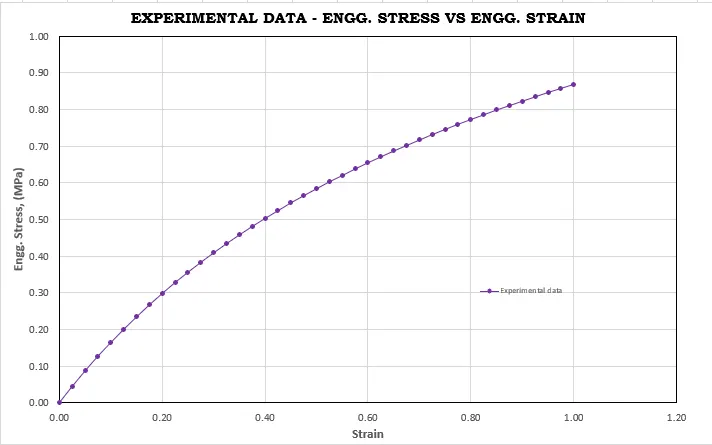
- Now from Experimental data Image we will input the given data into Excel and create the stress-strain curve in the excel.
Step 2:- Simulation set-up in LS Dyna.
The dogbone specimen is setup for the tensile test simulation in LS-Dyna as shown below.
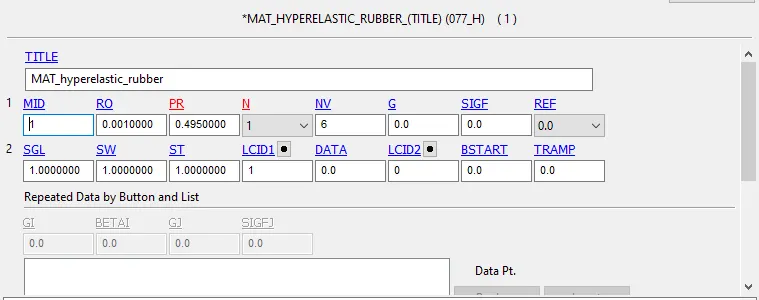
The Hyperelastic material card MAT_77 is assigned to the model, with N = 1, and the values of RO and PR as shown below.
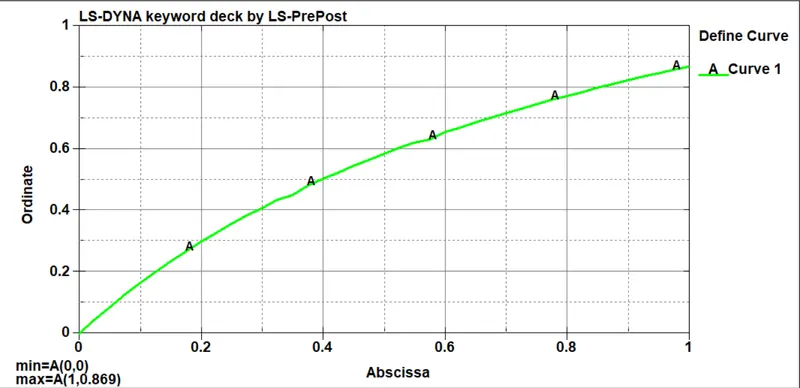
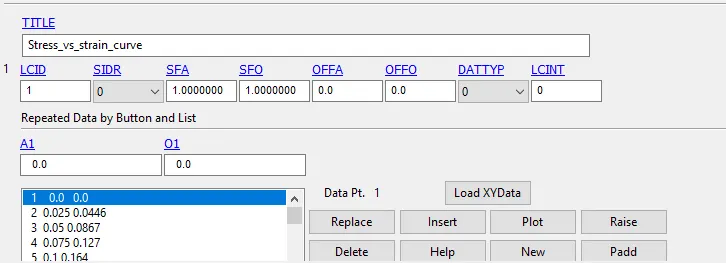
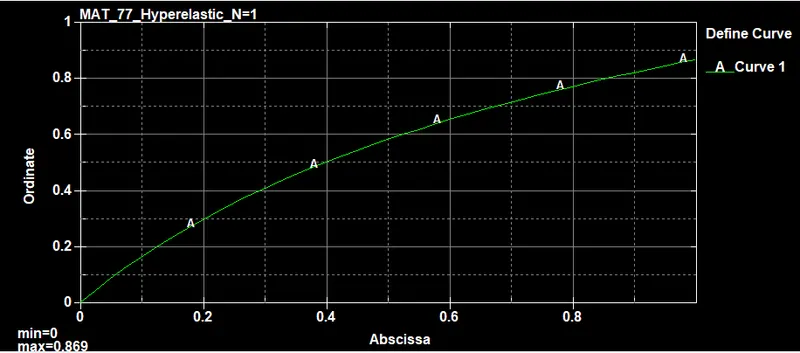
A curve is defined with the stress - strain data from excel, as shown below, and is assigned to the LCID shown above.
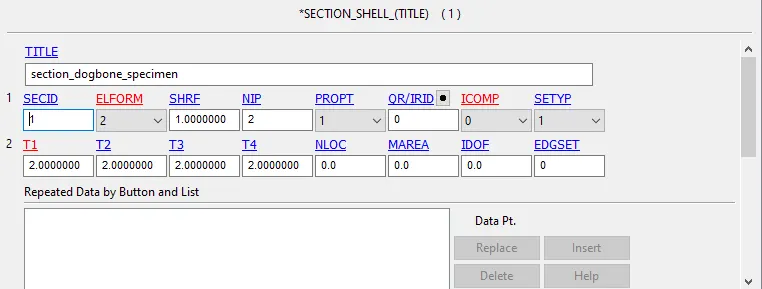
The section with a thickness of 2mm and ELFORM 2 is assigned to the specimen.
The section and the material are assigned to the part as shown below.
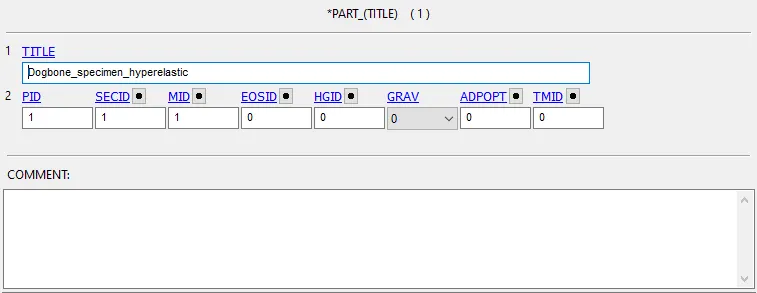
Step 3: Boundary conditions - SPC and Prescribed motion
The nodes on the left-edge are constrained from motion in the X and Z directions.
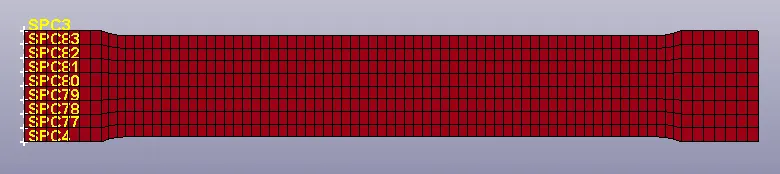
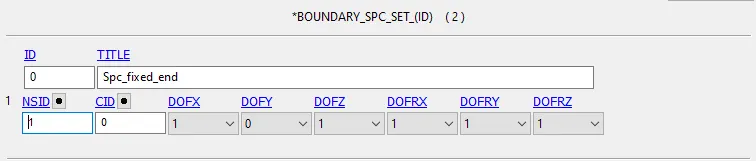
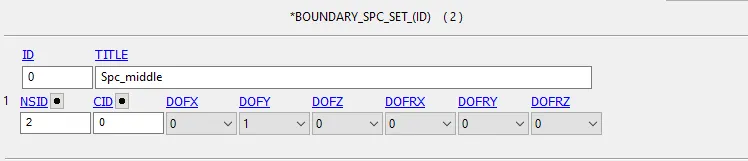
The middle nodes on either end are constrained from motion in the Y direction, since there is an elongation in the lateral direction during the tensile test.
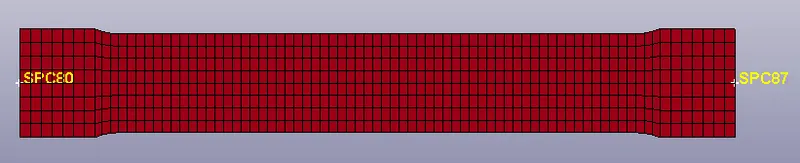
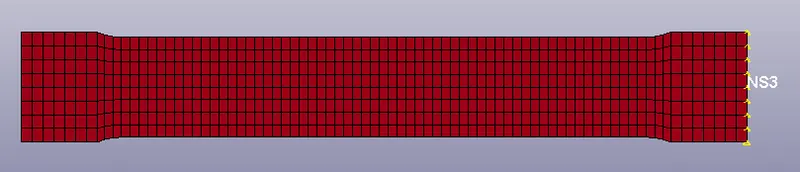
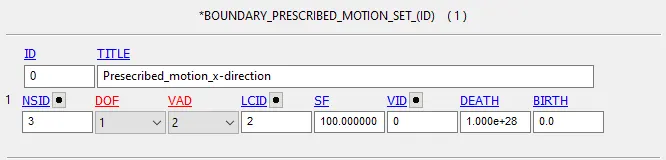
The nodes on the right edge are given a prescribed motion in the X - direction.
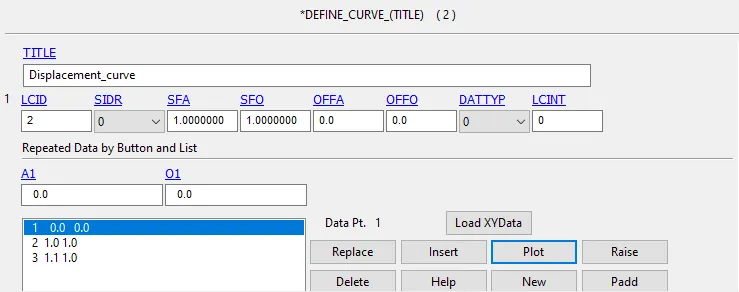
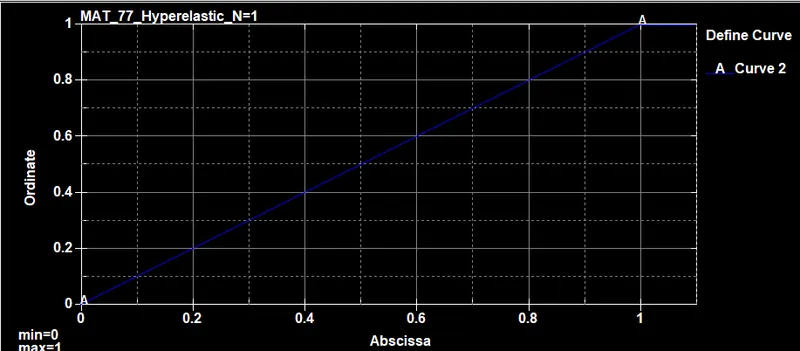
A curve is defined with the motion required and assigned to the LCID shown above.
Step 4:- Control cards
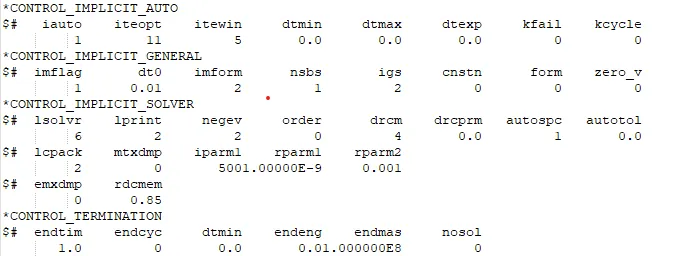
The tensile test is considered to be a quasi-static analysis. Therefore an implicit simulation scheme is used with the necessary control card parameters as shown below.
The model is simulated and the results can be analyzed.
Model verification
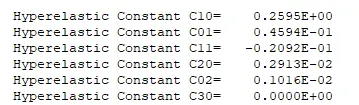
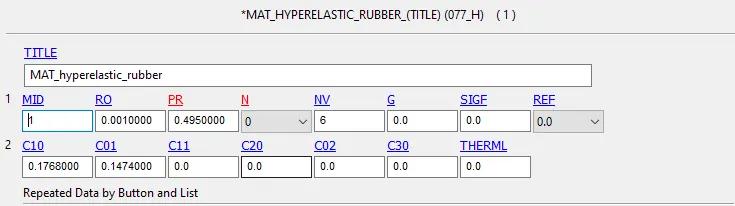
The Mooney - Rivlin constants for N=1, can be found from the d3hsp file, as shown below.

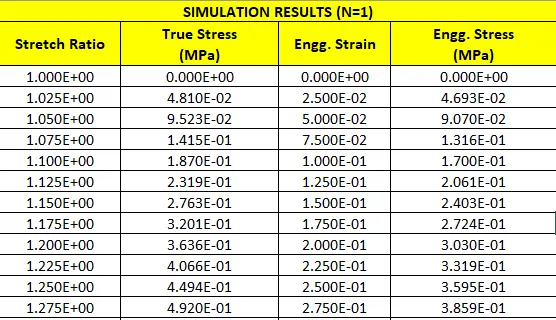
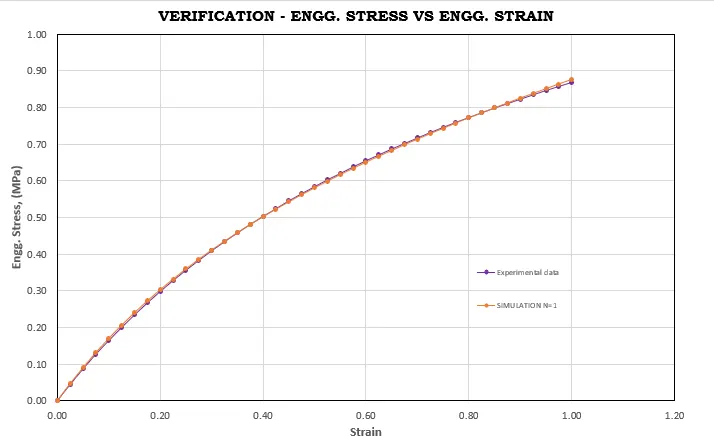
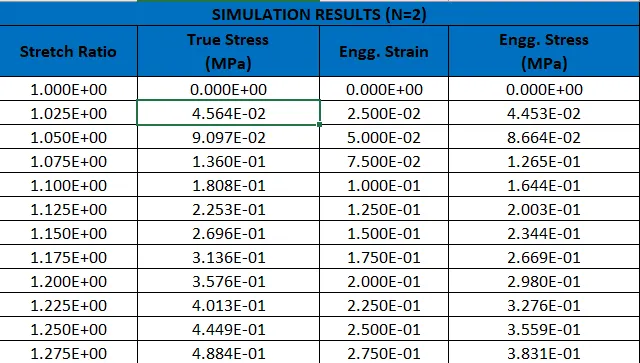
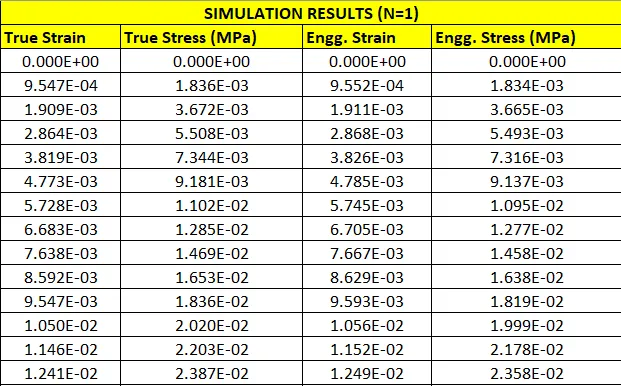
The values of stretch ratio and true stress are also available in the d3hsp file. These can be input into the Excel sheet and converted into Engineering stress and strain values. This can then be plotted and compared with the values from the material test data.
The same steps are followed to obtain the constants for N=2 and N=3.
N=2
N=3
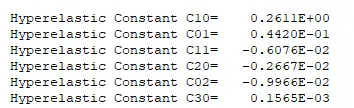
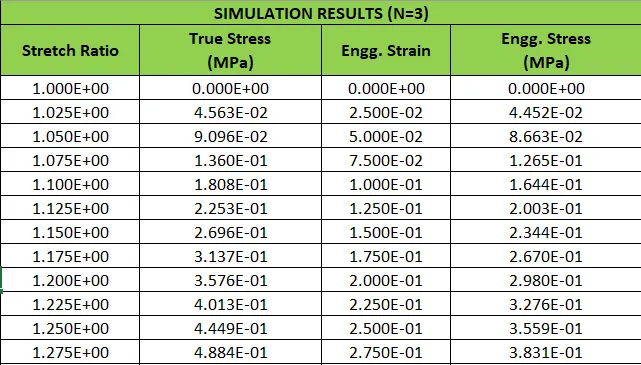
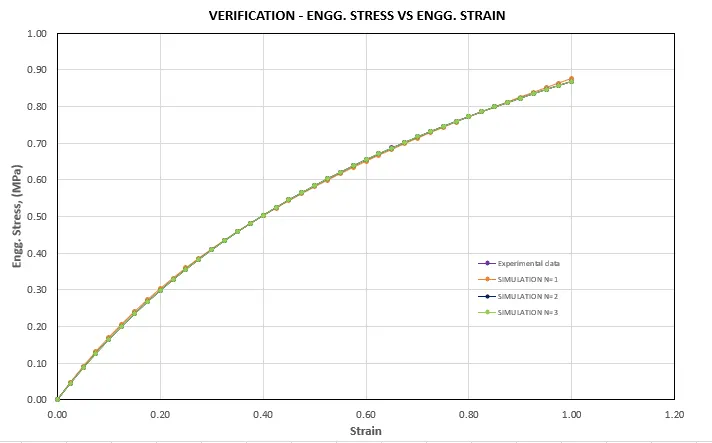
The graphs are plotted and compared against each other.
Model validation
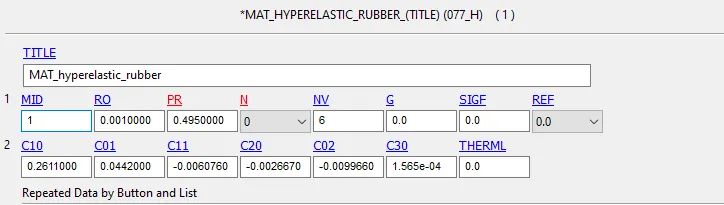
In order to validate the constants found, the values are entered in the LS-Dyna model with N=0 in the material card, and the simulation is run.
The stress - strain data obtained can be imported into the excel sheet and converted to engineering stress and strain, and can be plotted and compared against the experimental data.
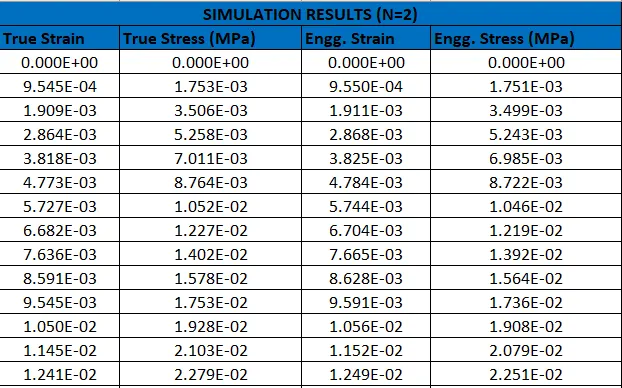
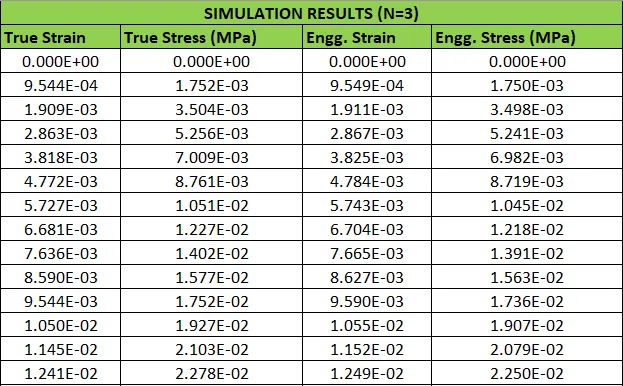
The same can be done for validating the constants found from N=2 and 3.
N=2
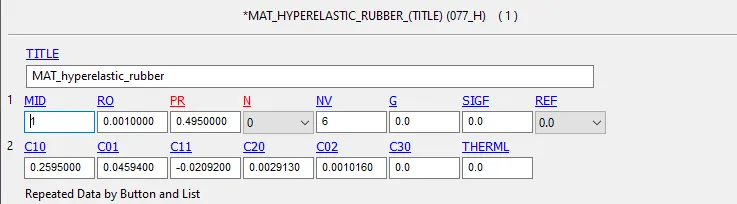
N=3
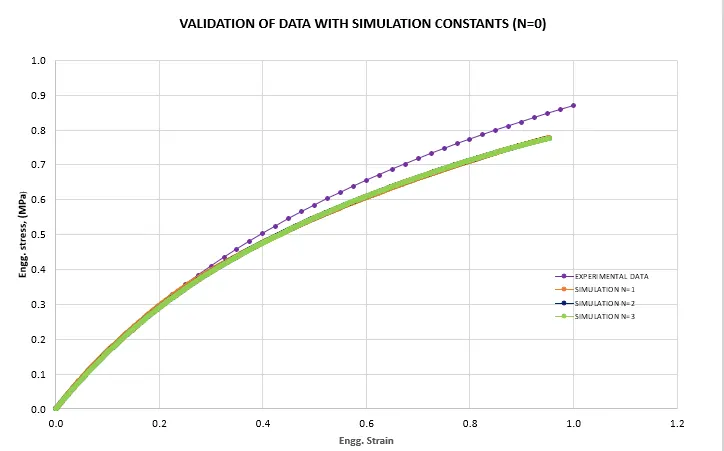
The engineering stress - strain data for all cases is plotted and compared against the experimental data as shown below.
MAT 77 - Ogden
Step 1: Material test data - Engineering stress vs Engineering strain
The given stress - strain data in imported into an excel sheet, and the values are plotted as shown below.
Step 2: Simulation set-up in LS Dyna
The dogbone specimen is setup for the tensile test simulation in LS-Dyna as shown below.
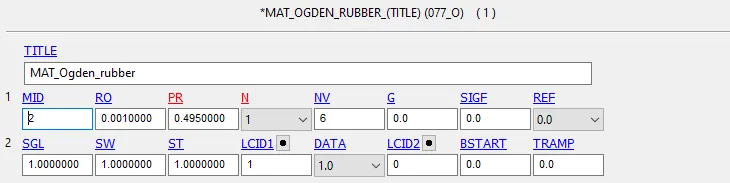
The Ogden material card MAT_77 is assigned to the model, with N = 1, and the values of RO and PR as shown below.
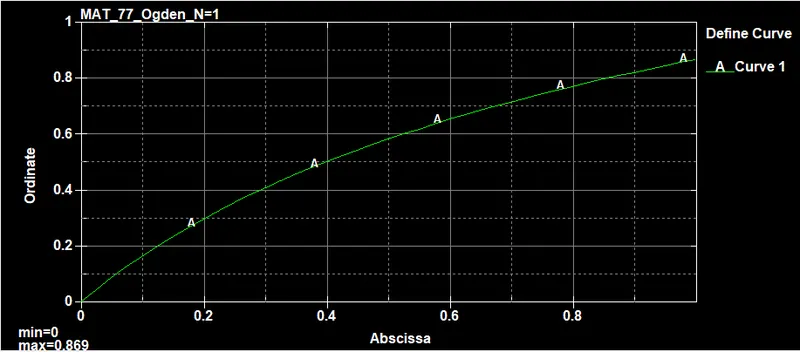
A curve is defined with the stress - strain data from excel, as shown below, and is assigned to the LCID shown above.
The section with a thickness of 2mm and ELFORM 2 is assigned to the specimen.
The section and the material are assigned to the part as shown below.

Step 3:- Boundary conditions - SPC and Prescribed motion
The nodes on the left-edge are constrained from motion in the X and Z directions.
The middle nodes on either end are constrained from motion in the Y direction, since there is an elongation in the lateral direction during the tensile test.
The nodes on the right edge are given a prescribed motion in the X - direction.
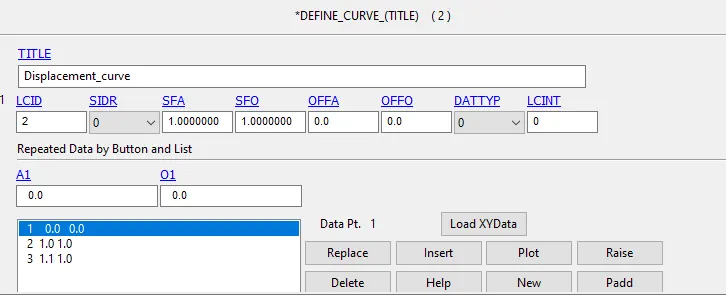
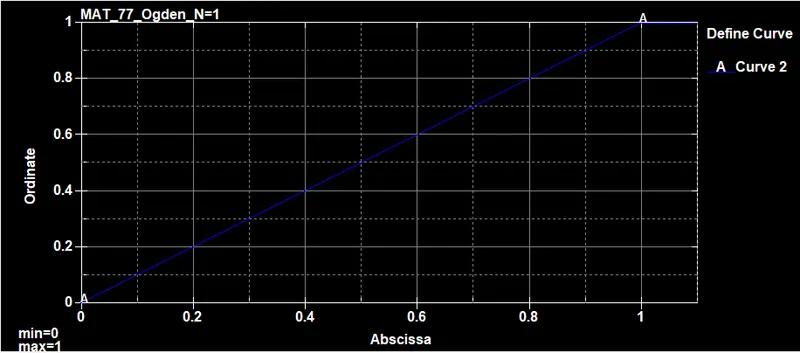
A curve is defined with the motion required and assigned to the LCID shown above.
Step 4:- Control cardsp:-
The tensile test is considered to be a quasi-static analysis. Therefore an implicit simulation scheme is used with the necessary control card parameters as shown below.
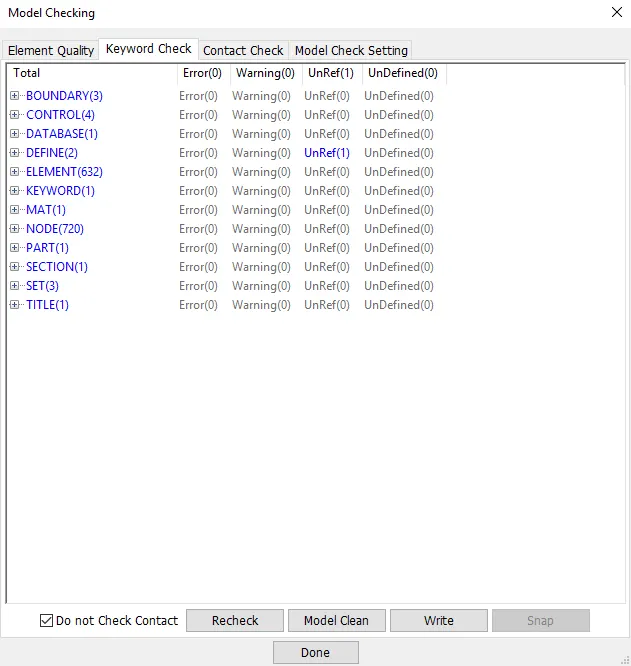
The model is simulated and the results can be analyzed.Before that we will check the model and then head for simulation.
Model verification:-
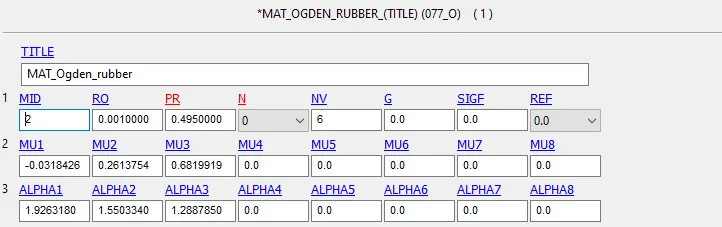
The Ogden constants for N=1, can be found from the d3hsp file, as shown below.

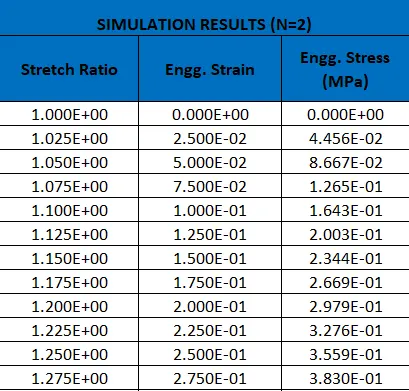
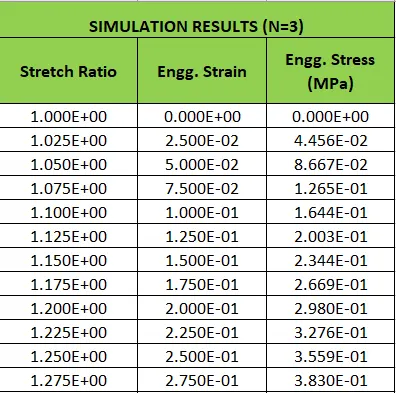
The values of stretch ratio and engineering (fitted) stress are also available in the d3hsp file.
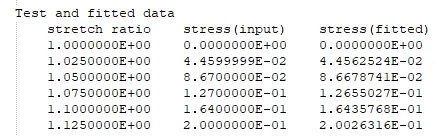
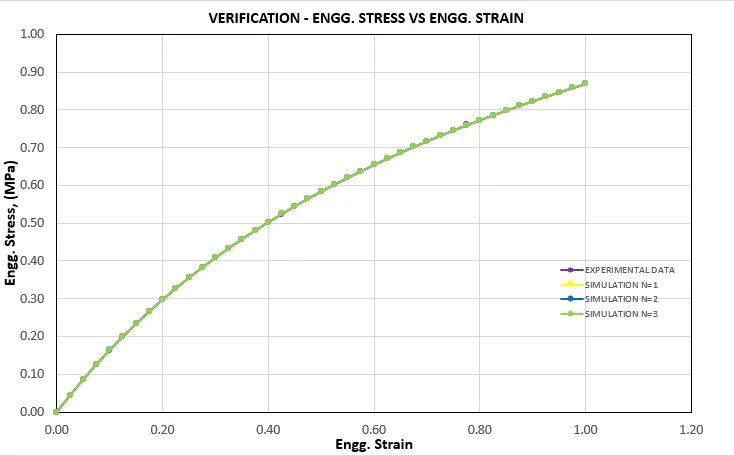
These can be input into the Excel sheet and converted into Engineering stress and strain values. This can then be plotted and compared with the values from the material test data.
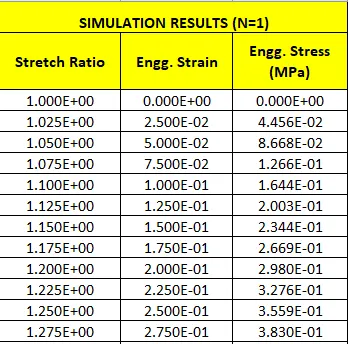
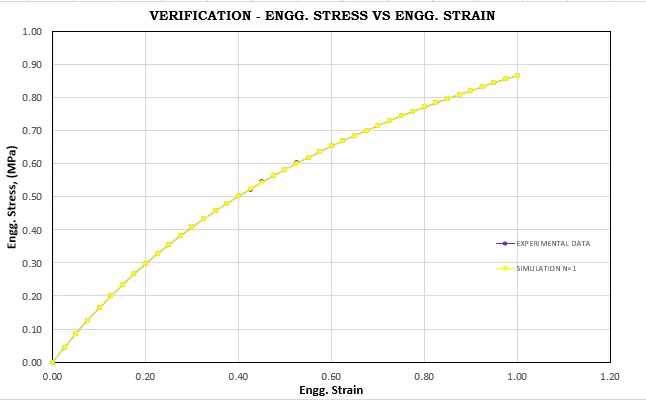
The same steps are followed to obtain the constants for N=2 and N=3.
N=2

N=3

The graphs are plotted and compared against each other.
Model validation
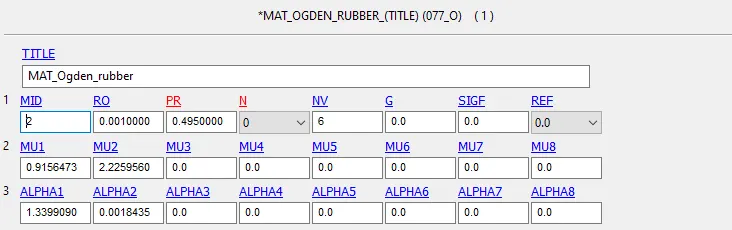
In order to validate the constants found, the values are entered in the LS-Dyna model with N=0 in the material card, and the simulation is run.
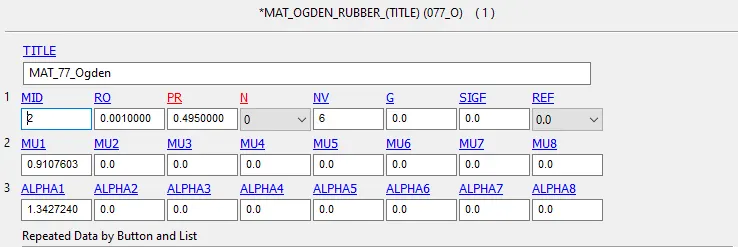
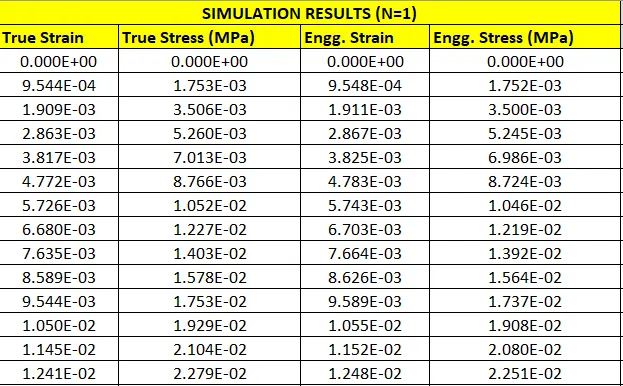
The stress - strain data obtained can be imported into the excel sheet and converted to engineering stress and strain, and can be plotted and compared against the experimental data.
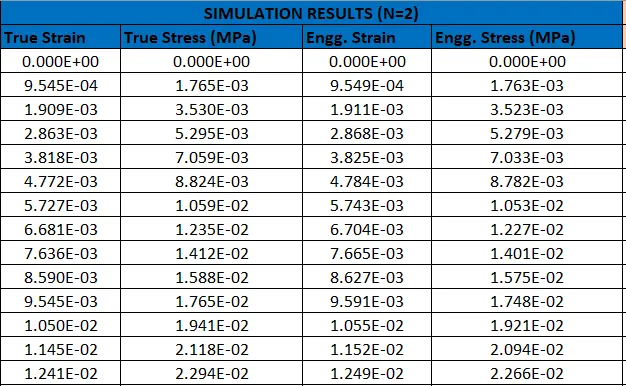
The same can be done for validating the constants found from N=2 and 3.
N=2
N=3
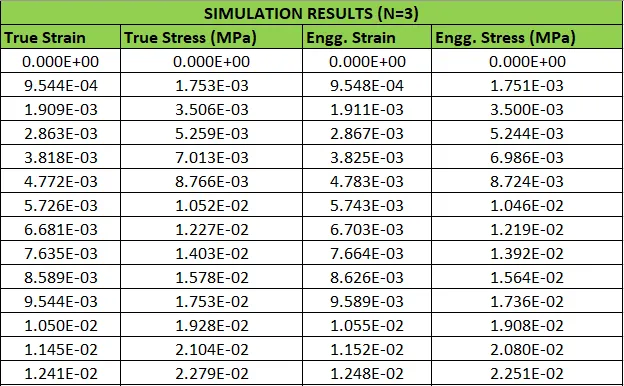
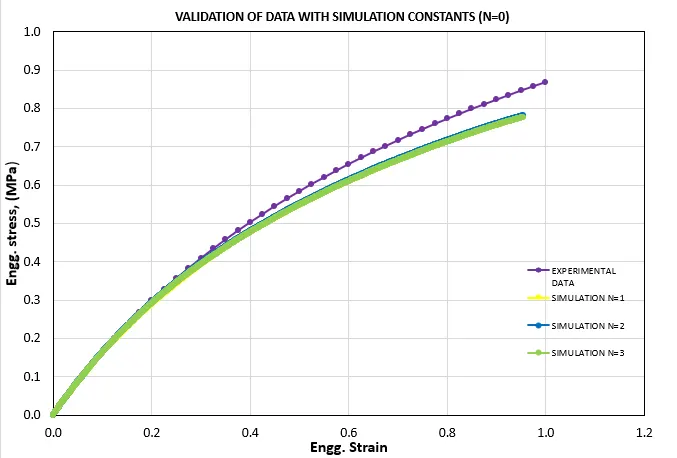
The engineering stress - strain data for all cases is plotted and compared against the experimental data as shown below.
Results:-
The stress and strain results of the mooney rivlin and ogden material for N = 1 is shown below.
Von-mises stress
Mooney Rivlin:-

Ogden:-
The maximum von mises stress for both material models is 1.220 MPA.
Effective Plastic strain:-
Mooney Rivlin:-
Ogden:-
The maximum value of the effective plastic strain is 2.887 in both cases.
Comparison of stress and strain values
The stress and strain values obtained from the validation models (N=0) of both formulations can be compared to find out how well they agree with the experimental data.
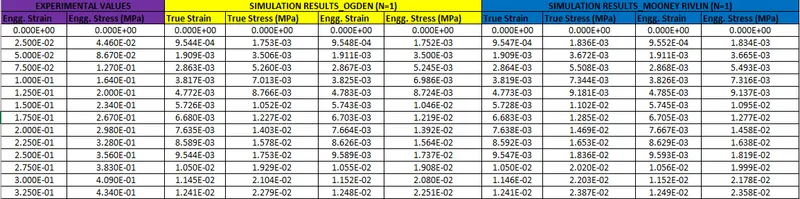
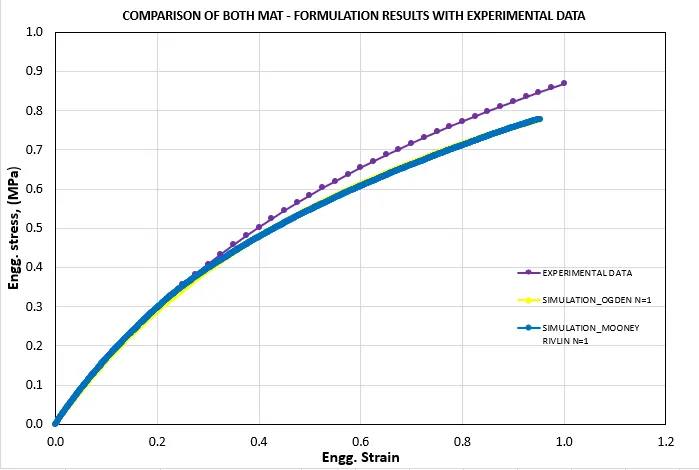
From the above plot in Excel, we can conclude that there is not much difference between both the formulations, though the Ogden material gives a slightly better fit compared to the Mooney rivlin material formulation.
Conclusion:-
- The above exercise gives us understanding the detailed process involved in generating a hyper elastic material card.
- Also here we have taken 0.495 Poisson’s ratio. The solution can be checked for different values of Poisson’s ratio which will give different material constant values and thus a more accurate material card can generated for practical applications.
- But from our simulation report we can conclude that at poissons ratio 0.495, ogden material model is more accurate to experimental data, so we can use this material model for future reference.