Week - 10 Hyperelastic Material Models
Aim:
The aim of the challenge is to use the given material data and to determine whether the Mooney-Rivlin strain energy function or the Ogden strain energy function is an accurate fit for the given data. Also the aim was to find out the constants in the two functions using LS-Dyna.
Explanation:
For the purpose of the challenge the material data about engineering stress and strain values was given as a .jpeg image. Hence, first this data was entered into Excel. The unit system used was kg-mm-ms. Hence the engineering stress values were converted from MPa to kg-mm-ms unit system. Also the graph of engineering strain vs. engineering stress was plotted using Excel.
To perform the challenge, the tensile test specimen from the Week 9 challenge was decided to be used. Hence the same .k file was opened in LS-PrePost and modified.
The material card used is MAT_077_H-HYPERELASTIC_RUBBER.
In this card the engineering stress strain values are provided by a load curve. Hence the *DEFINE_CURVE keyword was used to create a curve describing the stress-strain relationship. But, here, only a1=0 and o1=0 were input. And the .k file was saved and closed.
Then the .k file was opened in Notepad++ and the data obtained from the given graph was inserted under the *DEFINE_CURVE keyword. The .k file was saved and closed.
Then again the .k file was opened in LS-PrePost and the MAT_077 card was opened. As per the LS-Dyna manual, if the stress strain curve is given, the values of the specimen gauge length (SGL), specimen width (SW) and specimen thickness (ST) need to be equal to 1. Hence these values were set as 1. The engineering stress-strain curve defined above was input.
The density of rubber was input as 1.06e-06 kg/mm3 and the Poisson's ratio was set as 0.499.
The detailed description of the model is given below.
The part was given the SHELL section with Elform 2. It was assigned the material defined in the MAT-077 card above.
For boundary conditions, the set of nodes at one end of the specimen were fixed in 5 DOFs and the translation DOF in Y-axis was allowed to model lateral compression during the tensile test.
The nodes at the opposite end of the specimen were provided a displacement in positive X-direction using *PRESCRIBED_MOTION_SET keyword.
The curve for displacement was also defined using *DEFINE_CURVE. As per the question, 100% strain needs to applied for the simulation. This means that the change in length of the specimen had to be equal to its original length, which is 145 mm. Hence the specimen was given the displacement of 145 mm in the positive x-direction. Hence at 0 ms the displacement given was 0 mm. At 10 ms, it was 145 mm. At 10.1 ms also, it was 145 mm. The end time of the simulation was 10 ms.
In the control parameters, *HOURGLASS keyword was used to avoid hourglassing of SHELL elements.
*CONTROL_IMPLICIT_GENERAL was used and IMFLAG was set to 1 to use the Implicit method of analysis. The DT0 was set as 1 ms.
*CONTROL_IMPLICIT_SOLUTION with default parameters was also used.
The End time of the run was set to 10 ms using *CONTROL_TERMINATION keyword.
*DATABASE_BINARY_d3plot was used to get d3plot as output with DT of 1ms.
*DATABASE_HISTORY_NODE was used to get output data at a particular node and in ASCII options NODOUT with DT of 1 ms was used.
As per the question, 2 simulations had to be run to determine the values of Mooney-Rivlin constants and the Ogden constants. This was done by changing the value of "N" in the MAT-077 card. N (= No. of constants to solve for) was set to 1 to obtain Mooney-Rivlin constants and it was set to 3 to obtain Ogden constants.
Both the simulations ran smoothly and there was normal termination.
Then the d3hsp file was opened in Notepad++. The values of the Mooney-Rivlin and the Ogden constants were extracted and are provided below:
| Mooney-Rivlin constants | Ogden Constants | ||||||||
|
|
The values of extension (=stretch ratio) and true stress were also copied from the d3hsp files to Excel and were converted to engineering stress and engineering strain using the following equations:
Engineering strain = Stretch - 1
Engineering stress = True stress/stretch
The values of engineering stress and strain were plotted as a line graph in both the cases and are provided below along with the input data graph for easy comparison:
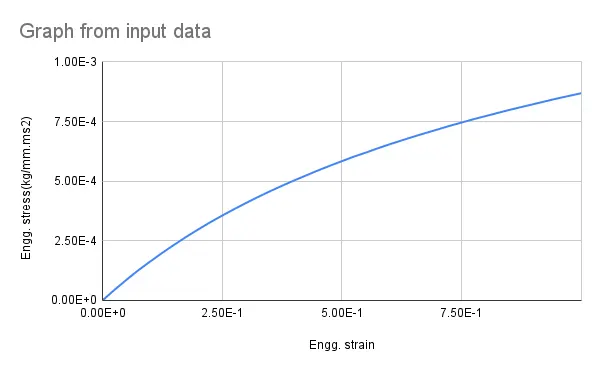
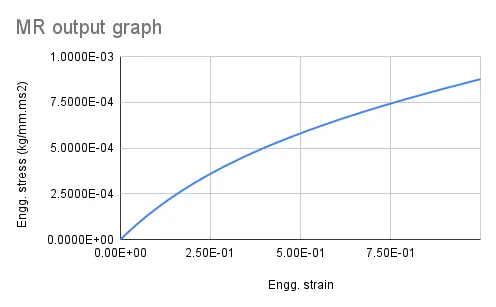
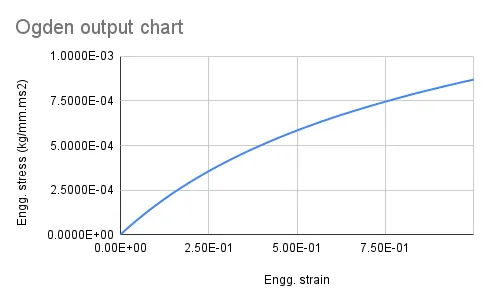
It is clear, that the graphs of stress-strain in both the cases match almost perfectly with the input data graph. However there are minute differences between the 2 cases, which will become clear by looking at the data below:
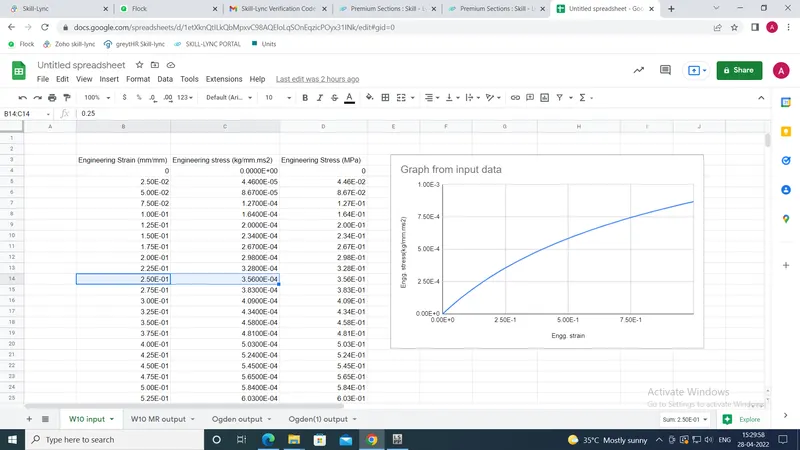
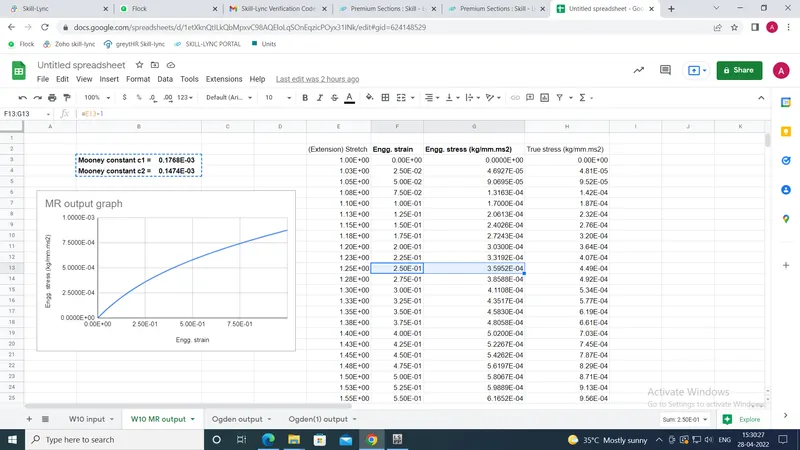
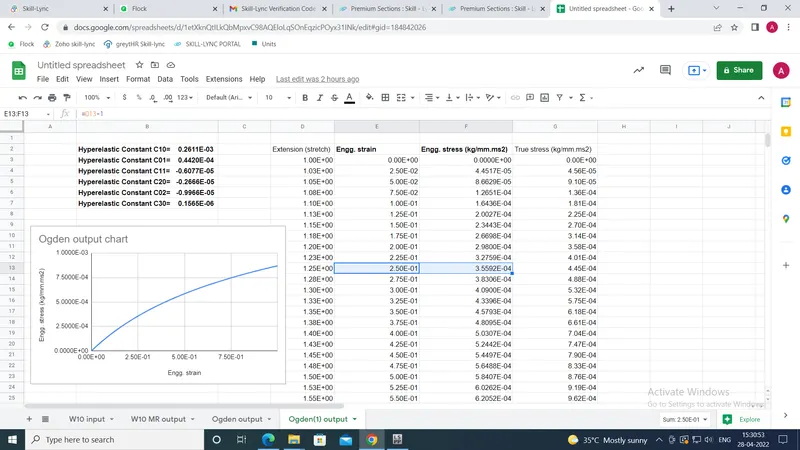
It can be observed from the images above, that:
| At Strain | Stress in input data (kg/mm.ms2) | Stress in Mooney-Rivlin (kg/mm.ms2) | Stress in Ogden (kg/mm.ms2) |
| 2.5 e-01 | 3.56 e-04 | 3.5952 e-04 | 3.5592 e-04 |
Hence it is clear, that the Ogden strain energy function has a more accurate fit with the input curve. Hence the Ogden function along with the extracted Ogden constants will model the given material accurately.
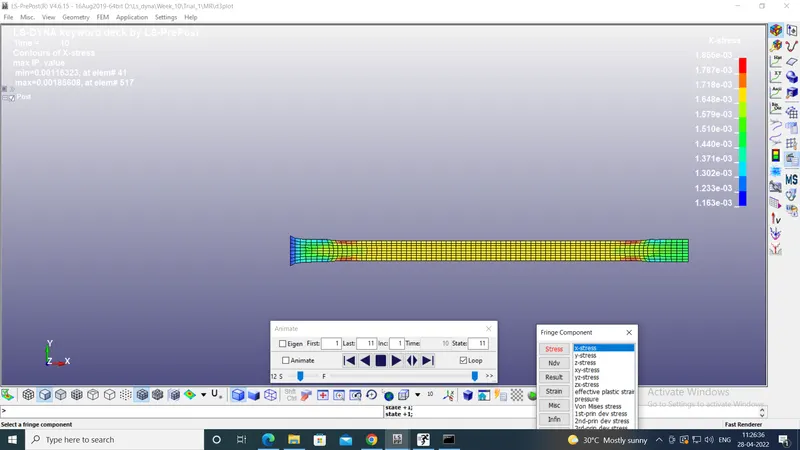
The stress and strain distribution plots are also provided below for reference:
1. Mooney-Rivlin
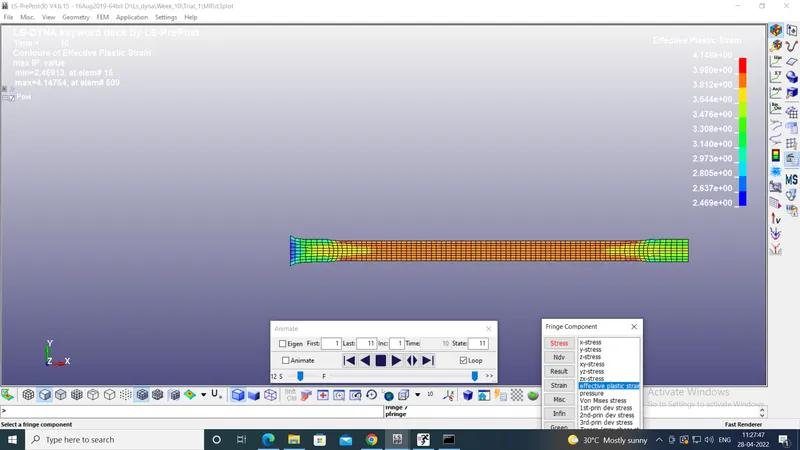
2. Ogden
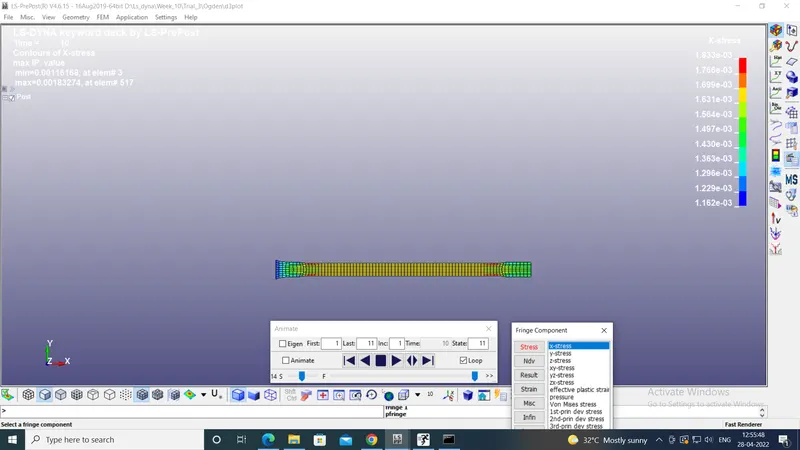
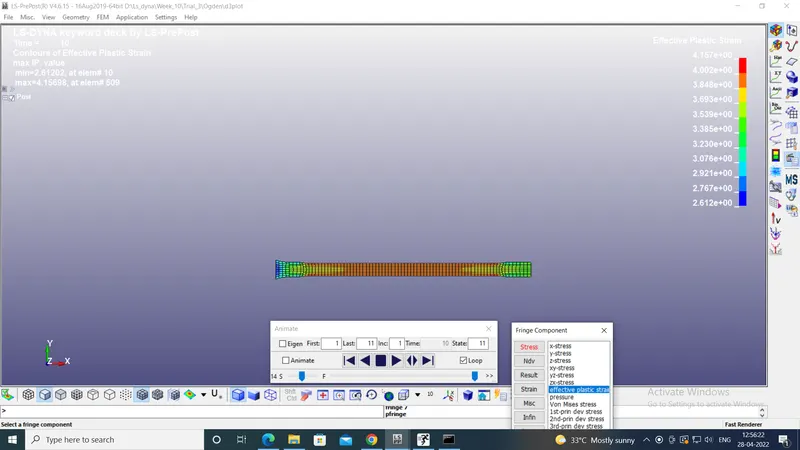
It can be seen that the values of maximum x-stress are higher in the case of Mooney-Rivlin function. This was also clear from the Excel data , as shown above.
Conclusion:
The challenge was a good opportunity to learn the different hyperelastic material models. It is clear from the explanation above, that the Ogden strain energy function is a more accurate fit for the given material data. Although the graphs in both Mooney-Rivlin and Ogden look almost similar, the actual values of stress and strain reveal the difference between the two. This underscores the importance of looking at the actual data values to draw the correct conclusions. The excel sheet of the calculations is attached herewith for the reference.