Week 10.1: 2D Cavitation simulation
Aim - 2D Cavitation simulation in Converge 3.0
Introduction - Cavitation is a phenomenon in which the static pressure of a liquid reduces to below the liquid's vapor pressure, leading to the formation of small vapor-filled cavities in the liquid. We will studying the phenomena in 2D with the help of WINKYL-HOFFER nozzel / diesel fuel injector.
Turbo Charger -
A liquid in a container remains as it is, ie, in a liquid state at equilibrium with surroundings, the vapor/air of the liquid (present above the liquid) must exert a pressure equal to the saturation pressure of the liquid. (Saturation pressure is the critical pressure at which phase change takes place). If there is a difference in pressure, Evaporation takes place until there exists no pressure difference. In a phase change process, the vapor pressure and the saturation pressure are equal (measured close to the liquid-vapor interface). It is to be noted that vapor pressure increases with an increase in temperature. So, a substance can boil even at low temperatures given, its pressure is low.
The same phenomenon can take place in liquid flow systems such as turbomachinery, fuel injectors in engines, etc. At regions of low pressure, a sudden contraction at the suction side of a pump system or at tips of impeller blades, at a fixed temperature of the liquid, if the pressure of the liquid falls below its vapor pressure, it results in vapourization. When the liquid vapourises, they form cavities of vapor in the liquid continuum and flow with the liquid. When these bubbles enter a high-pressure region, they burst and cause pressure waves onto the solid surface which, over time, may damage/corrode the solid structure. This formation of bubbles at pressures lower than vapor pressure is called Cavitation, Cavitation results in erosion of the solid material generate vibrations and noise Cavitation affects the performance of the fluid system and is an important aspect in designing fluid systems. Shown above is an image of the effect of corrosion on an aluminum surface.
Reference -
[1] Exploration of cavitation-induced erosion metrics in throttle flow simulations by Argonne National Laboratory, Argonne, IL, USA
[2] Fluid Mechanics Fundamentals and Applications by Yunus Çengel, John M. Cimbala.
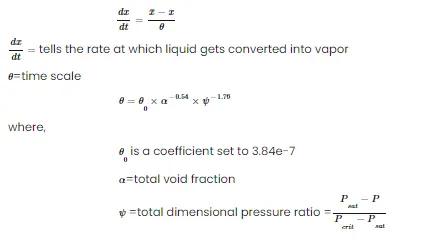
In our case, we have both liquid & gas phases so, in order to run this type of simulation, we will use the volume of fluid methodology the volume of fluid is basically the subset of the Multiphase flow simulation. In Converge CFD, the transition from the liquid phase to the gas phase is described by the following rate law:
Geometry -
- Geometry creation-
- Drag-drop
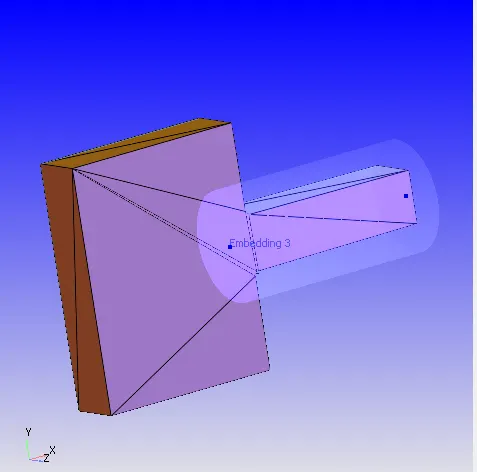
- Boundary Flagging
- Boundaries were defined using the Boundary function
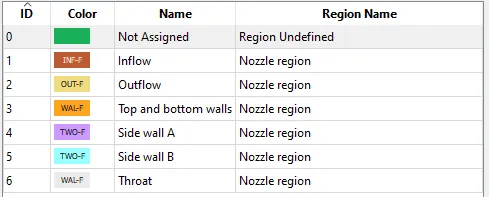
- 6 different boundaries were defined as follows -
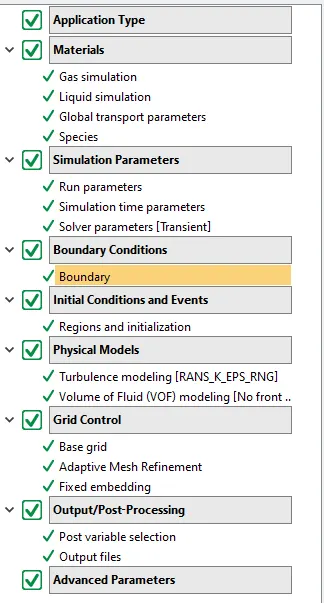
Case Setup - Imported the input files
- Application type > Time-based
- Materials>
- IC14H30 and N2 Gas species added
- Simulation parameters
- Run Parameters - Transient -
- Simulation time parameters - 0.0002s
- Solver parameters - Density-based NS solver
- Run Parameters - Transient -
- Boundary conditions-parameters assigned as follows
- Inlet -
- Inflow Type -
- Inlet - 5000000Pa, 300K, IC14H30 Species
- Inlet - 9000000Pa, 300K, IC14H30 Species
- Inlet - 12000000Pa, 300K, IC14H30 Species
- Inflow Type -
- Outlet -
- Outflow Type - 2000000.0Pa. 300K. IC14H30 Species
- Top and Bottom wall - Wall - Law of the wall - 450.0K Temp
- Sidewall A and B - 2D wall
- Throat - Fixed wall - Law of the wall
- Inlet -
- Initial Conditions and Events
- Region and initialization Add Volumetric Region with IC14H30 & N2 species.
- Physical Models -
- Turbulence Model - RNG-k-e
- VOF - cavitation
- Grid Control
- Base Grid - 4e-05m
- AMR - velocity SGS and species
- Fixed embedding
- Output/Post-processing
- Time interval 3D O/p files - 5e-05
- Advanced Parameters
Observations - After running the calculation on Cygwin following are the results observed in Paraview and Converge Line plotting tool. We observe that as the lift increase the velocity and mass flow rate increases & the pressure on the spindle decreases. Also, the total pressure in the system/valve increases as the lift increases. The AMR results are more close the actual/practical value since the mesh is refined as compared to without AMR.
- Mesh
-
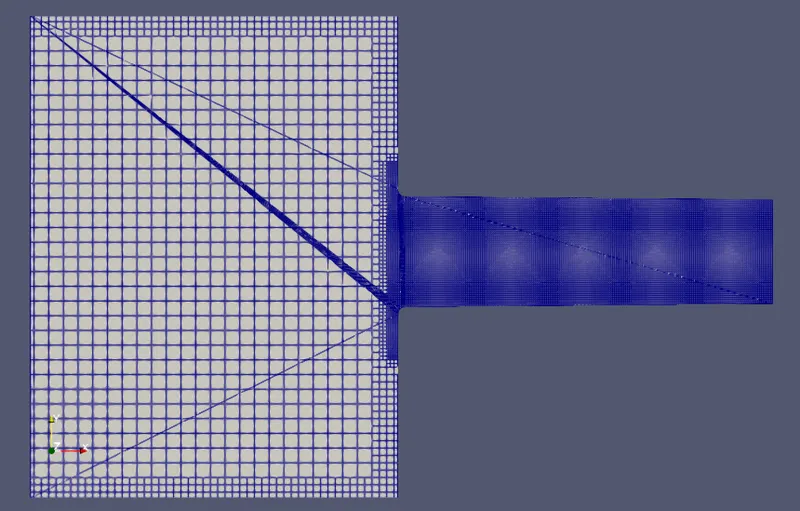
- Link - https://youtu.be/3iSbBZdHshg
-
- Total Cells count - Count changes as per AMR setting we used.
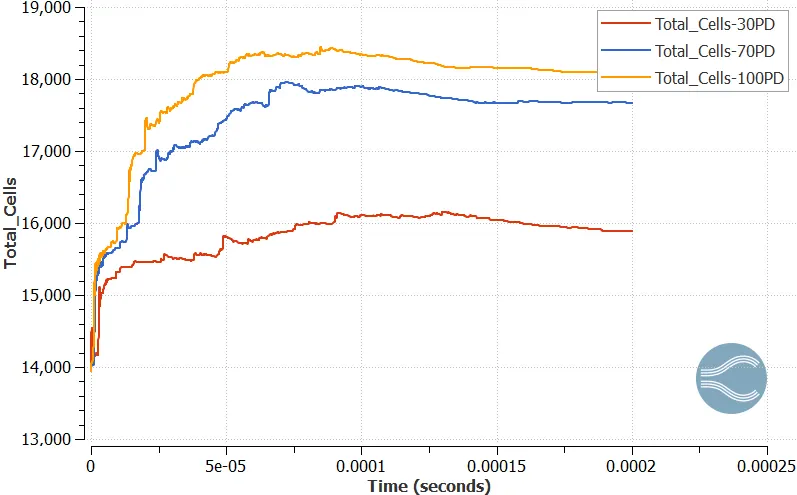
- The cell count and mesh varies overtime for all 3 pressure diffremces
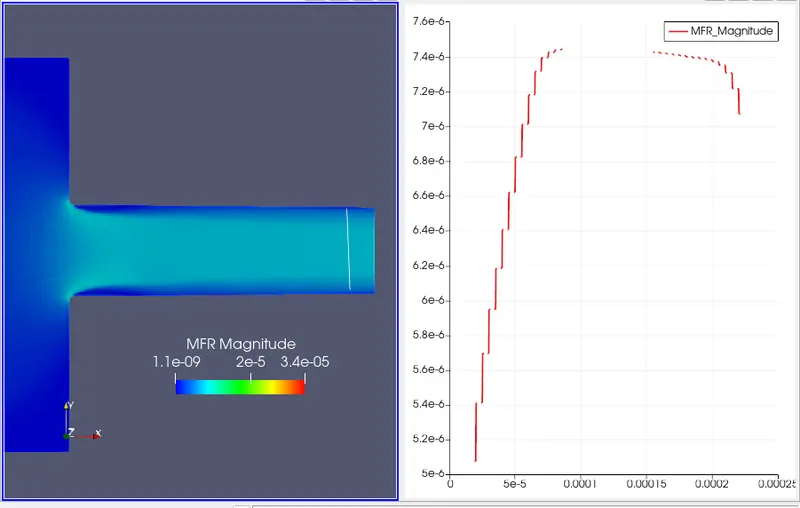
- Mass flow rate
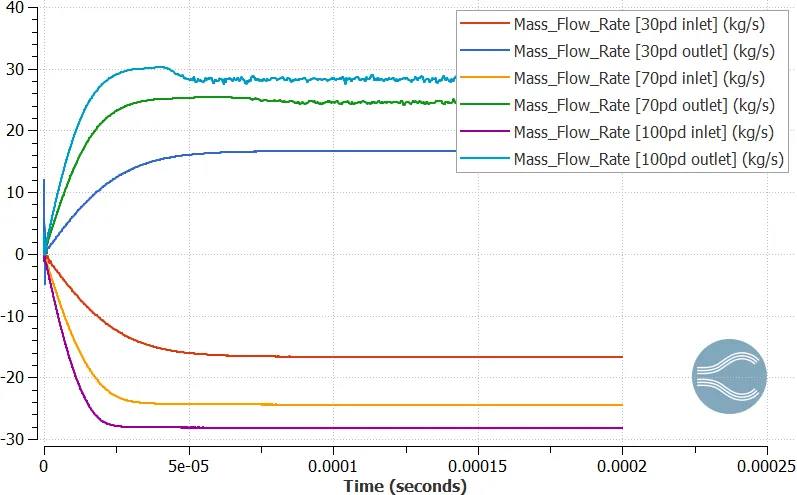
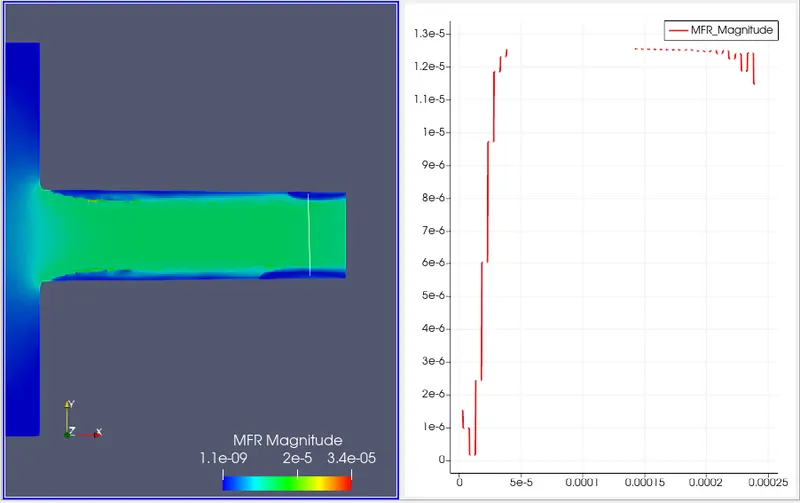
- Mass flow rate converges at the end of the simulation time. Also, the Mass flow in = Mass flow out for the respective pressure differences. We also observe the fluctuations due to cavitation.
- Contours - Pressure difference - 30 Bar
- Velocity
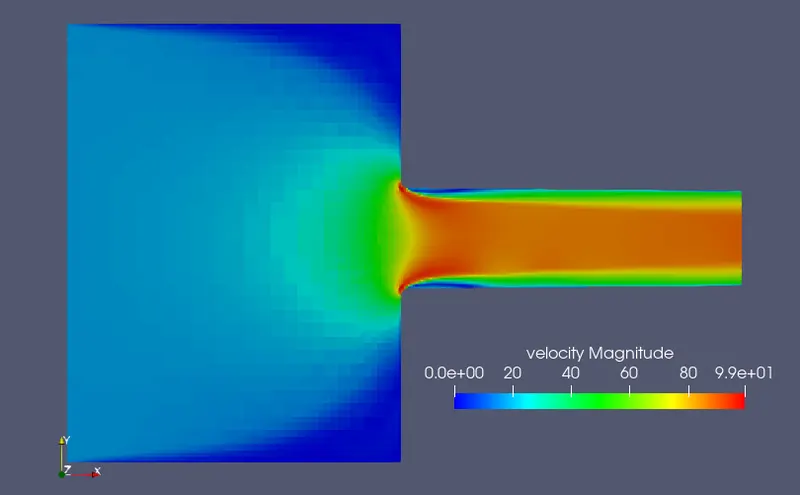
- Mass fraction
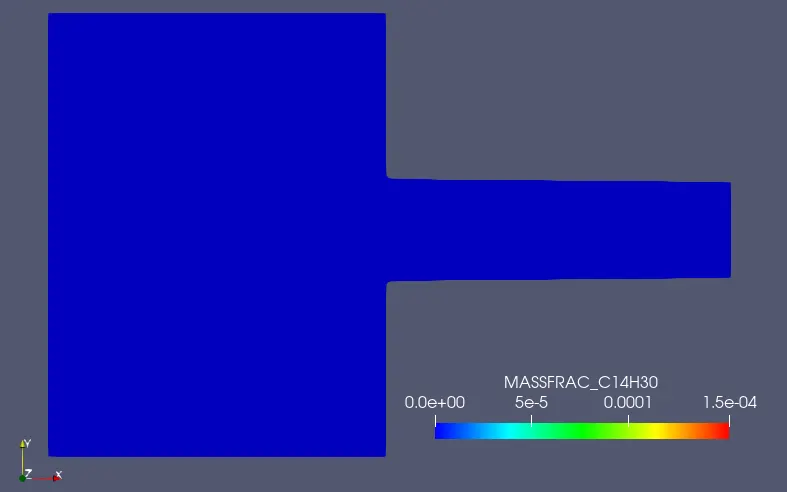
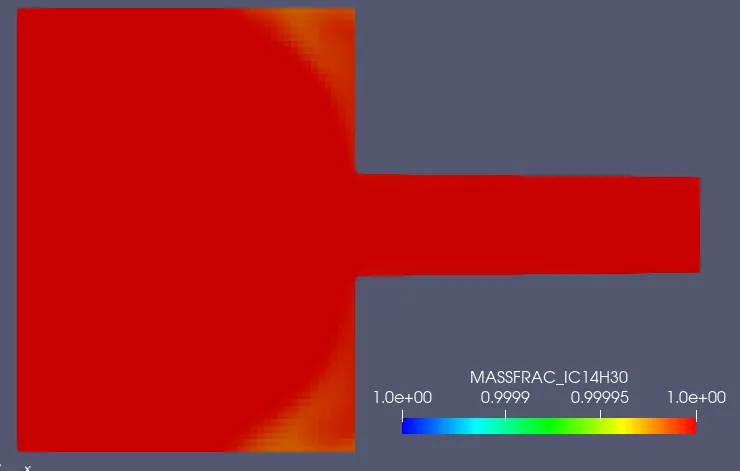
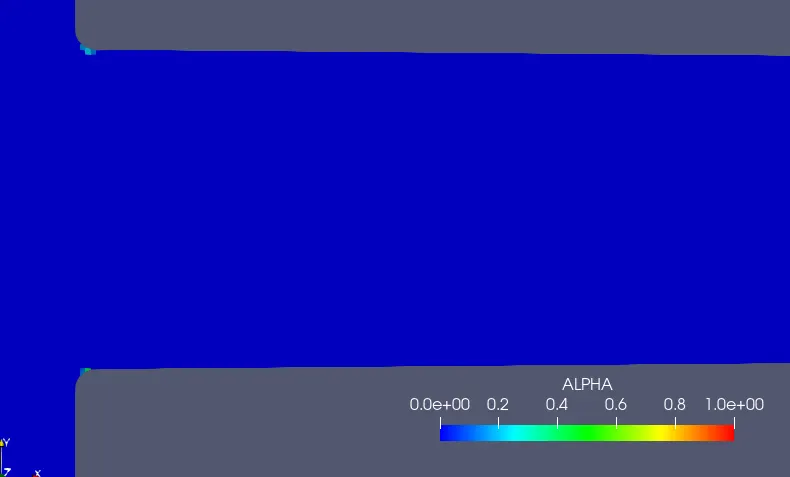
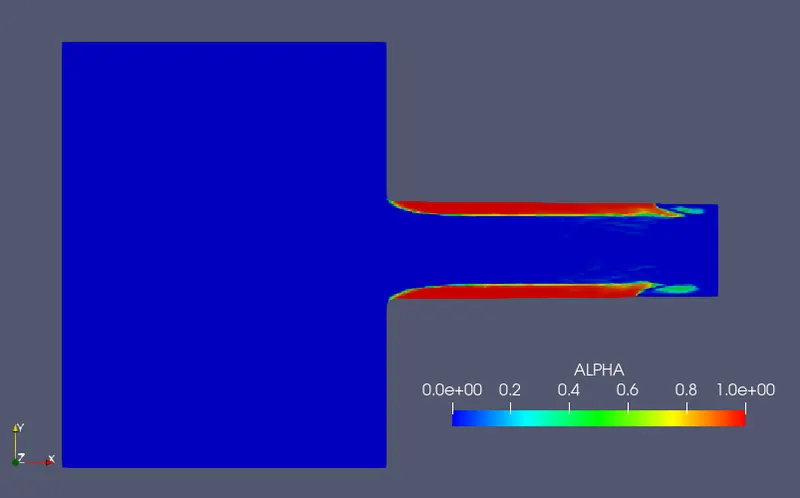
- Cavitation zone
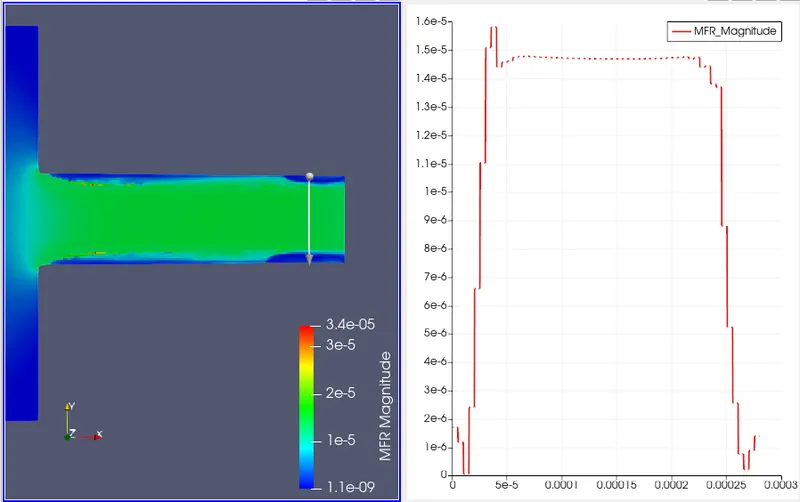
- Mass Flow rate
- Pressure difference - 70 Bar
- Velocity
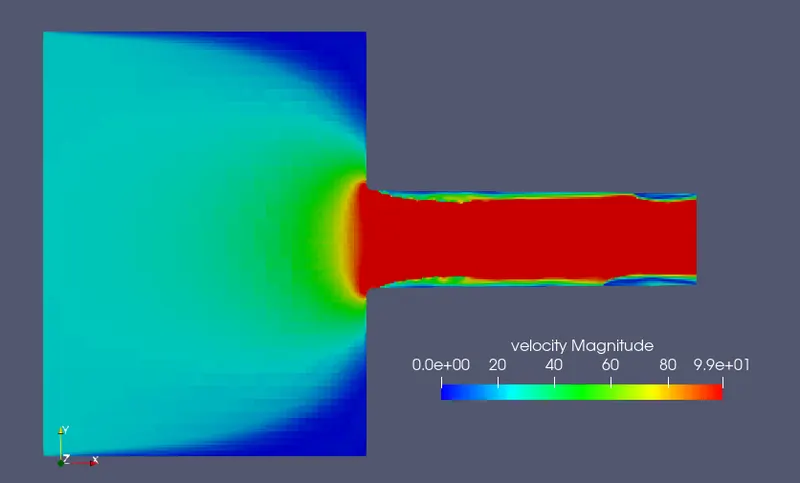
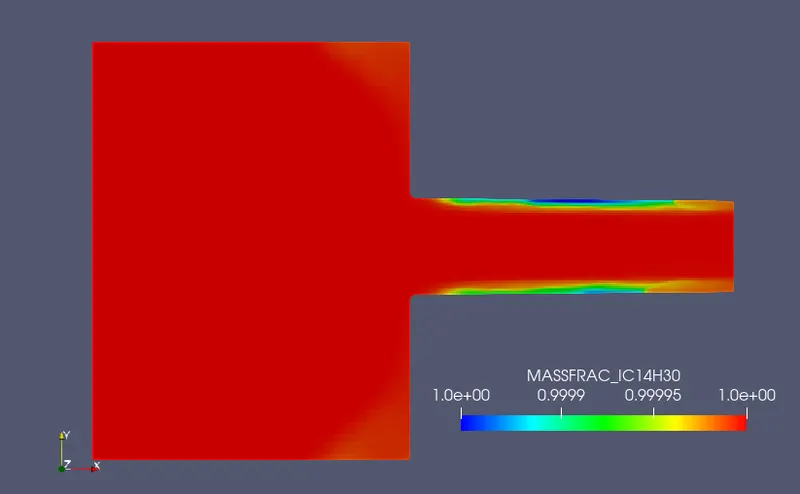
- Mass fraction
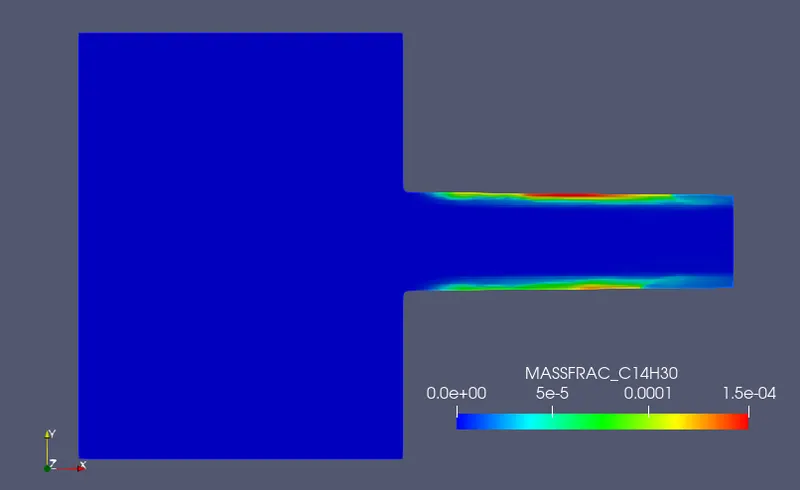
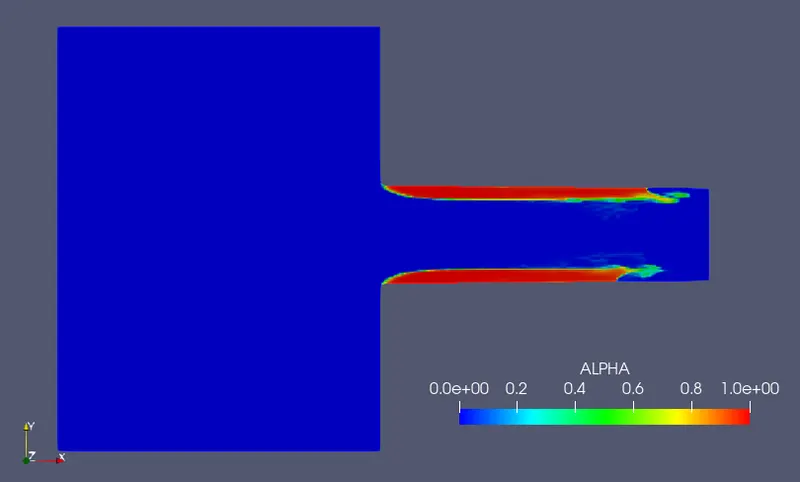
- Cavitation Zone
- Mass flow rate
- Pressure difference - 100 Bar
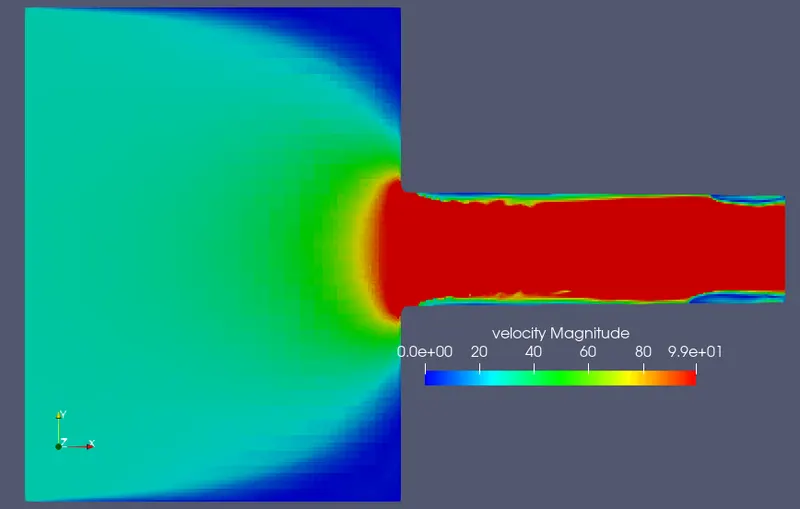
- Velocity
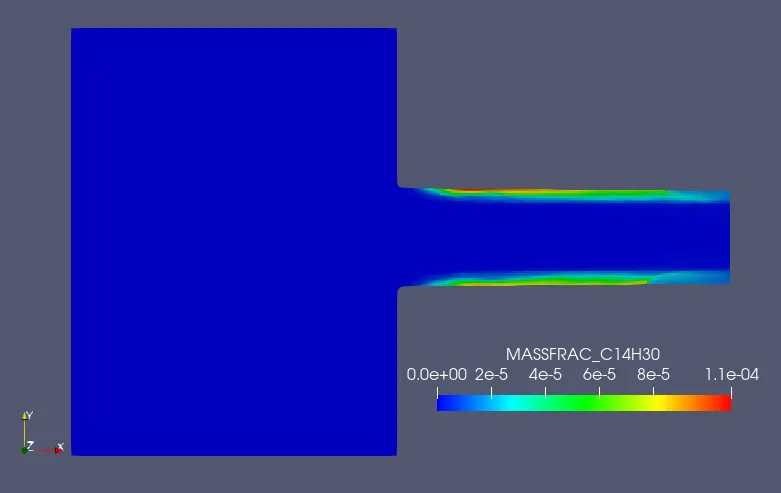
- Mass fraction
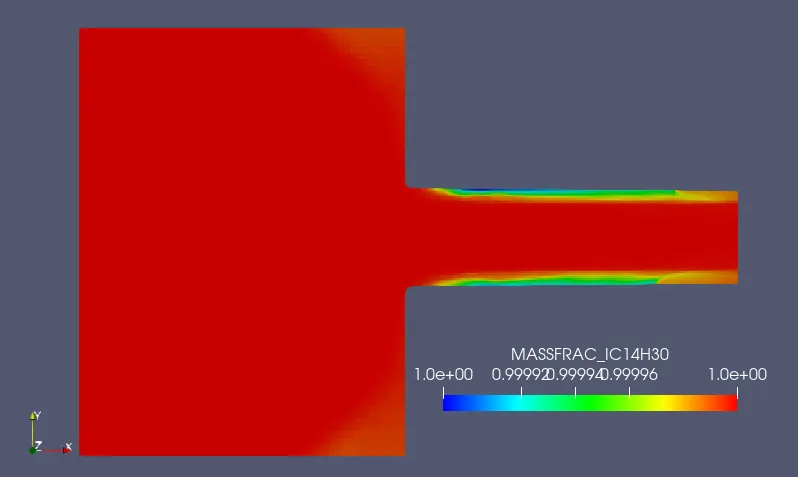
- Cavitation Zone
- Mass Flow rate
- From the above velocity contours, we can see that at the throat due to sudden contraction in the area the velocity reaches the maximum also when we compare the above velocity contours amongst each other we can see that as pressure difference increases the velocity increases at the throat. At the throat, due to sudden contraction in the area, a layer of fuel that is flowing along the wall gets separated and creates a flow separation.
- From the Mass flow rate contour, we can see that at the outlet the mass flow rate is not uniform, and this fluctuation in mass flow rate creates an improper injection of fuel spray which creates an improper air-fuel mixture and this improper air-fuel mixture will increase the emissions. In the flow separation region, when the static pressure of the fuel falls below the vapor pressure, cavitation occurs
- Pressure difference Vs Cavitation zone length -
-
Pressure diffrence Bar Cavitation zone length m 30 0.0000198 70 0.000922 100 0.000931 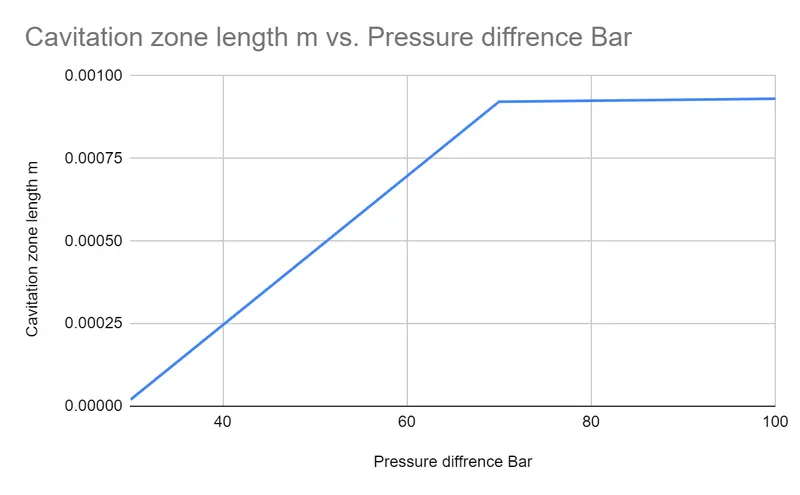
- Cavitation length increases as the pressure difference increases.
- Animation link - https://youtu.be/ttjG2JwE2lE , https://youtu.be/-82twuw593g , https://youtu.be/vwwDvSb9Hxo
-
Conclusion -
- All required parameters were derived from ParaView. Excel plot also created.