Week 1 Stress Concentration on a Plate with hole
Stress Concentration on a Plate with a Hole.
Case 1:
For Case 1, Static Structural Analysis is carried out on plate with a hole of diameter 60 mm. The material is Structural Steel and the analysis is carried out on Ansys Workbench. The Plate is first modified in Space claim and is shown in the figure below.
Dimension of the plate are as shown below: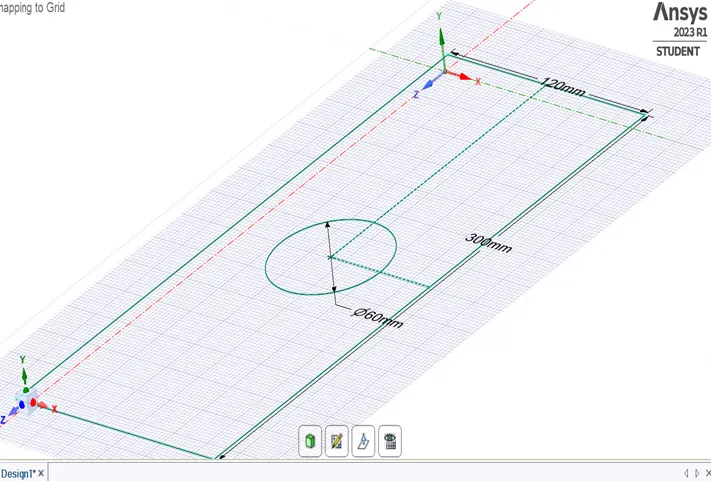
Length: 300 mm
Width: 120 mm
Thickness: 30 mm
Hole Dia: 60 mm
2D Geometry is extruded in the Space Claim to get the model to be imported to the ANSYS. The Extruded model is as shown in the image below.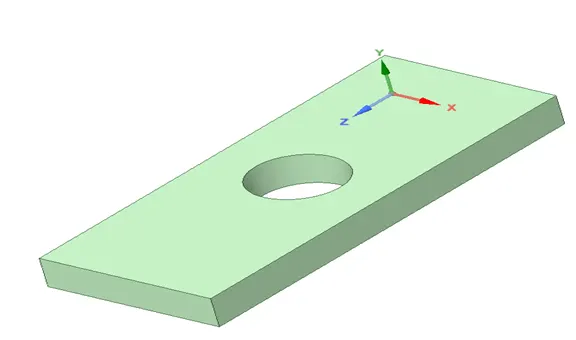
The properties of the material is stated below:
Density: 7850 kg/m3
Tensile Yield Strength: 2.5E+08 Pa
Tensile Ultimate Strength: 4.6E+08 Pa
Young’s Modulus: 1.2E+05
The model is meshed using Ansys Mesher with an element size of 10mm, and a patch conforming method using tetrahedrons was employed. This is done to get the best refinement within the limitation of Ansys Academic License.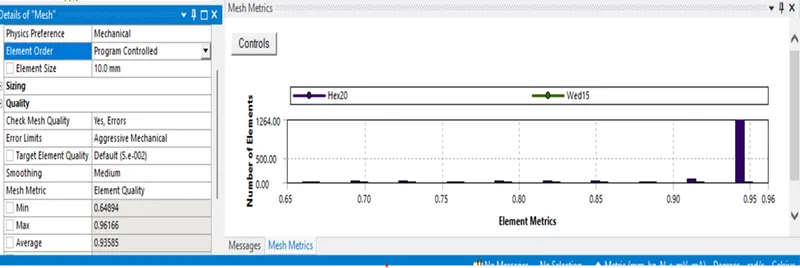
A mesh metric that identifies the elements according to their quality was employed and it can be seen that element of lowest quality are minimal. Most of the elements have very high quality in the range of 0.9-0.96. Hence, the mesh is of acceptable quality. The meshed model is shown in image below: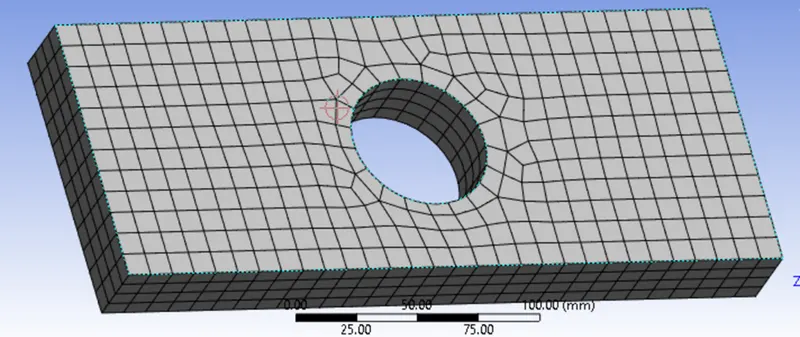
The simulation is then run with the settings applied and the results are obtained.
Case 2:
Static structural analysis is carried out on a plate with 3 Hole. It is modification in the plate used in case 1, such that there are 2 extra holes of 30 mm, placed at a distance of 90 mm from the centre. The dimension of the plate and material is same as in Case 1. The 3D model of the plate is shown as in the image below.
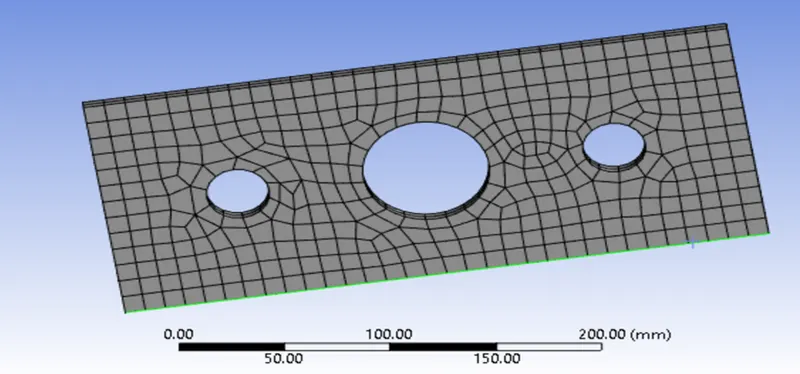
“Fixed Support” is applied on one side of the model and tensile load of 500N is applied on the other side.
Results:
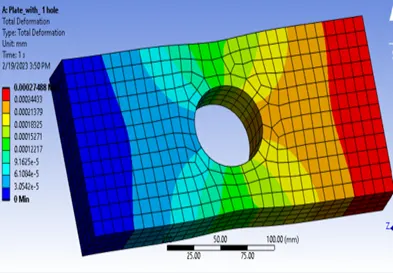
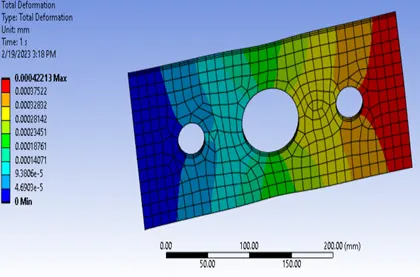
Total deformation of the two cases are compared first.
Time [s] Minimum [mm] Maximum [mm] Average [mm]
- 0. 2.7488e-004 1.3686e-004
- 0 4.2213e-004 2.0928e-004
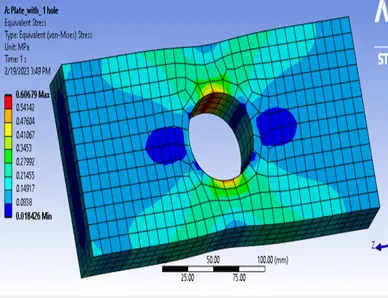
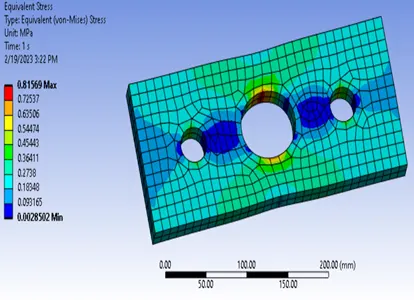
Equivalent Stress for the two cases are compared.
Time [s] Minimum [Mpa] Maximum [Mpa] Average [Mpa]
- 1.8426e-002 0.60679 0.16029
- 6.3727e-003 0.58312 0.1662
The total deformation on the plate is as plotted and is shown on the plate below.
The Equivalent stress is plotted on the plate and is as shown below.
Conclusion:
The Analysis was run succesfully, within the limits of the academic license, the simulation for the 2 cases were examined.
On comparison of the Total deformation experienced by the model in 2 cases, only a slight difference in the average value is evident of the order of 0.7 mm with Case 2 having a higher value. Maximum deformation have a difference of 1.47mm.
On comparison of the Equivalent stress experienced by the model in 2 cases, a slight difference in the average value of is evident of the order of 0.06 Mpa with Case 2 having hiegher value. Maximum stress having a difference of 0.23 Mpa.
On the basis of these 2 results from analysis point of veiw, case 2 can be choosen because the stress undergone by it on the same amount of tensile force is lesser than the case 1.
From a manufacturing point of veiw, Case 1 can be choosen since the machining in this case is lesser as compared to case 2, hence will result in time saving and machining cot.