Week 1- Mixing Tee
OBJECTIVE
To simulate the flow of air through the mixing of Tee and understand the length of pipe and momentum ratio of velocity for mixing of air by using two types of pipe i.e. short pipe and long pipe.
INPUT:
- Case 1
- Short mixing tee with a hot inlet velocity of 3m/s.
- Momentum ratio of 2, 4.
- Case 2
- Long mixing tee with a hot inlet velocity of 3m/s.
- Momentum ratio of 2, 4
- hot inlet temperature = 36 0C
- cold inlet temperature = 190C
Momentum ratio = velocity at cold inlet/velocity at the hot inlet
from the definition of momentum ratio, we calculated the velocity of the cold inlet = 7.2 m/sec.
STEP 1: PRE-PROCESSING:
- first, we imported the CAD model as shown in figure 1 and remove the undesirable part which does not takes part in flow simulation
as shown in figure 2.
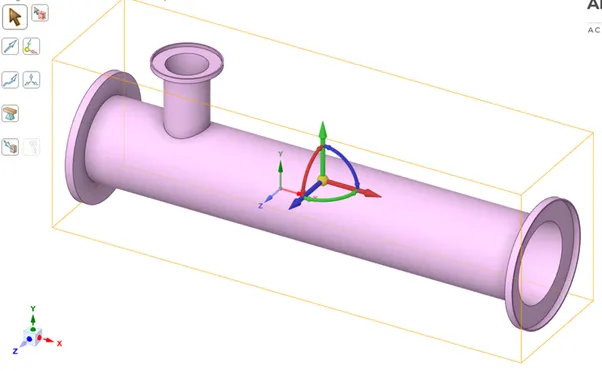
figure(1) : CAD MODEL
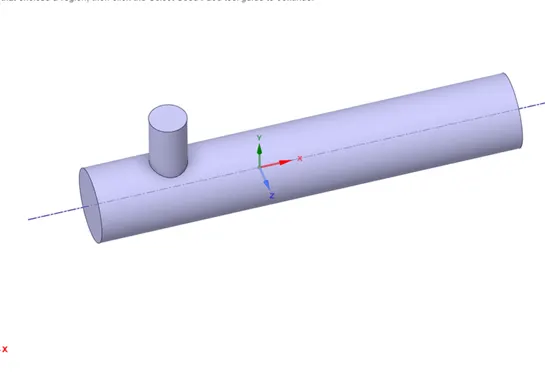
FIGURE(2): VOLUME EXTRACTED MODEL
- next step is to create a mathematical model i.e meshing but before messing we have to give boundary conditions to the body and then we create a mesh.
MESH GEOMETRY: MESH SIZE 0.005 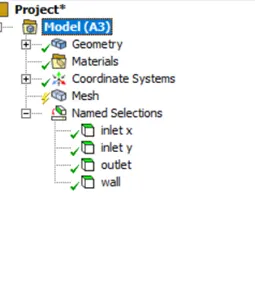
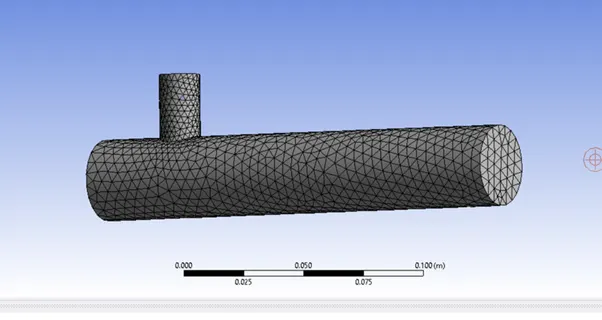
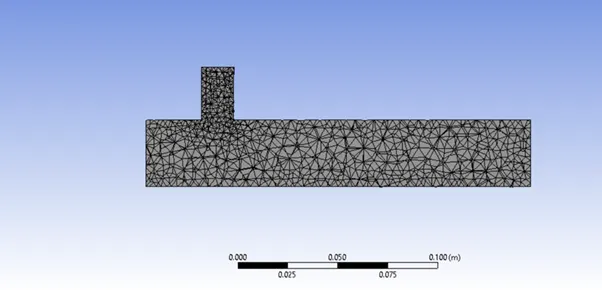
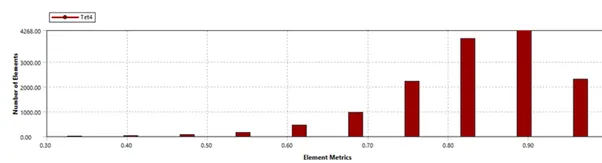
FIGURE() : MESH MATRIX
SHORT LENGTH TEE:
MODEL: K-EPSILON
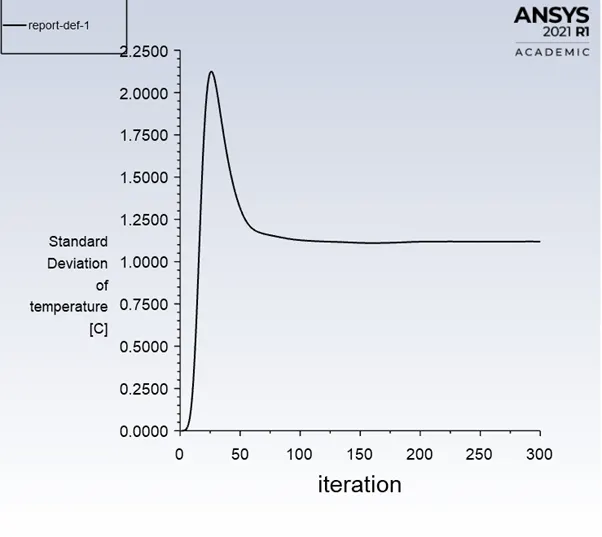
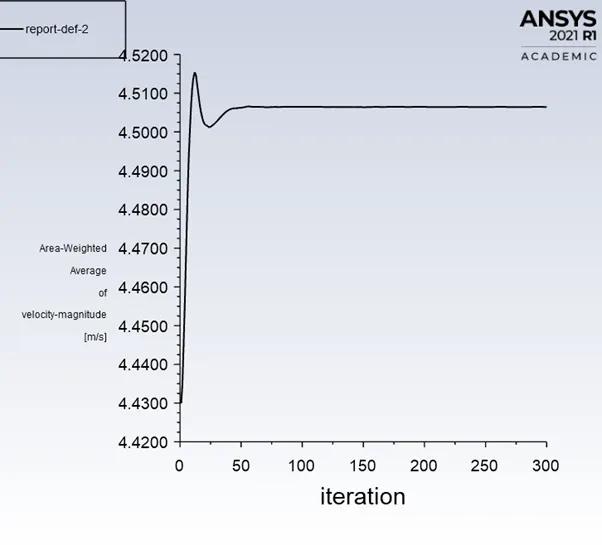
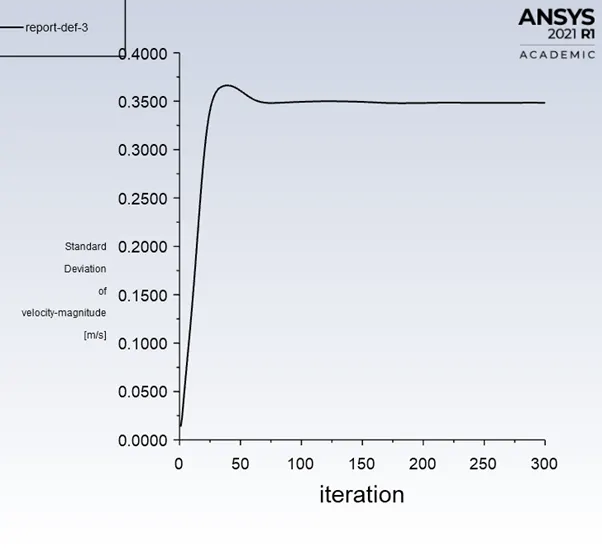
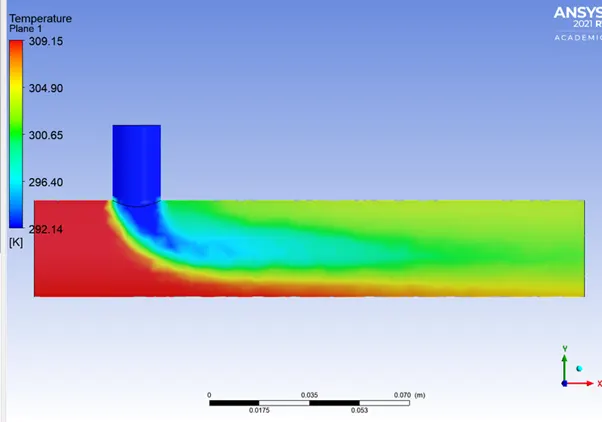
MOMENTUM RATIO: 2
HOT INLET VELOCITY : 3m/sec
COLD INLET VELOCITY: 6m/sec
NODES: 21331
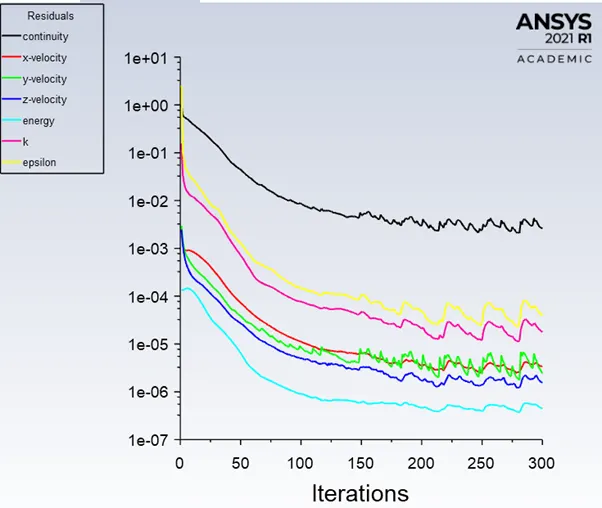
ELEMENTS: 105879 RESIDUAL PLOT:
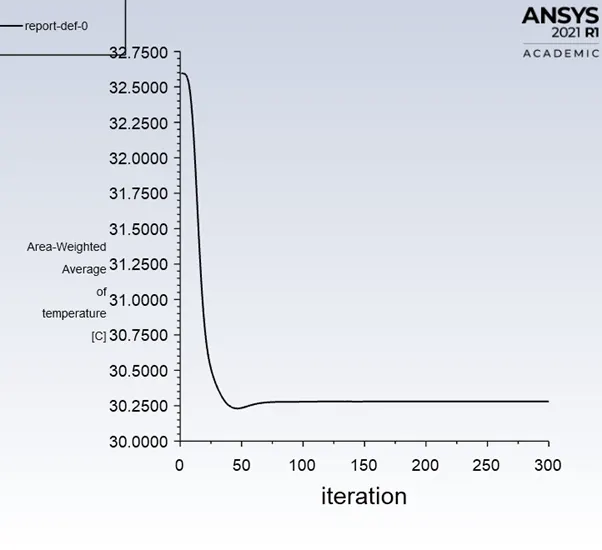
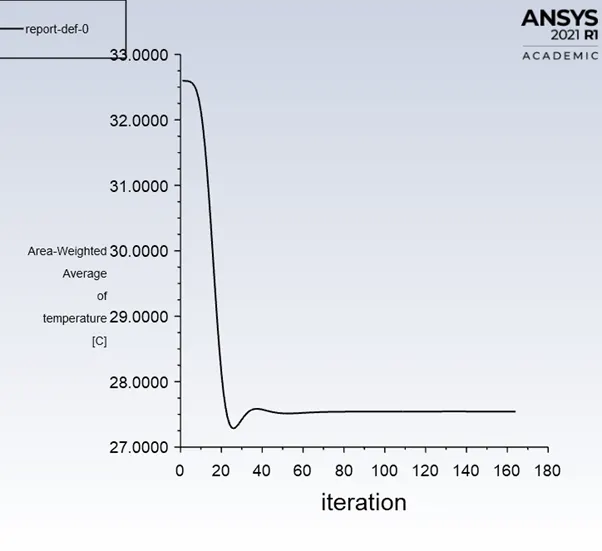
AREA WEIGHTED OF TEMPEATURE AND VELOCITY
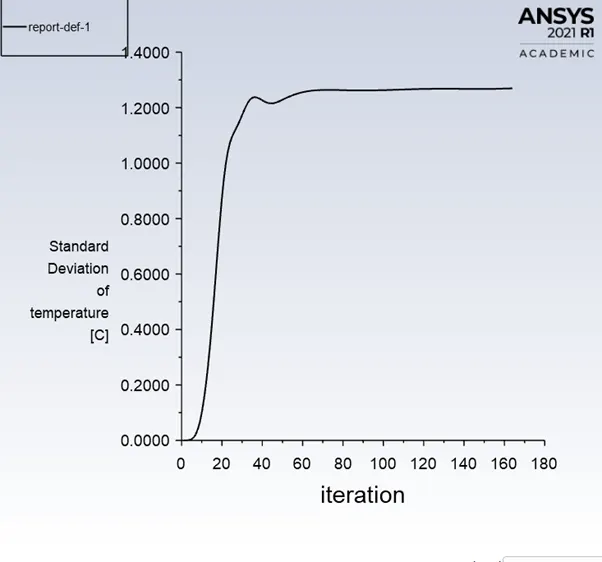
STANDARD DEVIATION OF TMEPERATURE AND VELOCITY
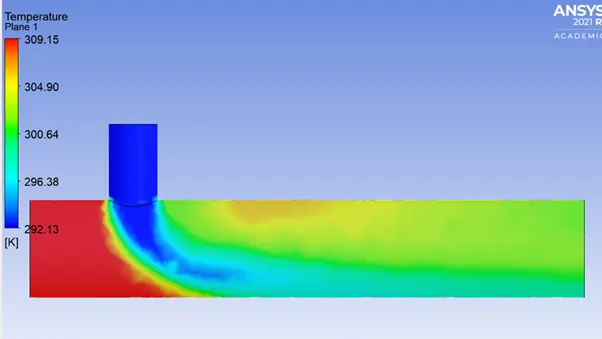
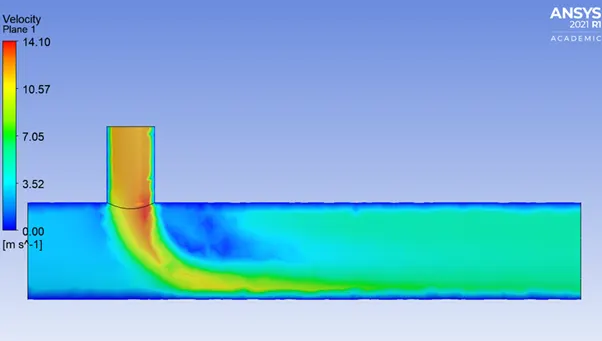
CONTOUR PLOTS
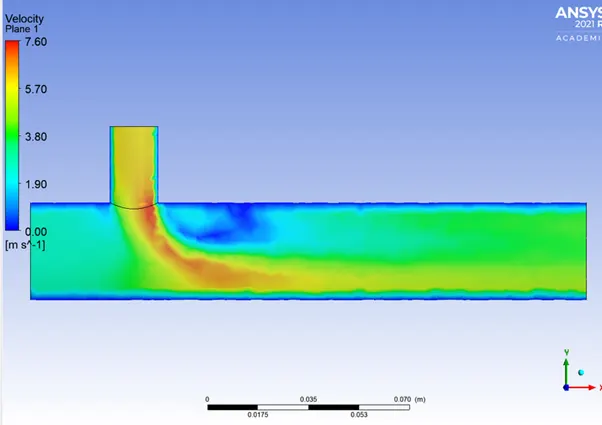
MODEL: K-EPSILON
MOMENTUM RATIO: 4
HOT INLET VELOCITY : 3m/sec
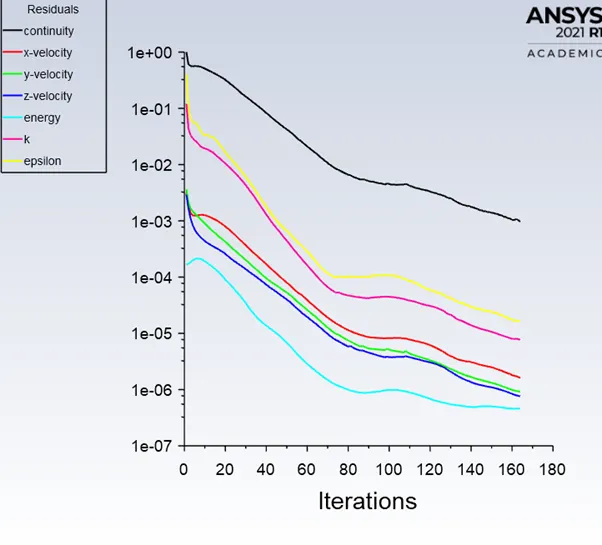
COLD INLET VELOCITY: 12m/sec RESIDUAL:
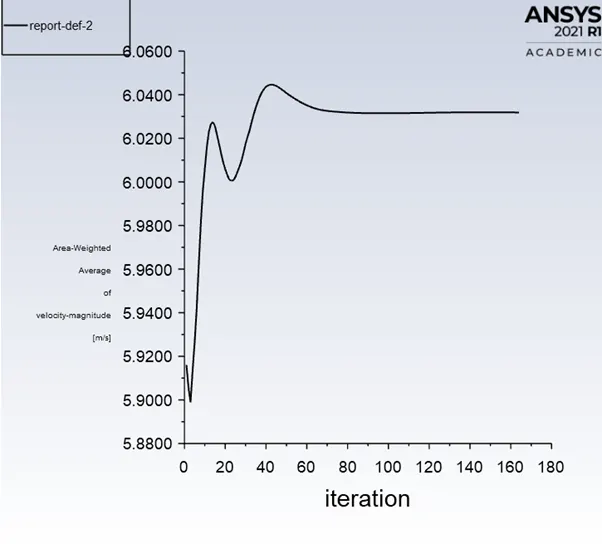
AVERAGE WEIGHTED OF TEMPERATURE AND VELOCTY
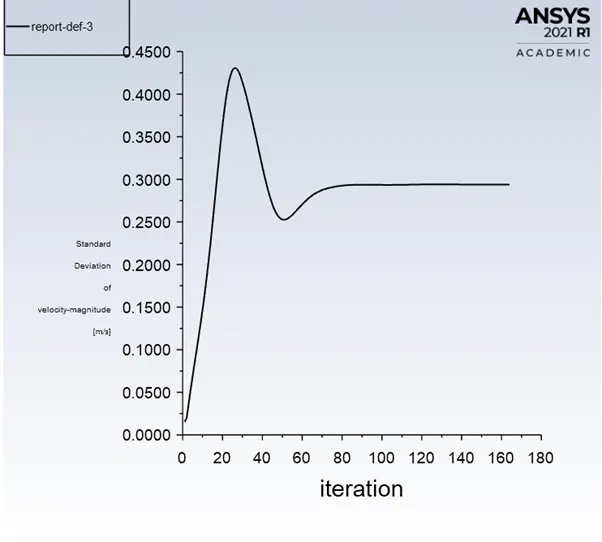
STANDARD DEVIATION OF TEMPERATURE AND VELOCITY
CONTOUR PLOTS OF TEMPERATURE AND VELOCITY:
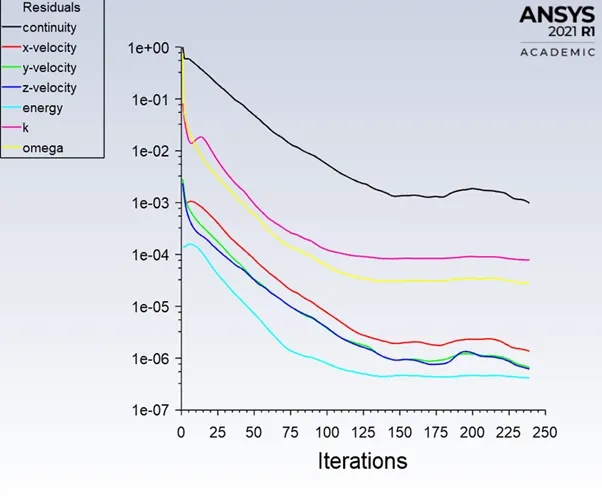
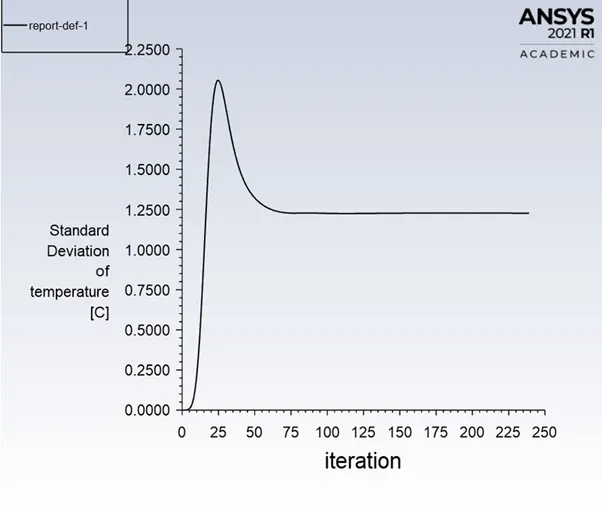
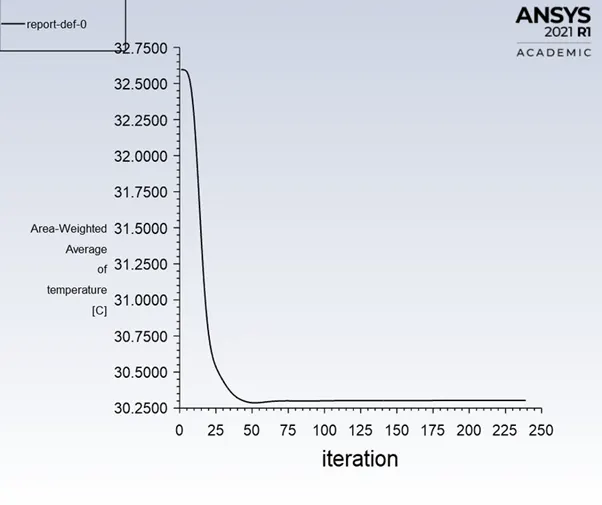
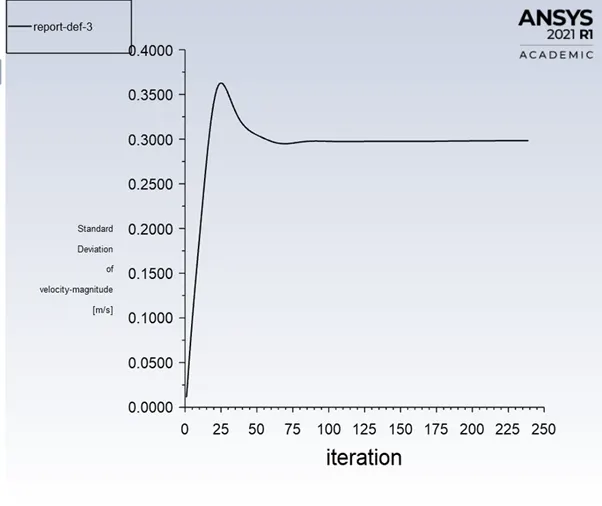
MODEL: K-OMEGA(SST)MODEL
MOMENTUM RATIO: 2
HOT INLET VELOCITY :3 m/sec
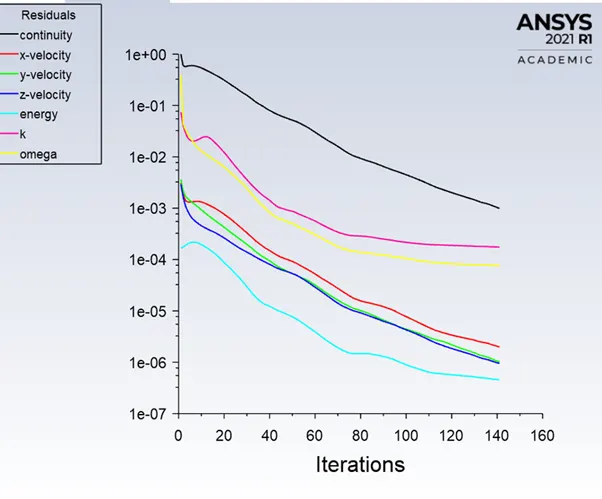
COLD INLET VELOCITY: 6m/sec RESIDUAL PLOT:
STANDARD DEVIATION OF TEMPERATURE AND VELOCITY
AREA WEIGHTED OF TEMPERATURE AND VELOCITY
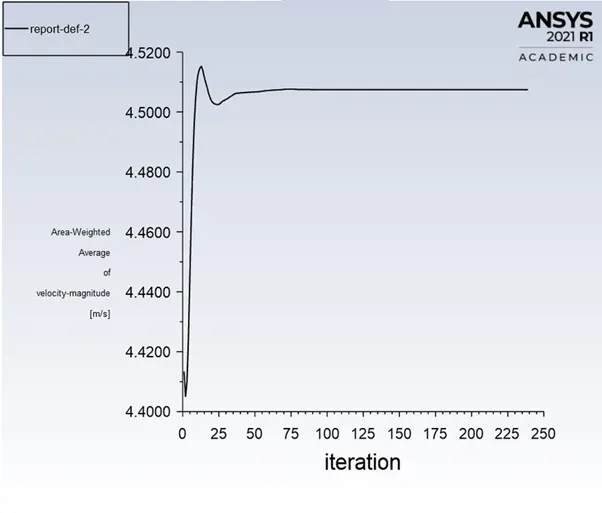
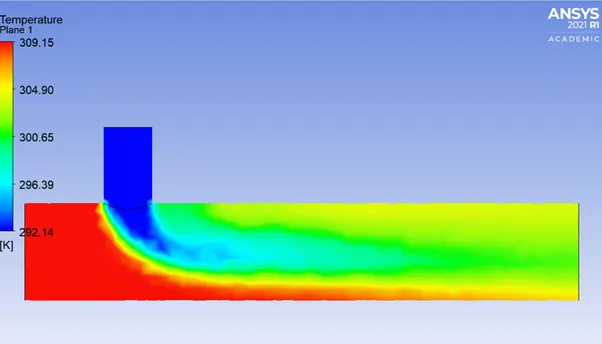
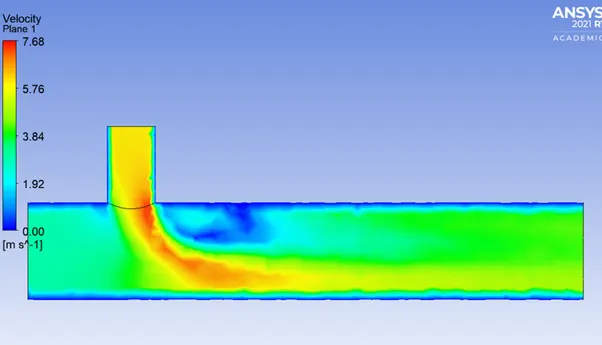
CONTOUR PLOTS OF TEMPERATURE AND VELOCITY:
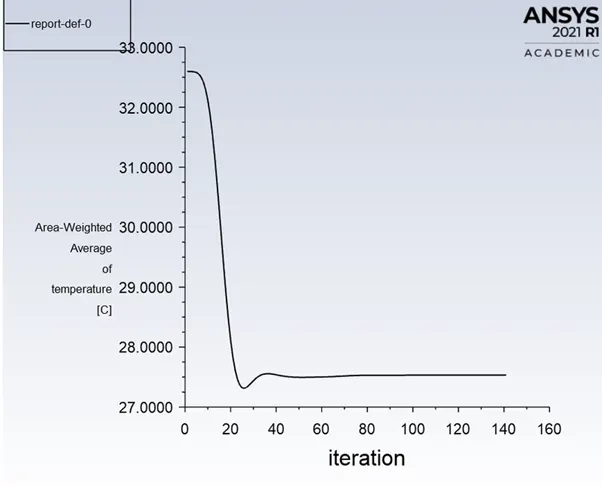
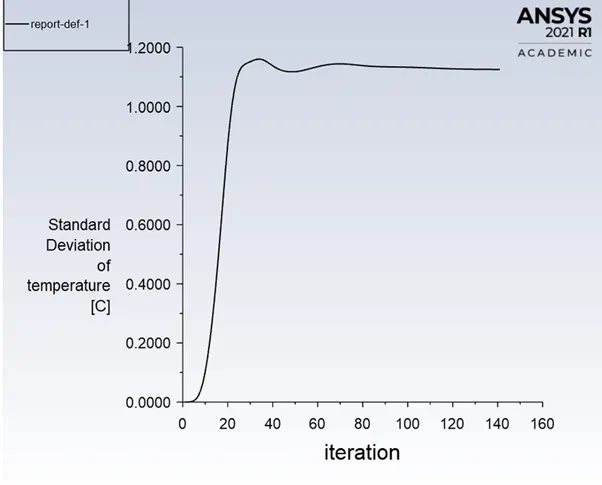
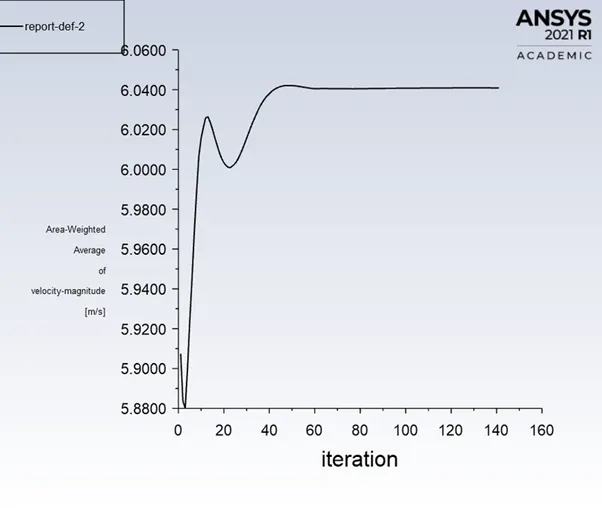
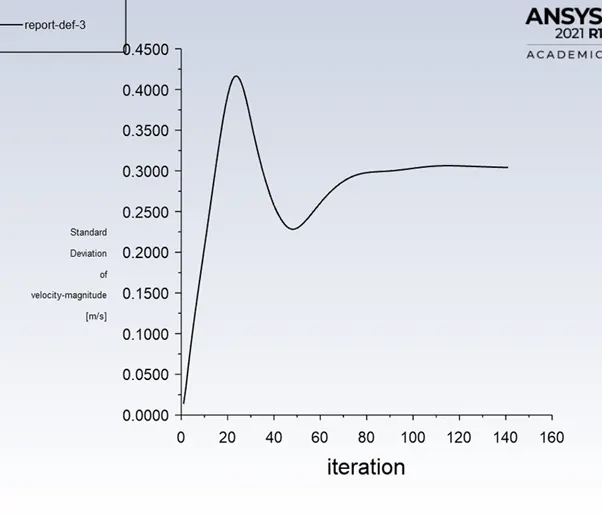
MODEL: K-OMEGA
MOMENTUM RATIO: 4
HOT INLET VELOCITY: 3m/sec
COLD INLET VELOCITY: 12m/sec RESIDUALS
AVERAGE WEIGHTED OF TEMPERATURE AND VELOCITY
STANDARD DEVIATION OF TEMPERATURE AND VELOCITY
CONTOUR PLOTS:
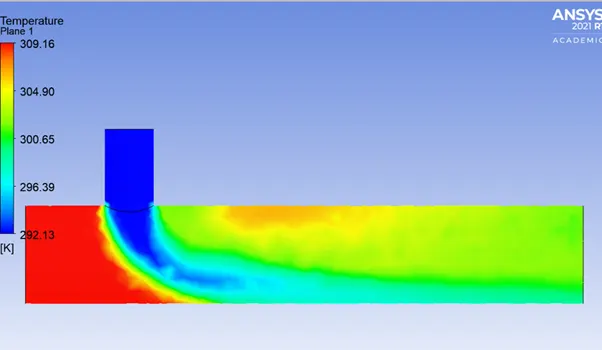
TEMPERATURE DISTRIBUTION
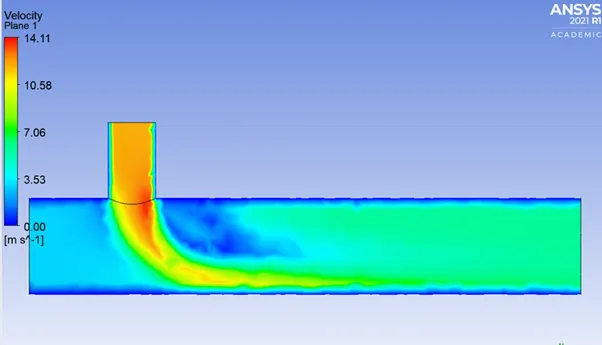
VELOCITY DISTRIBUTION
OBSERVATION:
- By comparing the above couture's, we can say that the k-epsilon model is extracting more turbulence than the K-omega(SST) model.
- converging time is more in the K-epsilon model as compared to the K-omega(SST)model.
- therefore we will be using the K-omega model for future calculations.
LONG LENTH TEE:
MODEL: K-OMEGA(SST) MODEL
MOMENTUM RATIO = 2
HOT INLET VELOCITY = 3m/sec at 36 0C
COLD INLET VELOCITY = 6m/sec at 19 0C
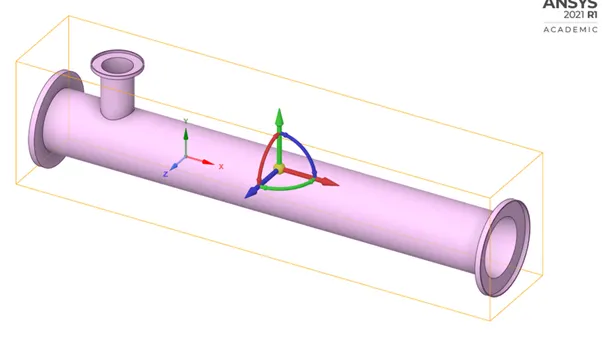
CAD MODEL FOR LONG LENGTH TEE
MESHED TEE: MESH SIZE 5mm
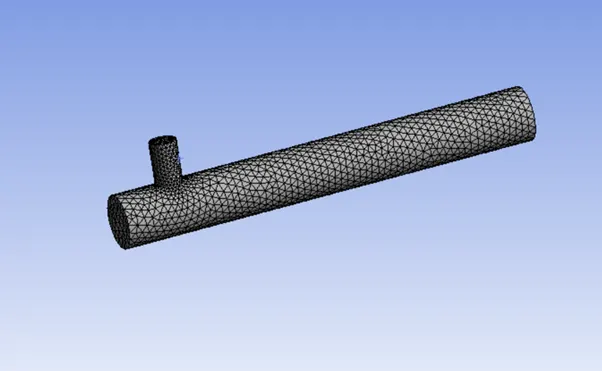
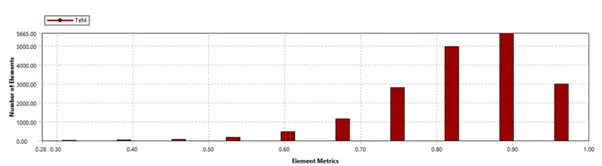
MESH MATRIX: The majority of mesh elements are in the range of 0.6 to 1.0 so mesh quality is acceptable.
RESIDUAL PLOT:
NODES: 28241
ELEMENTS: 139785
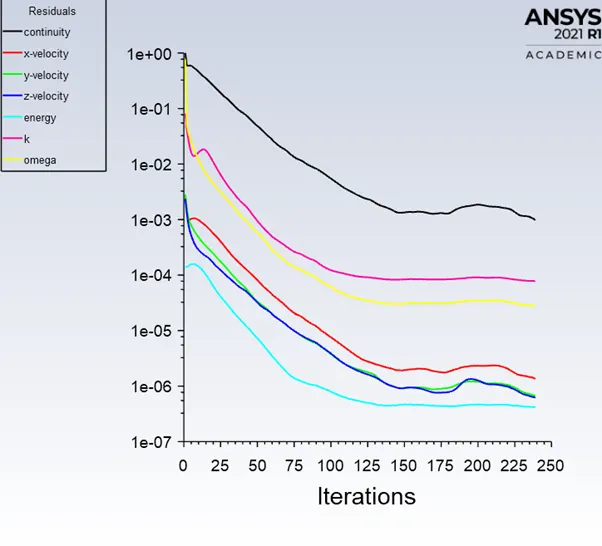
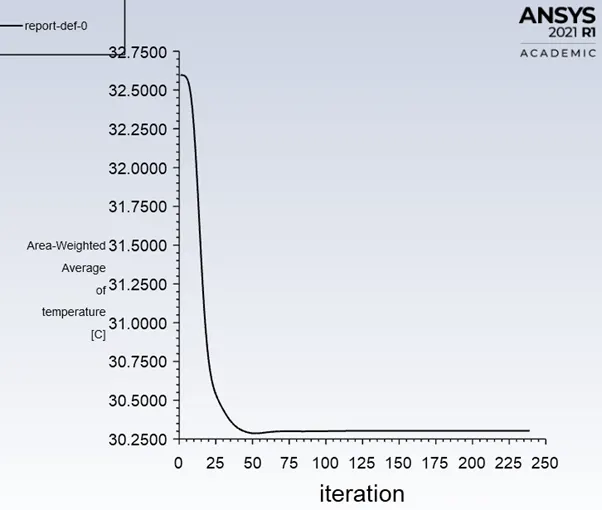
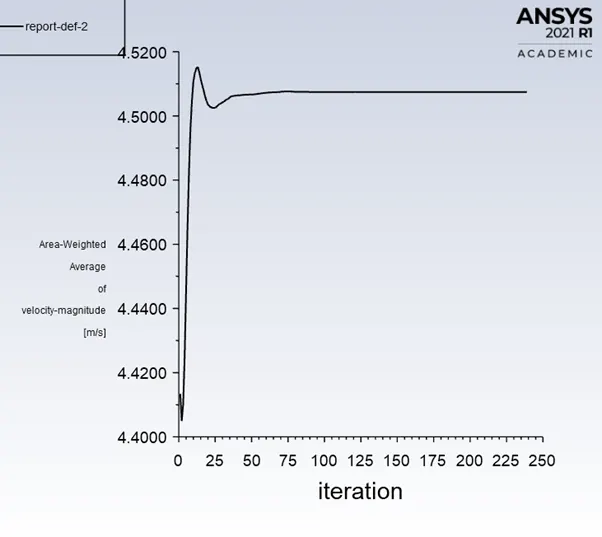
AVERAGE WEIGHTED OF TEMPERATURE AND VELOCITY:
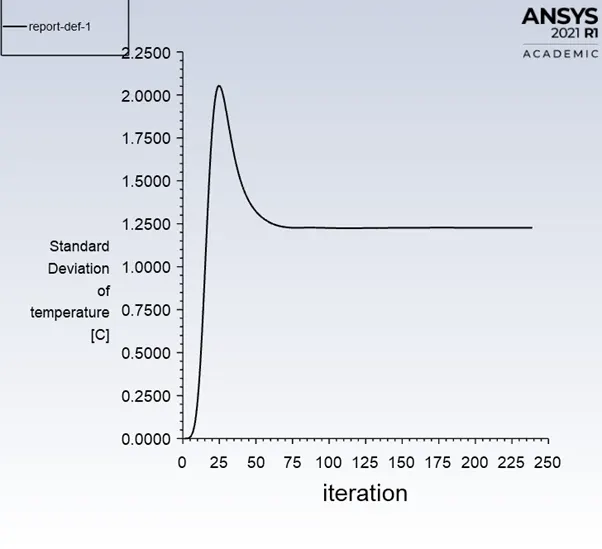
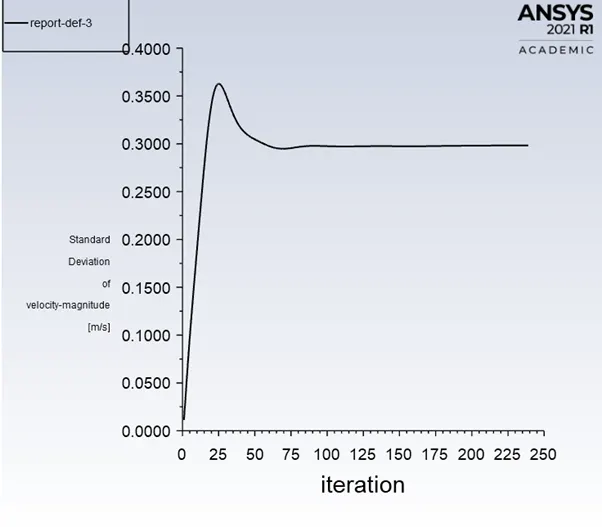
STANDARD DEVIATION OF TEMPERATURE AND VELOCITY
CONTOUR PLOTS
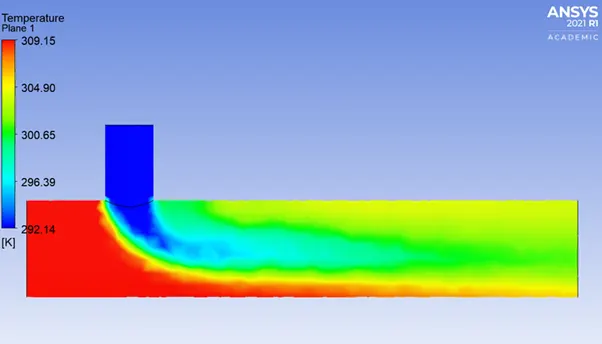
1. TEMPERATURE DISTRIBUTION
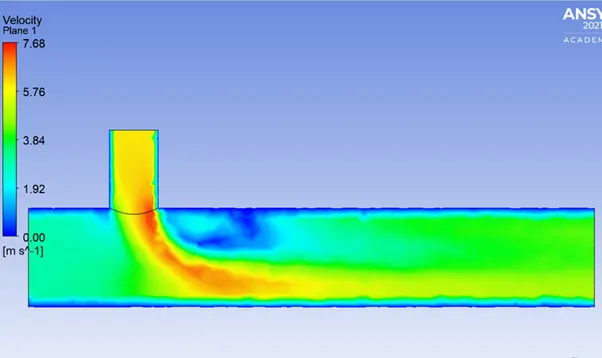
2. VELOCITY DISTRIBUTION
CONCLUSION:
- As the length of the pipe increases, the mixing of fluid time increases, and the temperature at the end also decreases.
- In both cases (K-EPSILON and K-OMEGA), k -epsilon has better results as we can see in the residual plot, and converge faster as compared to the k-omega(SST) model.