Week 1- Mixing Tee
Mixing Tee
Aim: To perform steady-state simulation by comparing the mixing effectiveness of 2 different models by varying inlet velocity of the cold fluid and provide a suitable model.
Cases :
Case I : Short mixing tee
Case II : Long mixing tee
Boundary conditions :
For both models, the same boundary conditions have been applied.
Boundary condition 1 (Momentum ratio = 2)
Hot inlet Velocity : 3m/s Hot inlet temperature: 39 deg.
Cold inlet velocity : 6m/s Cold inlet teperature : 19 deg.
Boundary condition 2 (Momentum ratio = 4)
Hot inlet Velocity : 3m/s Hot inlet temperature: 39 deg.
Cold inlet velocity : 12m/s Cold inlet teperature : 19 deg.
Geometry :
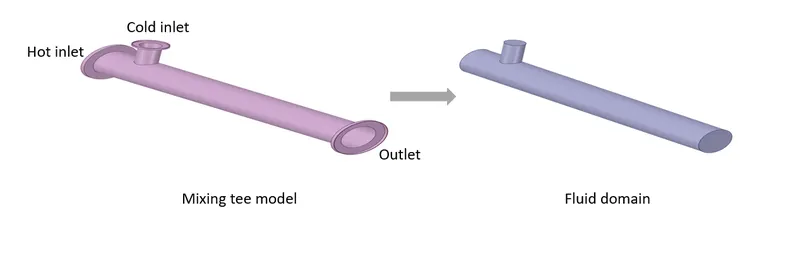
The geometry for the assignment has been provided as a short mixing tee and a long mixing tee. The Ansys Spaceclaim has been used for geometry cleanup as well as fluid domain extraction.
Meshing :
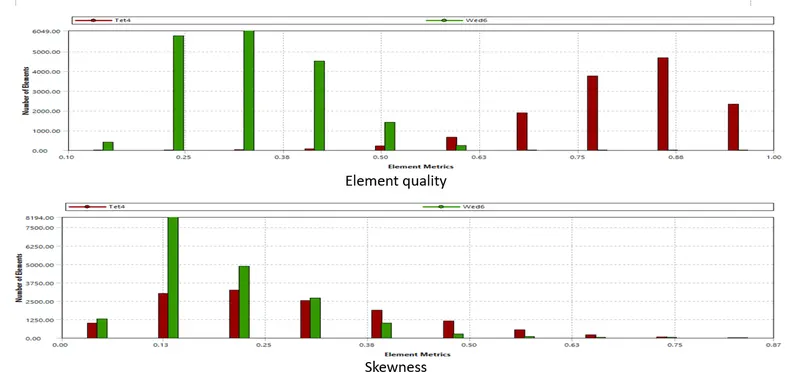
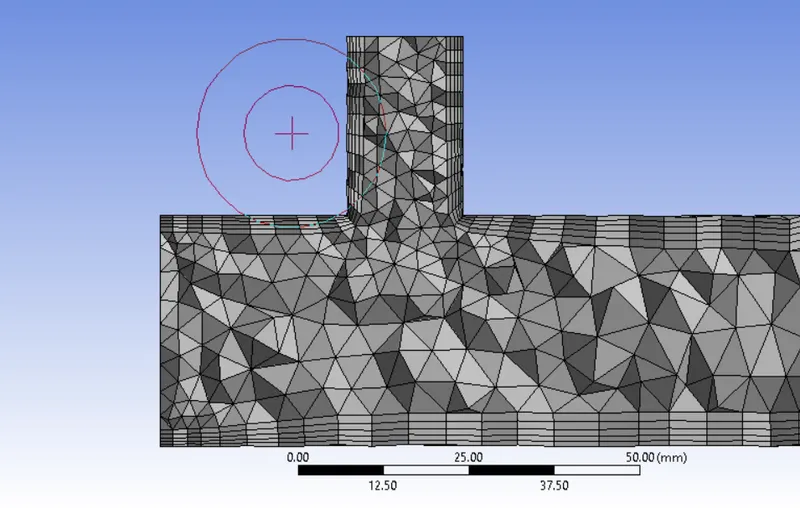
Meshing has been done using Ansys mesher. Initially, automatic meshing has been generated as per guidance. The refinement and inflation layer has been provided to improve mesh quality. The mesh quality report is shown in the following figure.
|
Parameter |
Case I | Case II | Case III |
| Element size | 2 mm | 2 mm | 5 mm |
| Max cell size | 25 mm | 25 mm | 25 mm |
| Mesh defeaturing size | 16 mm | 16 mm | 16 mm |
| Node count | 17541 | 50200 | 16555 |
| Element Count | 84468 | 271225 | 54221 |
Setup :
| Parameter | Case I | Case II |
| Turbulent model | K-epsilon | K-Omega |
| Energy equation | ON | ON |
| Wall treatment | ON | ON |
Solution :
Case I : Baseline simulation
Inlet velocity 3 m/sec and momentum ratio 2
Residual Plot
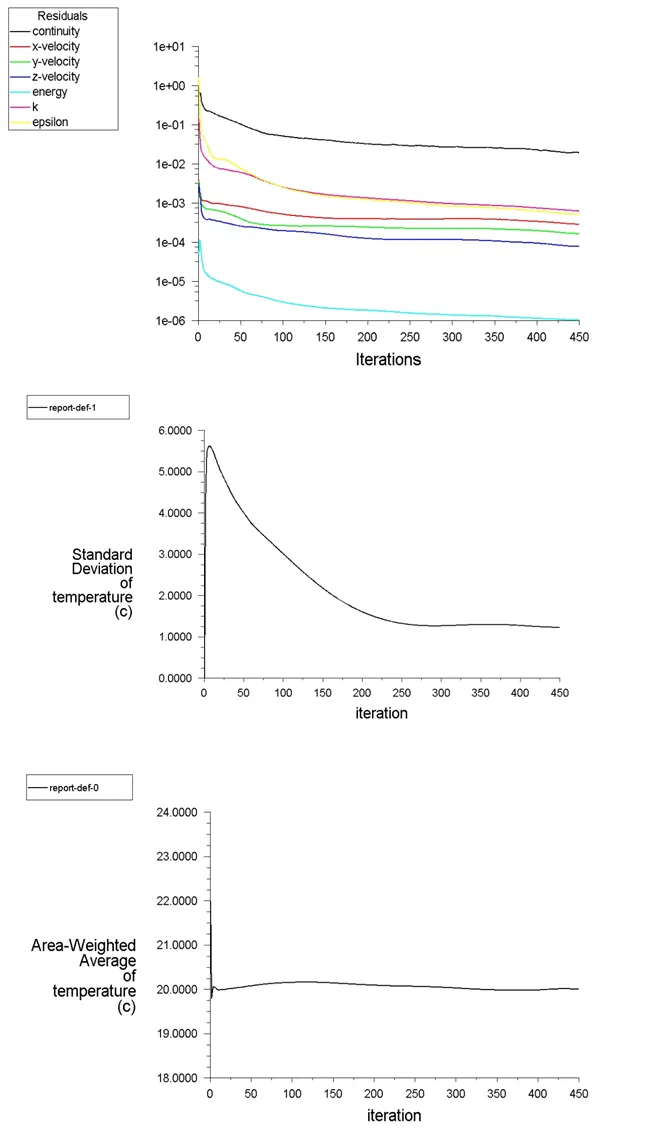
Standard deviation of temperature and temperature plot
Contour plots
Temperature contour plot
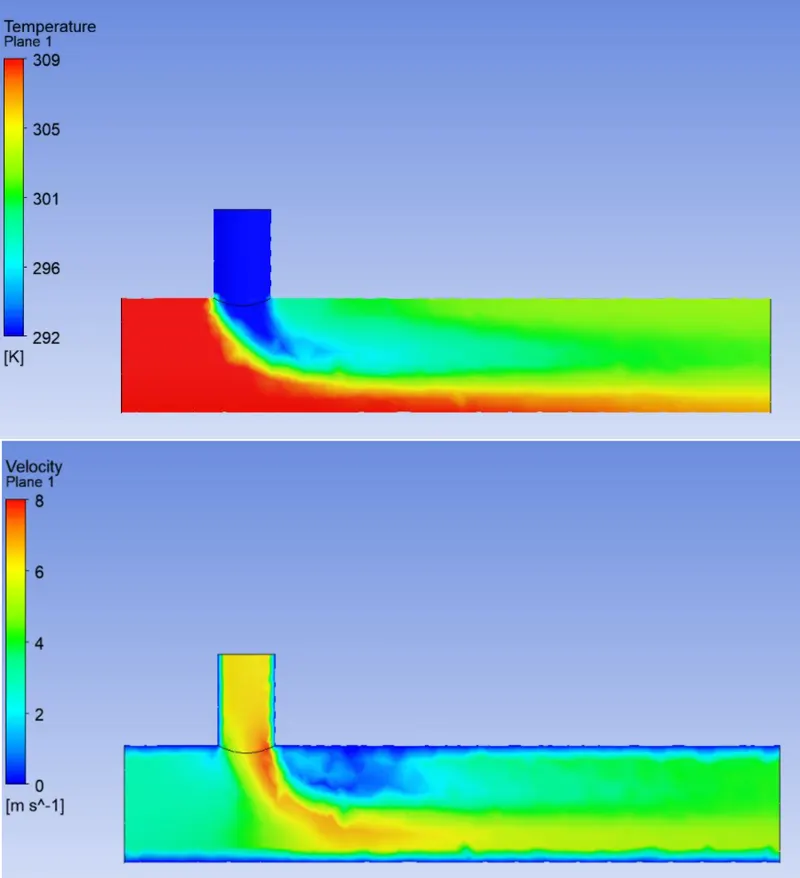
Velocity contour Plot
Case I :
Short mixing tee with inlet velocity 3 m/sec and momentum ratio 2
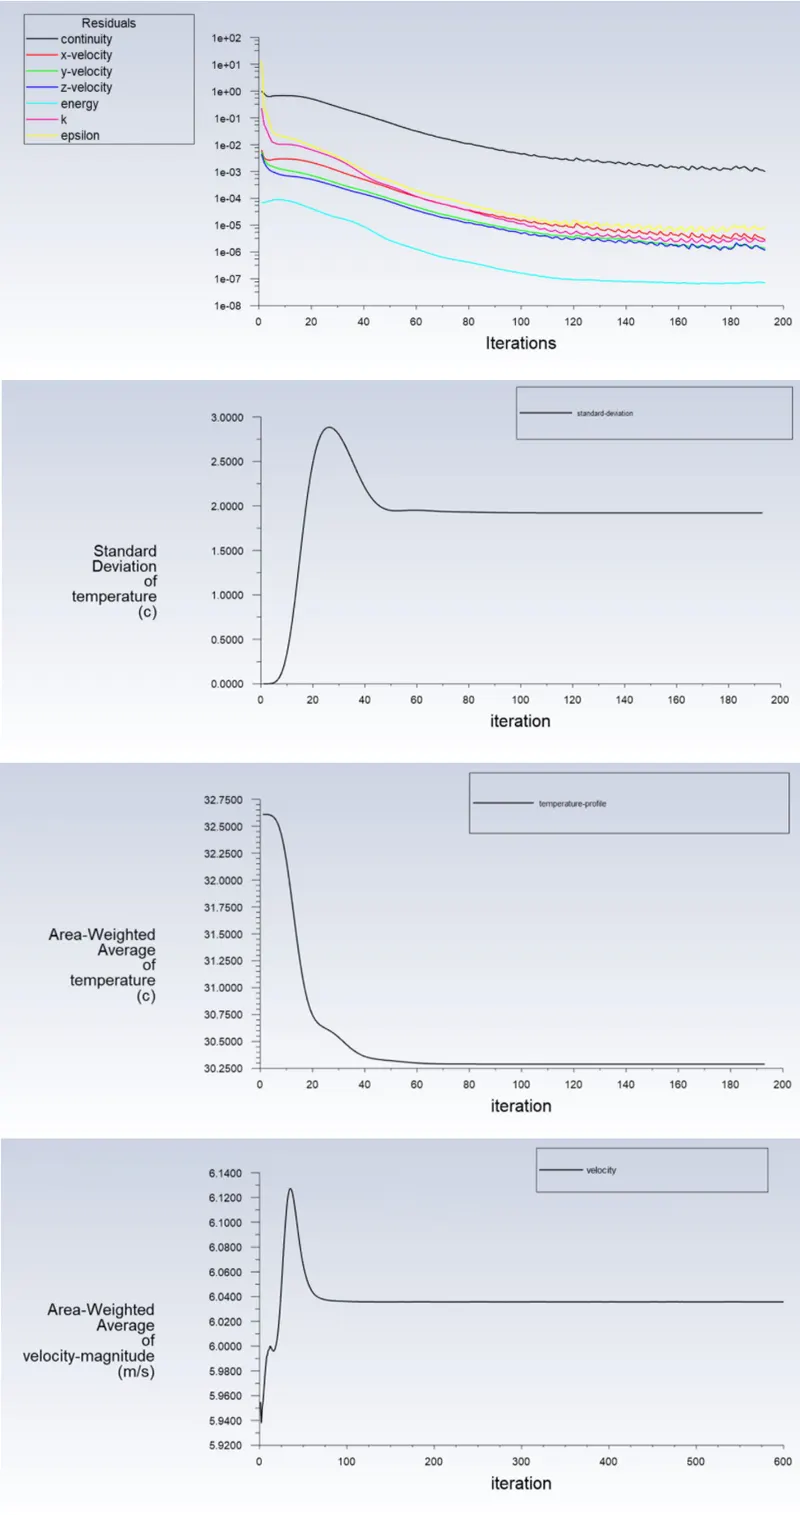
Residual Plot, Standard deviation of temperature plot, temperature plot, velocity plot
Contour Plots
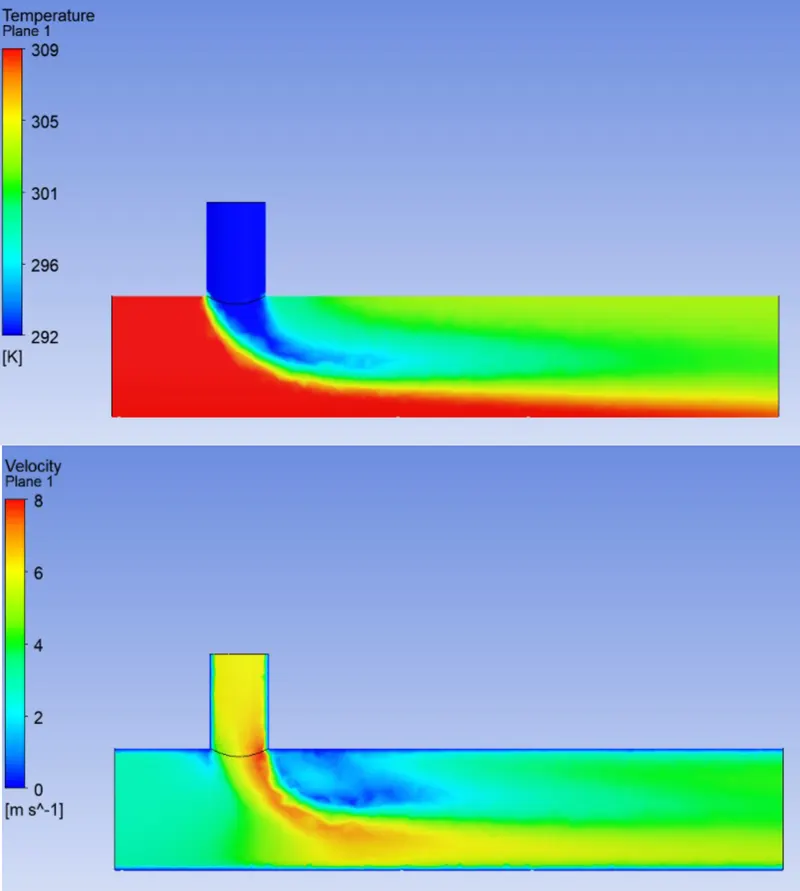
Temperature and velocity contour
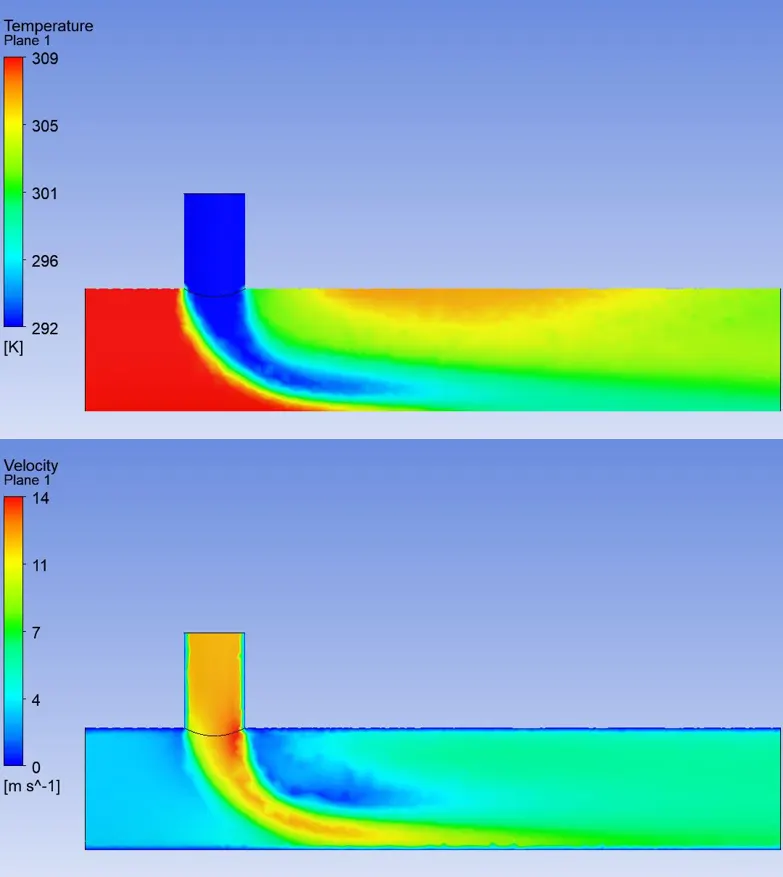
Short tee with inlet velocity 3 m/sec momentum ratio 4
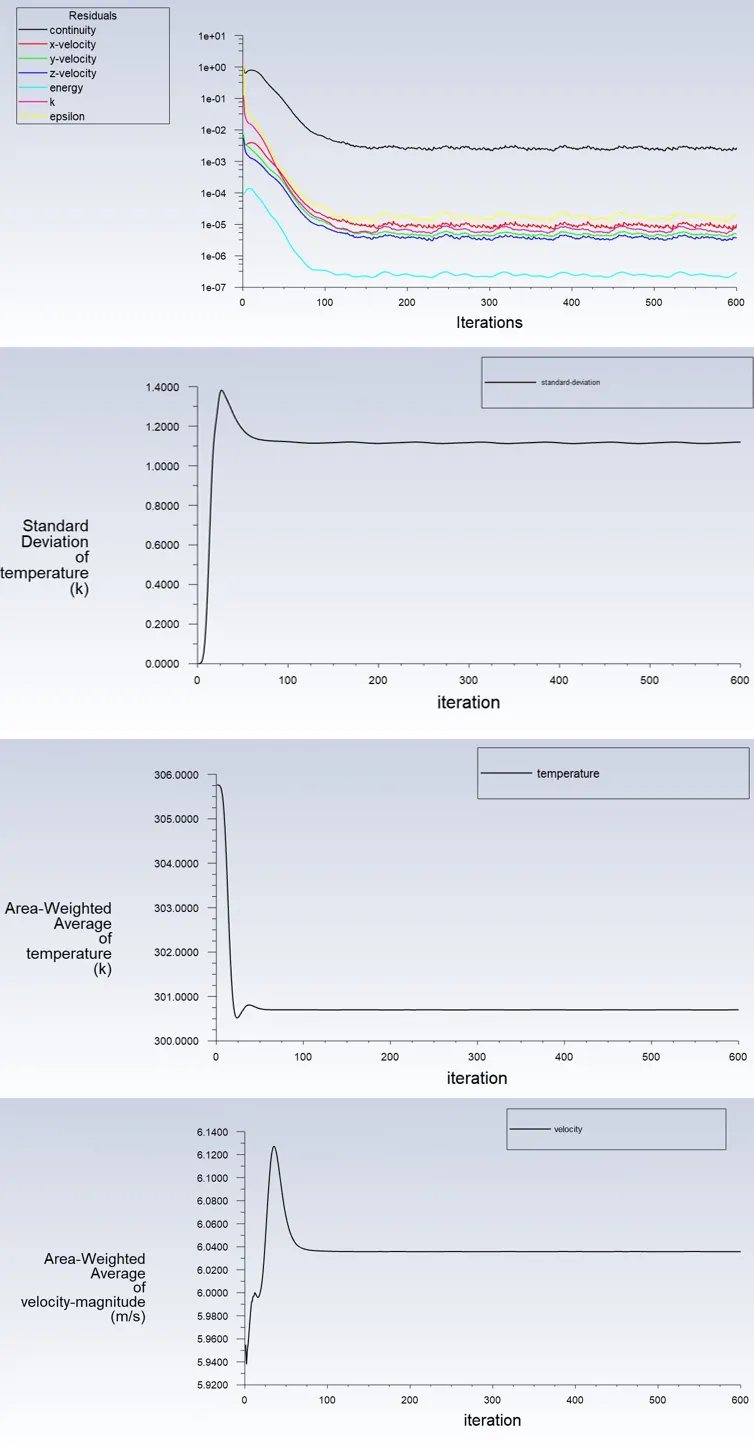
Residual plot, Standard deviation of temperature plot, Temperature plot, Velocity plot
Contour plots
Temperature contour plot and velocity contour plot
Case II :
Long mixing tee
Inlet velocity = 3m/s Momentum ratio = 2
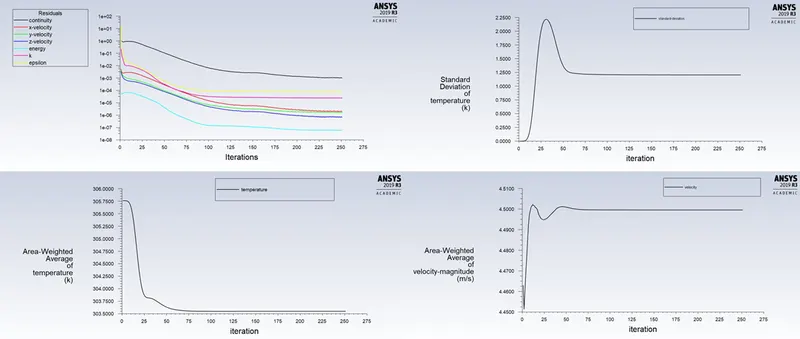
Residual plot, Velocity, Pressure and Temperature plots
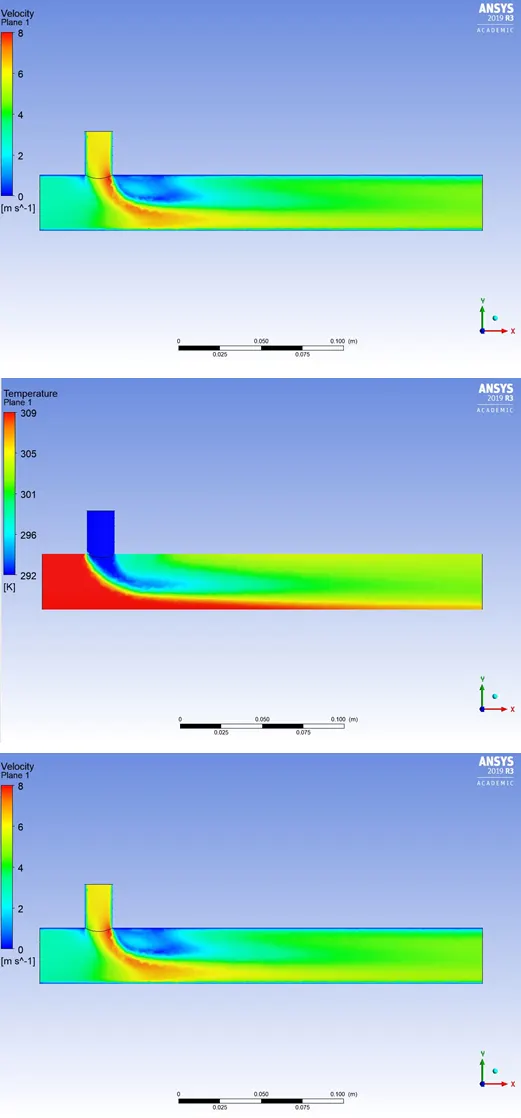
Velocity, Pressure, and temperature contour
Long mixing tee
Inlet velocity = 3m/s Momentum ratio = 4
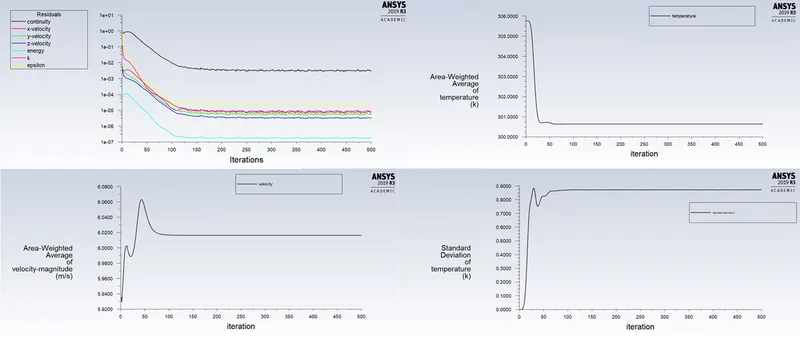
Residual plot, Velocity, Pressure and Temperature plots
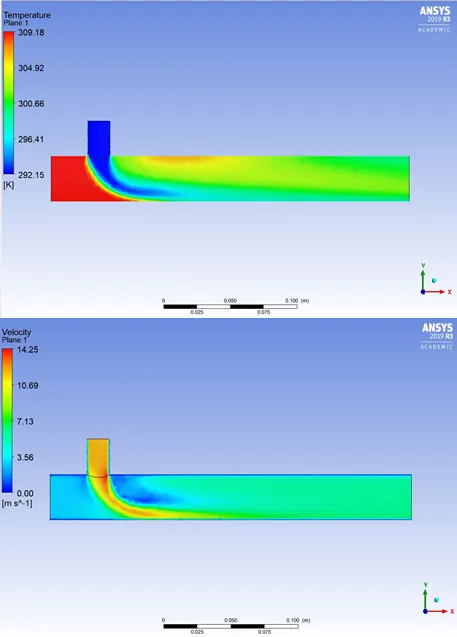
Velocity and temperature contour
Long mixing tee
Inlet velocity = 6m/s Momentum ratio = 2
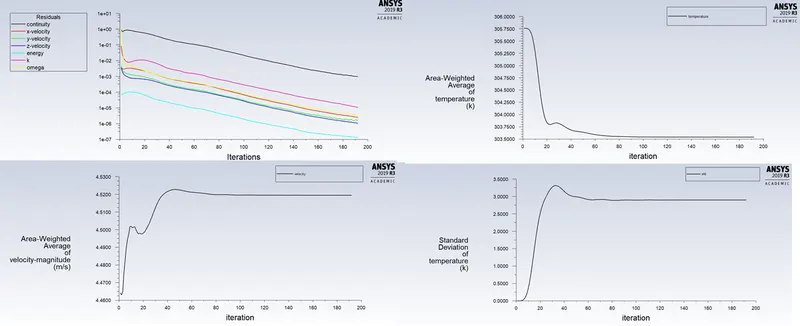
Residual plot, Velocity, Pressure and Temperature plots
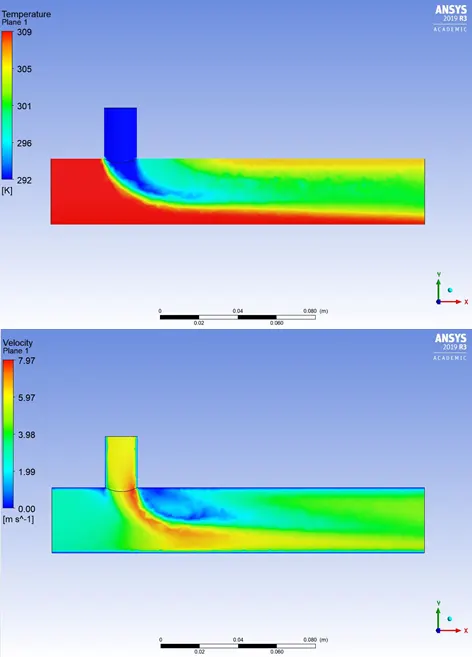
Velocity and temperature contour
| Case | Cell count | Average outlet temperature (K) | Number of iterations for convergence |
| Short tee- Momentum ration 2 | 1,05,751 | 303.439 | 192 |
| Short tee- Momentum ration 4 | 1,05,751 | 300.699 | 200-250 |
| Long tee- Momentum ration 2 | 1,40,510 | 303.549 | 250 |
| Long tee- Momentum ration 4 | 1,40,510 | 300.639 | 200-250 |
CONCLUSION:
- As seen in Case-1-a and Case-1-b, the temperature at the outlet drops down significantly due to the high velocity of cold air from the inlet. This is possible due to the turbulent mixing at the tee joint between hot air and cold air because of the high velocity of cold air., which is not possible in the case of low-velocity cold air.
- The temperature contour at the outlet for short tee cases shows that some of the high temperatures flow sips through without properly mixing with the flow. Whereas, in the temperature contour of long tee cases, the high temperatures flow thoroughly mixes with the rest of the flow.
- Therefore, we can recommend using the long tee and high-velocity inlet for application. This is because we have a low standard deviation in the case of a long tee compared to the short tee for both momentum ratios.
- k- epsilon model predicts well far from the boundaries (wall) and k- omega model predicts well near the wall. Even though it depends on Y+. Therefore, the K-epsilon model is majorly used for free flow away from the wall and as in this project, there is no dealing with the wall of the mixing tee for change in temperature along the length of it, so the K-epsilon model was chosen for further simulations.