Week 1- Mixing Tee
Aim:
to set up steady-state simulations to compare the mixing effectiveness in a mixing tee when hot and cold air was passed through different inlets respectively at different velocities
Given:
hot inlet temperature is 360C & the Cold inlet is at 190C
- Case 1
- Short mixing tee with a hot inlet velocity of 3m/s.
- Momentum ratio of 2, 4.
- Case 2
- Long mixing tee with a hot inlet velocity of 3m/s.
- Momentum ratio of 2, 4.
Momentum ratio = velocity at cold inlet / velocity at hot inlet
introduction:
mixing tee is a part that mixes fluid of different temperatures to one. an example for this type of assembly is mixing of air in AC vent.
it shows clearly at the end of temperature diffusions by two diagrams
in this challenge we gonna isolate the inner volume and we mesh it.
then we need to apply boundary condition and initialize it.
We can calculate the fluent and simulate it.
Theory:
Mixing tee is a T joint which mixes fluids at 90 degree angle.
it is more effective and easier to understand precisely.
we can isolate inner volume to work on it because air flows through the inner volume.
finite volume method is an approximation process. it may vary practically.
we can use some of energy equations to solve it precisely.
Process:
Case 1:
open ansys work bench
drag and drop fluent model in screen
double click on geomentry
open short tee from downloaded files
outer geomentry has only heatflux and so for flow simulation we does not need it hence we can extract only inner volume in space claim.
click prepare >> volume extract >> select edges ( openings of pipe) >> click green mark
hide and suppress for physics the component .
it wil shows like this.
close the window the component will save automatically
now double click mesh which opens mesh module
select each faces and right click to name it as inlet x ; inlet y; outlet and wall
now generate mesh
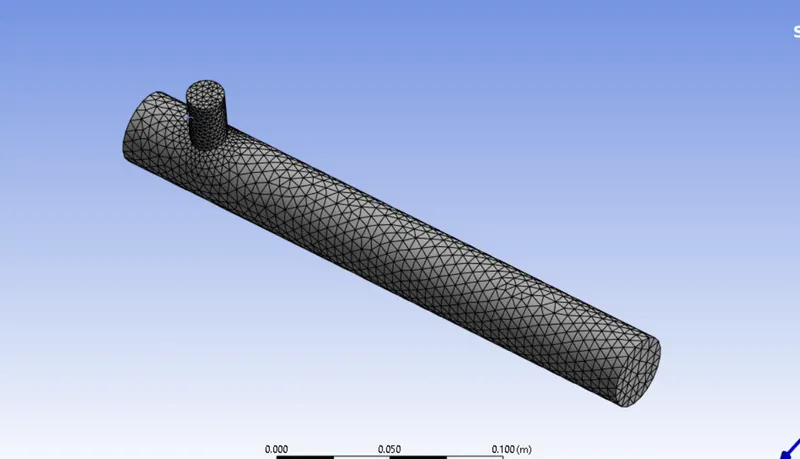
it will create mesh accordingly
Cell count will be 12780 and 15727 for short and long tee
mesh quality will be taken by default by software.
click section plane >> create lines >> it will cut geomentry in xy plane
we can see that mesh is so dense at connection area
check quality and also at graphs the quality will not be lower than 5%.
now close the window.
double click setup and it will launches ansys fluent.
in console we can check for run time errors and other warnings.
click setting up physics
click on energy dialog box click on steady state.
click viscous model>>k epsilon>>realizable>> std wall function>> ok
assign boundary condition>> parameters like inlet x and inlet y
give detais such as velocity as 3 m/s and temp 36 degree celsius for inlet x
by solving momentum ratio we get factor of 2 by that we can obtain inlet y velocity as 6m/s and temp as 19 degree celsius
click definitions >> new>> area weighted avg>>temp>> outlet>>report file; report plot>> ok
click definitions >> new>> std deviation>>temp>> outlet>>report file; report plot>> ok
click initialization>>hybrid>>initialize
click calculate with 150 iterations
it will solve model and plot respective graphs automatically
close window
close ansys fluent and double click results it will take you to cfd post.
active all parts
click on wall and make it fully transparent
click insert>>location >> plane 1 >> at middle >>okay
click colours as variable >> temp >> to see the temperature mixup
by that we can see all factours by diferent colours.
by same procedures we can solve case 2 and we can compare results
let us gone through the challenges
let take short tee first
let us compare results between momentum 2 AND 4
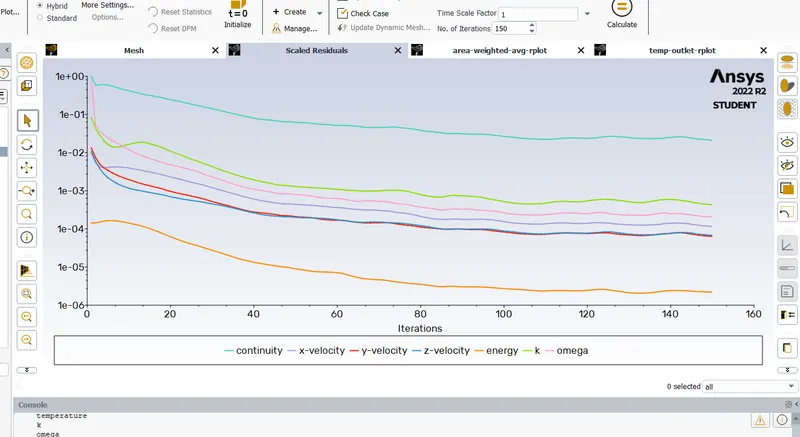
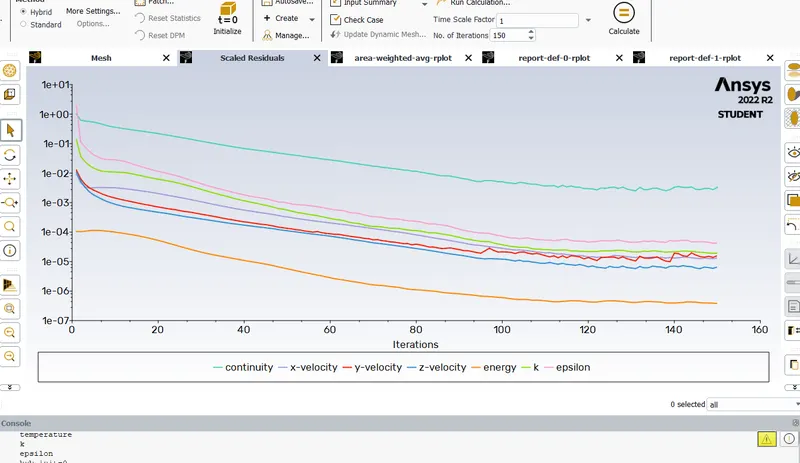
above scalar plaot for momentum 2 in short tee
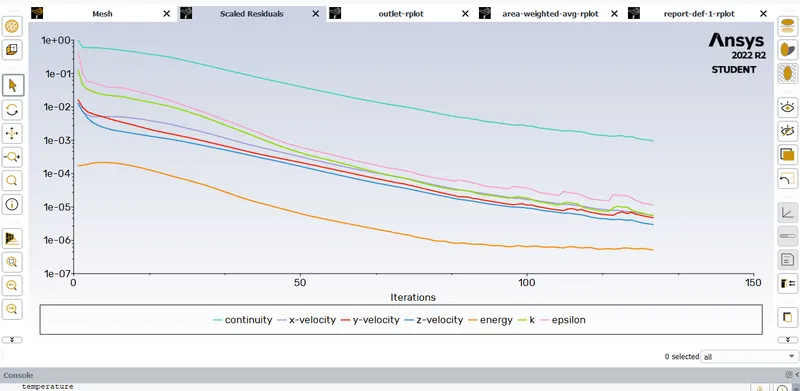
above is scalar plot for momenttum 4 in short tee
hence by above plot we can tell for convergence to achieve we need 130 iterations
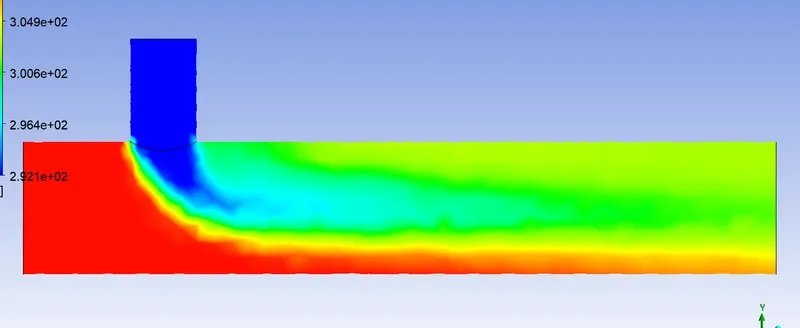
temperature difference across pipe for momentum 2
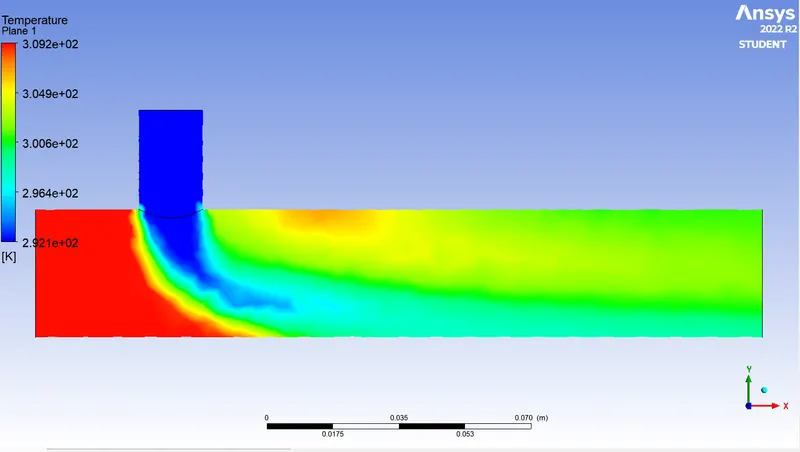
temperatur across pipe for momentum 4
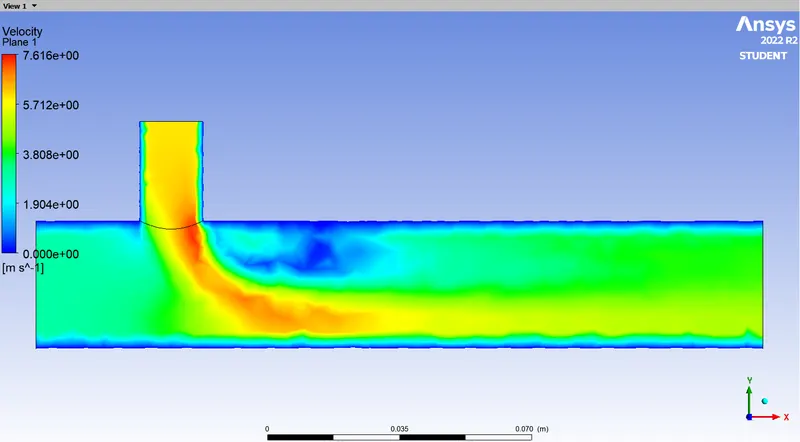
velocity contour for momentum of 2
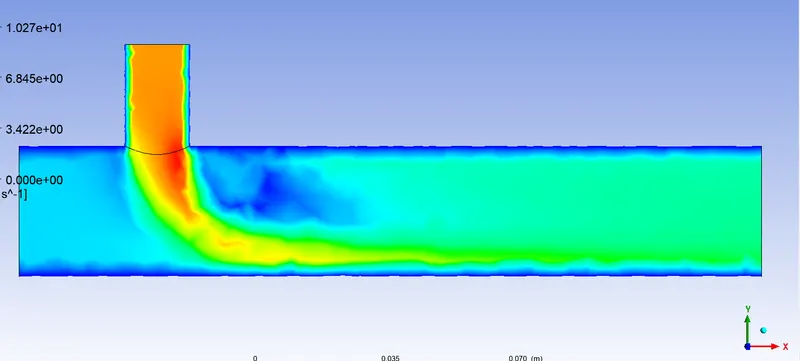
velocity contour for momentum 4
lets see about long tee
scalar plot for momentum 2
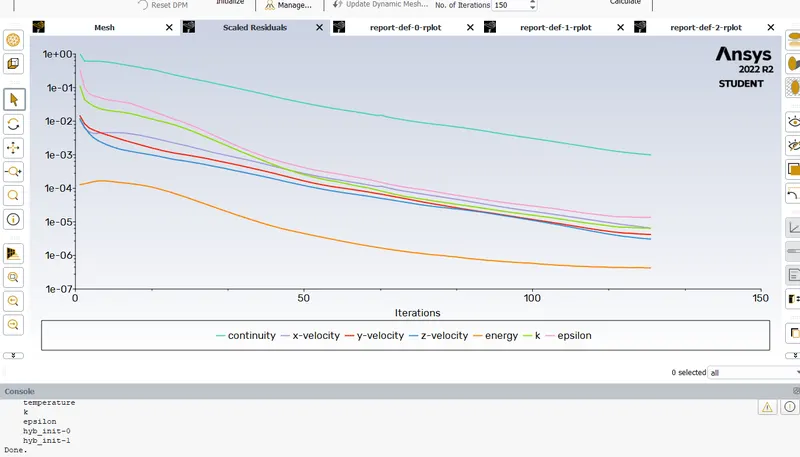
scalar plot for momentum 4
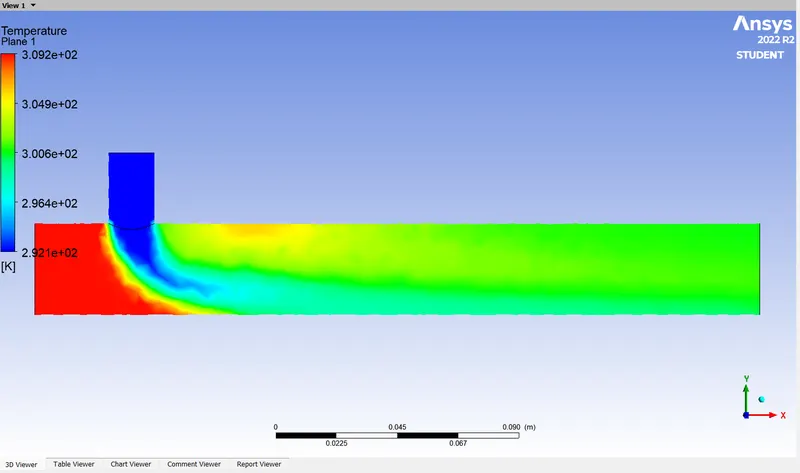
temperature along pipe for momentum 2
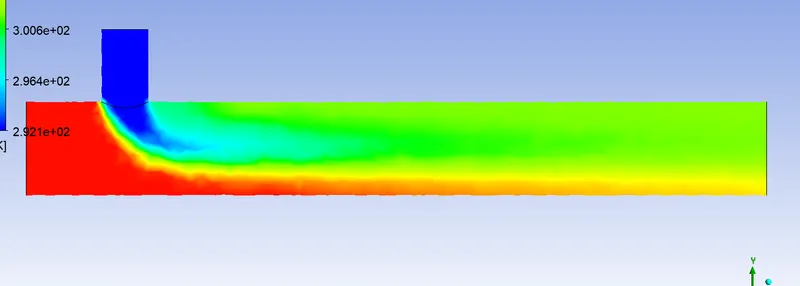
temp along pipe for momentum 4
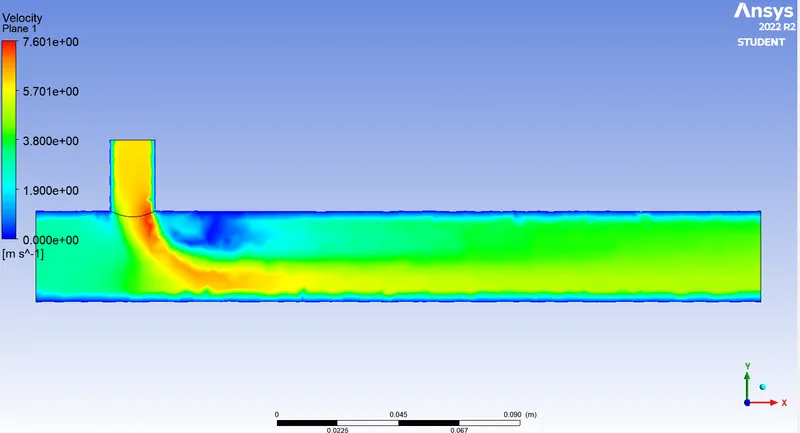
velocity differnce across pipes momentum 2
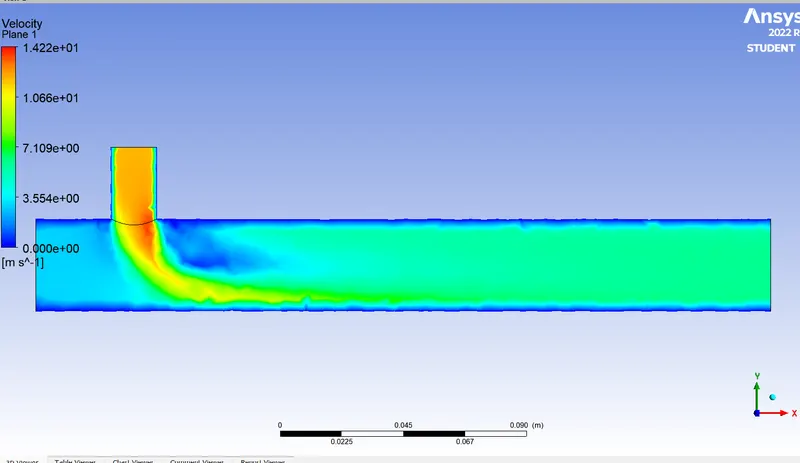
velocity differnce across pipes momentum 4
Results:
refer to the table below which contains comparision between 4 cases
| s.no | type | description | cell count | avg outlet temperature | no of iterations for convergence |
| 1 | short tee |
momentum 2 Vc=6m/s Vh=3m/s |
12780 | 31.15 degree celsius | 150 |
| 2 | short tee |
momentum 4 Vc=12m/s Vh=3m/s |
12780 | 27.65 degree celsius | 150 |
| 3 | long tee |
momentum 2 Vc=6m/s Vh=3m/s |
15727 | 30.83 degree celcius | 150 |
| long tee |
momentum 4 Vc=12m/s Vh=3m/s |
15727 | 27.3 degree celsius | 150 |
thus from the above table we can recognize following details,
1. for same cross section differnce in momentum results in diffrent outlet temperature
2. also for the same momentum differnt in length also affects the outlet temperature.
3. all the temperature contour plots given above its clearly shown that temperature varies in according to length due to mixing of air.
Conclusion:
Thus flow analysis in a mixing tee with different crosss section and with differnt momentum are discussed.