Week 1- Mixing Tee
-
For this challenge, we have created two versions of the mixing tee. One of them is longer than the other.
Your job is to set up steady-state simulations to compare the mixing effectiveness when hot inlet temperature is 360C & the Cold inlet is at 190C.
- Case 1
- Short mixing tee with a hot inlet velocity of 3m/s.
- Momentum ratio of 2, 4.
- Case 2
- Long mixing tee with a hot inlet velocity of 3m/s.
- Momentum ratio of 2, 4.
- Formulas
- Momentum ratio = velocity at cold inlet / velocity at hot inlet
- Objective-To set up steady-state simulations to compare the mixing effectiveness when hot inlet temperature is 360C & the Cold inlet is at 190C. To perform simulation for short mixing tee with a hot inlet velocity of 3m/s and Momentum ratio of 2, 4. Also to perform simulation for Long mixing tee with a hot inlet velocity of 3m/s and Momentum ratio of 2, 4.
-
In a table, compare the following values from the 2 cases.
- Cell count
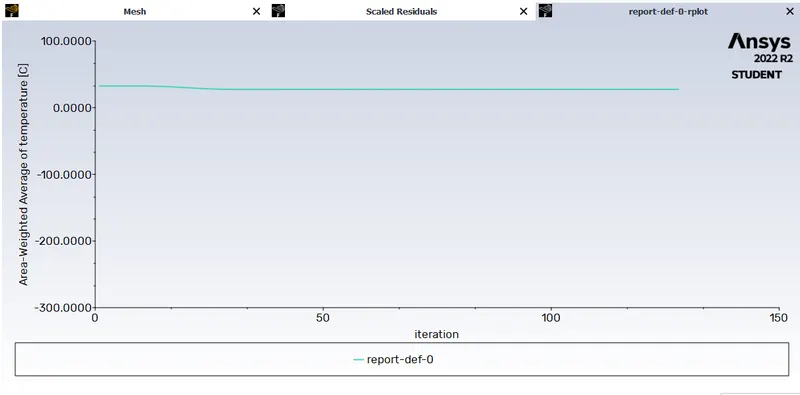
- Average outlet temperature
- Number of iterations for convergence
- Mixing tee means the combination of two fluids which is flowing through a geometry.
- Steady-state simulation is used to investigate the steady-state behavior of a system, and the simulation continues until the system reaches steady state.
- Steady state assumes that variables are constant over time.
-
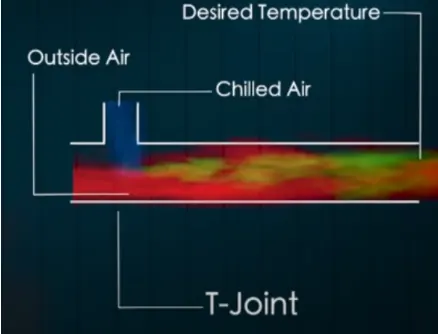
The function of mixing Tee is to provide proper mixing of quantities to get the desired result at the outlet.
-
By controlling the speed of the cooled air, you can keep the room at the desired temperature.
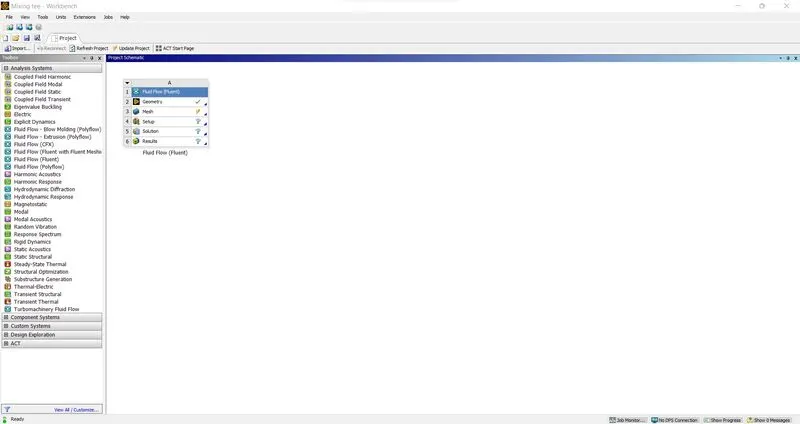
- GEOMETRY: Create 2D or 3D representations of objects to be modeled and tested using the ANSYS construction plane coordinate system.
- MESH: At this point ANSYS knows the structure of the part. Next, we define how to decompose the modeled system into finite parts.
- Setup: Case setup is done with Ansys Fluent.
- Solution: Ansys Fluent where visualization of runtime results is done.
- Results: Results are post-processed here in CFD Post.
- Short tee
- Workbench
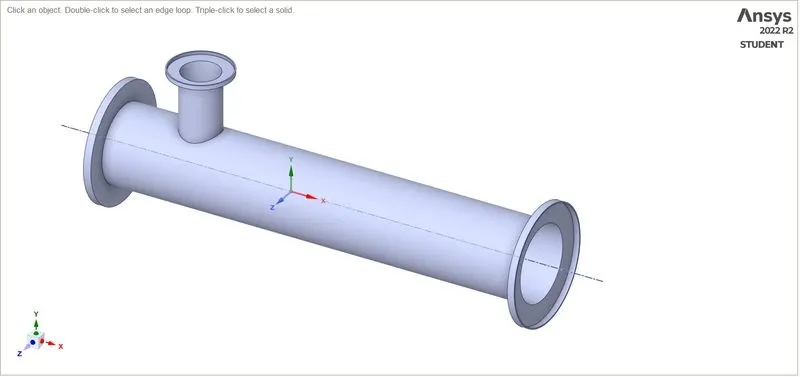
- Geometry setup
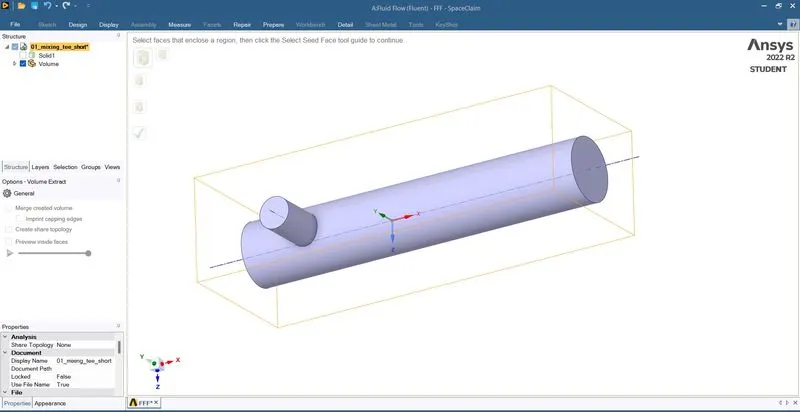
- Volume Extraction
- Mesh Generation
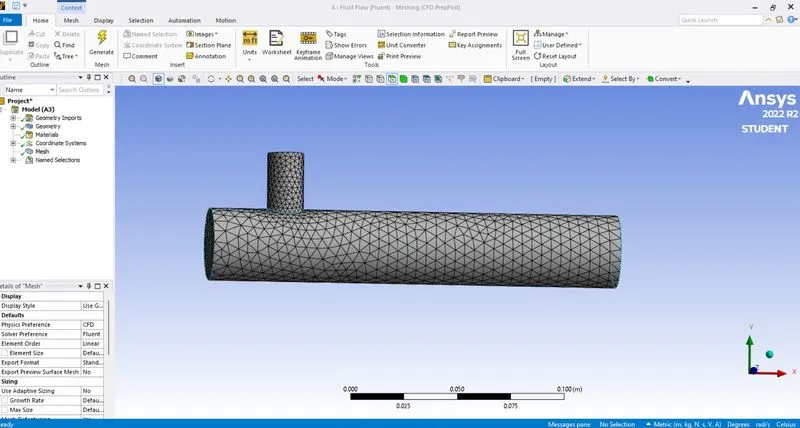
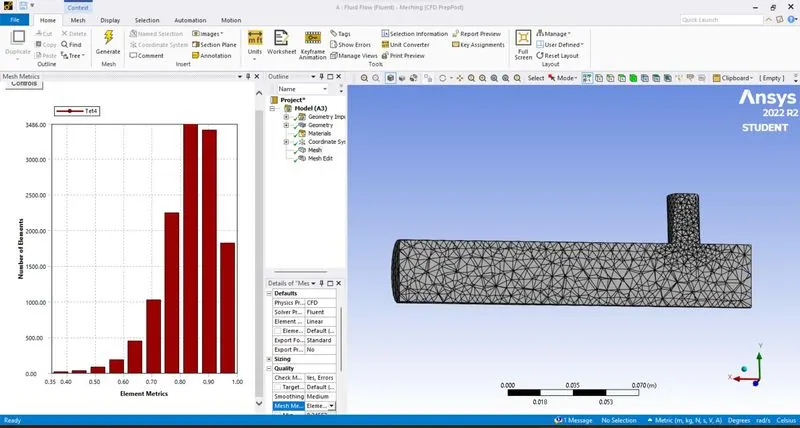
Mesh Metrics and section plane
- Steps
- Calculation models are uploaded to Ansys space claim as step files.
- For this project, we are interested in performing liquid flow analysis through geometry, so we used the volume extraction option to extract the liquid volume from the geometry.
- The physics solid model is then constrained from the fluid model and a mesh is created in the region of interest. The boundary names Inlet_x, Inlet_y, Outlet, and Wall are defined using the named option.
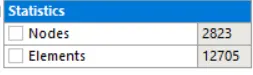
- After generating the mesh, use the statistics option to find out the number of nodes and elements. Then check the mesh quality by selecting the Mesh Metrics option in the Quality section.
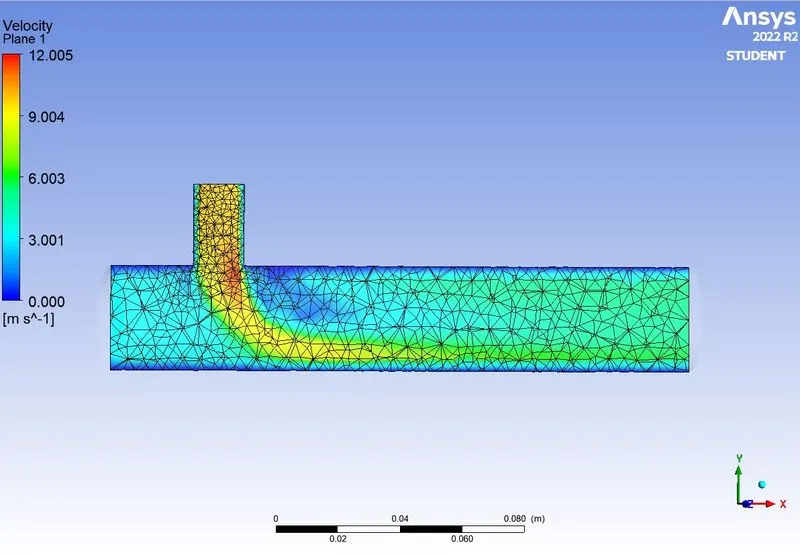
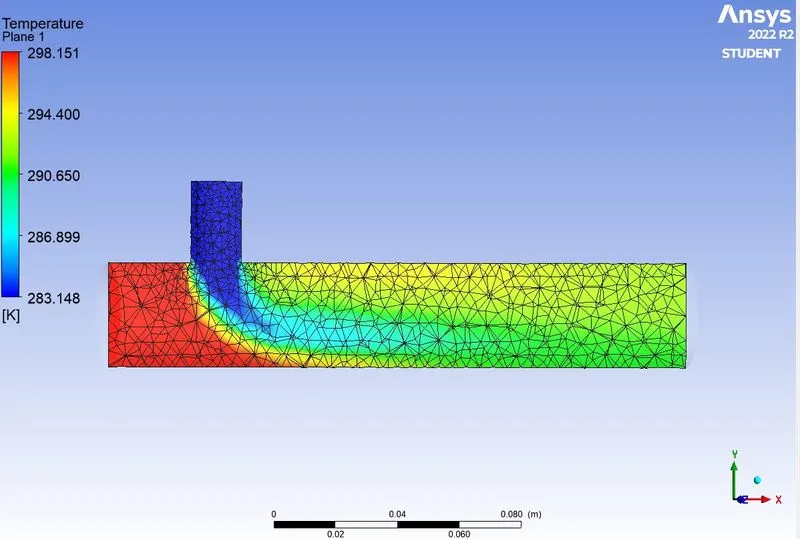
- K-epsilon model results
- Momentum ratio = velocity at cold inlet / velocity at hot inlet
- Inlet -y = 10 m/s and Inlet -x = 3 m/s
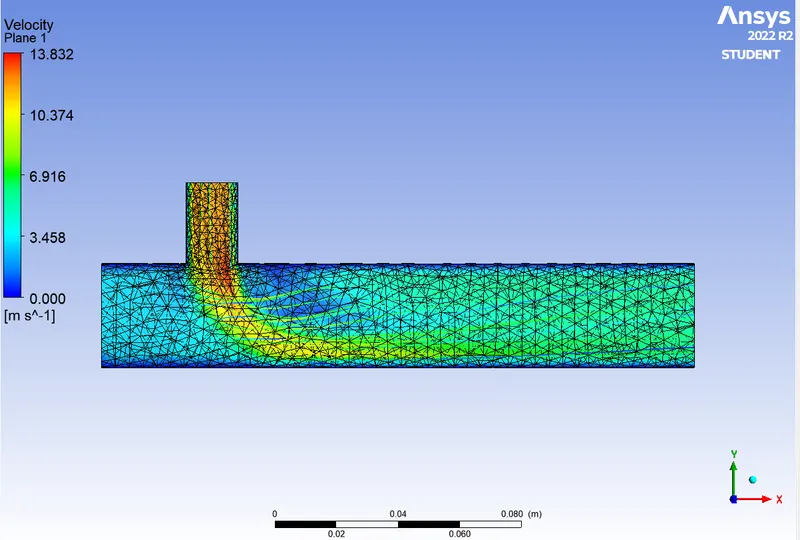
- Velocity contour
- Temperature contour
-
SETUP AND SOLUTION:
CASE 1:
- Short mixing Tee with a hot inlet velocity of 3m/s
- Momentum ratio of 2,4
- Momentum ratio = 6/ 3 = 2
- Momentum ratio = 12/3 = 4
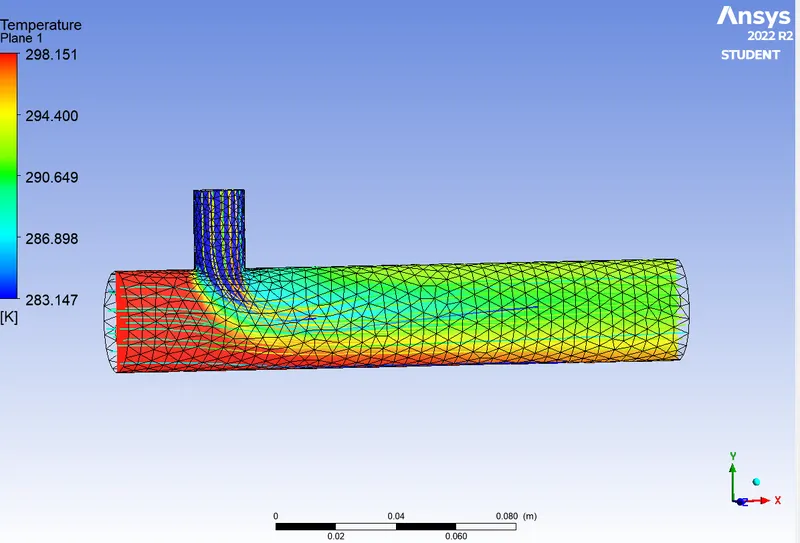
- Momentum ratio =2 , Solver - k-epsilon model
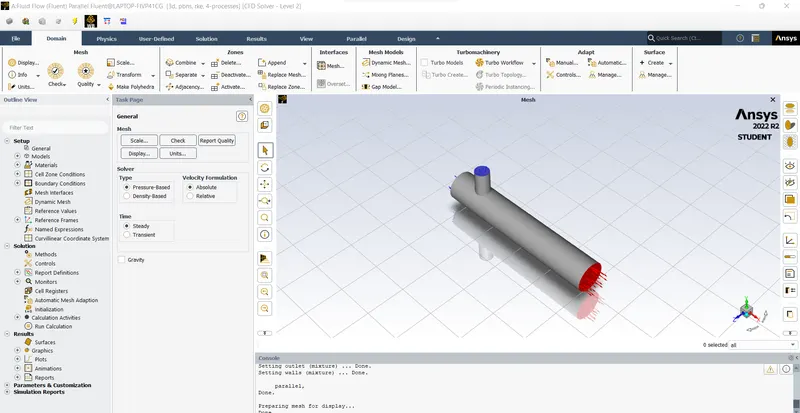
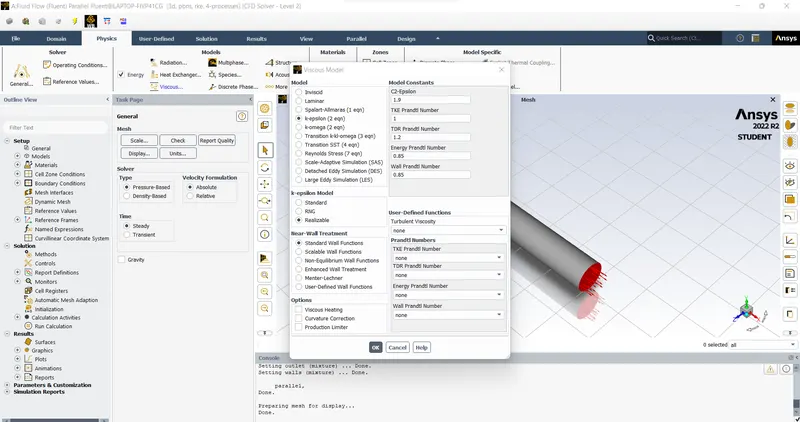
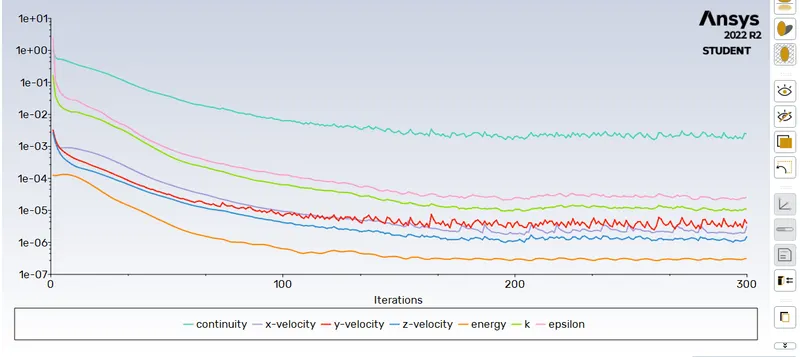
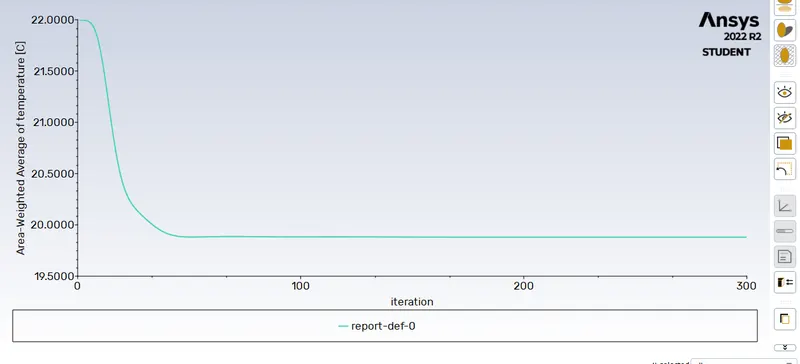
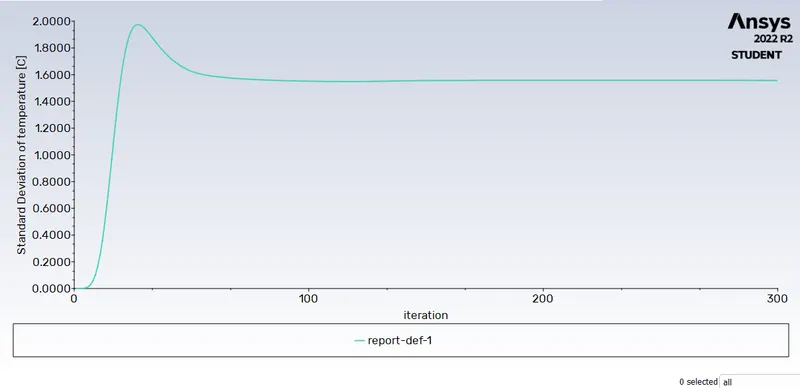
- Residuals
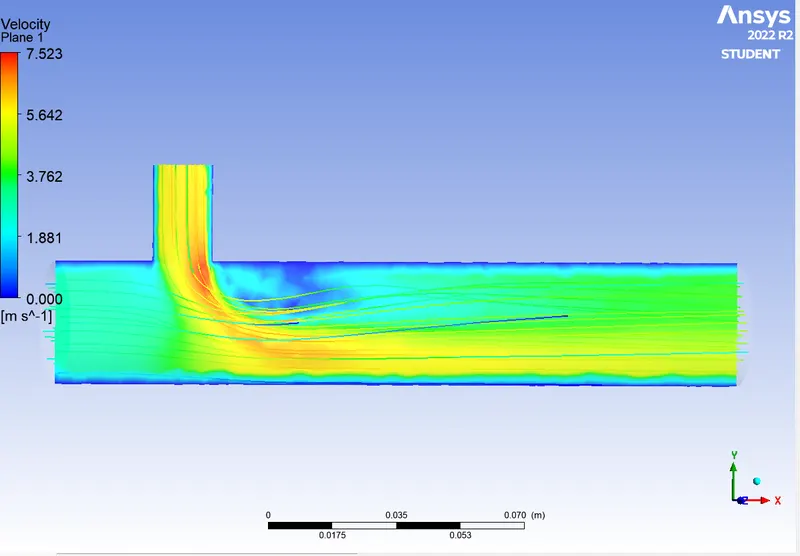
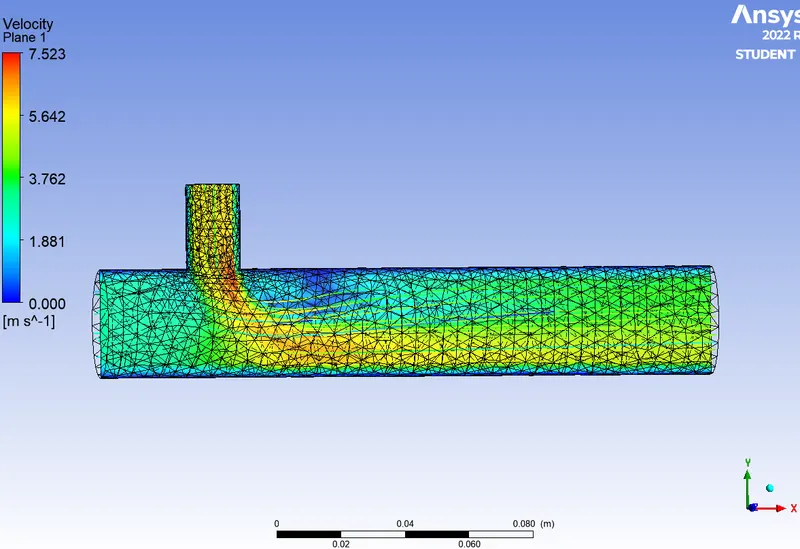
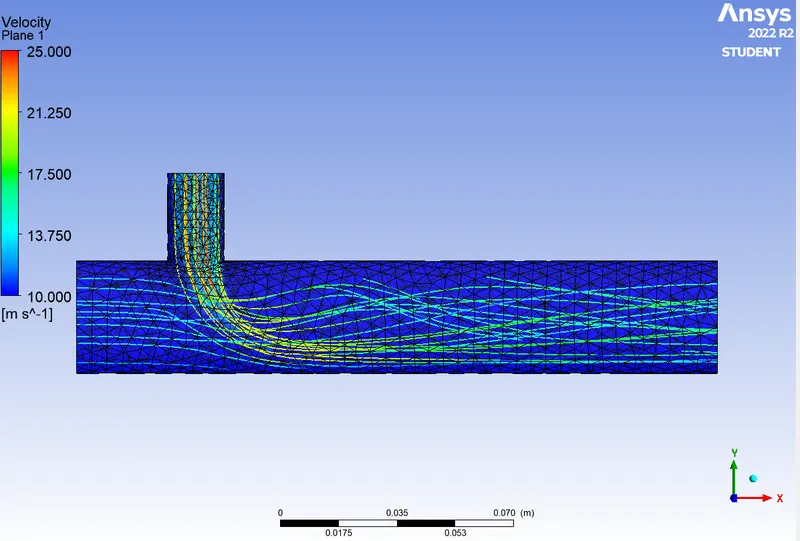
- Velocity stremline contour
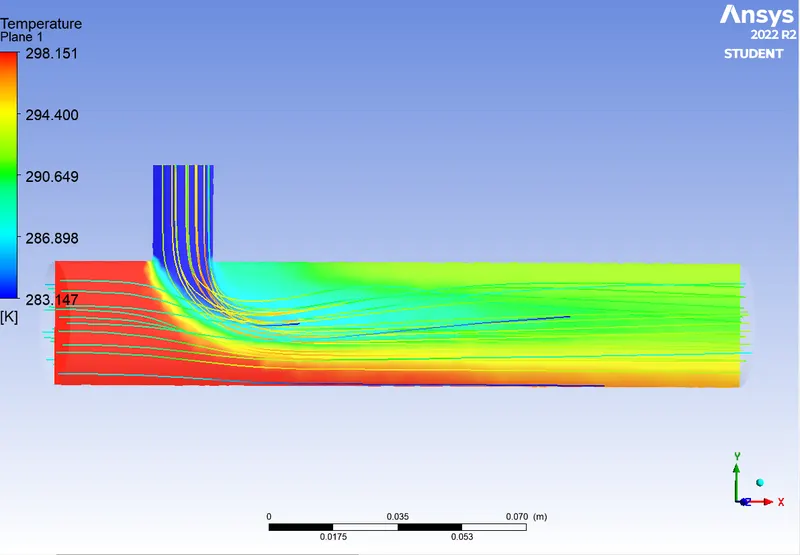
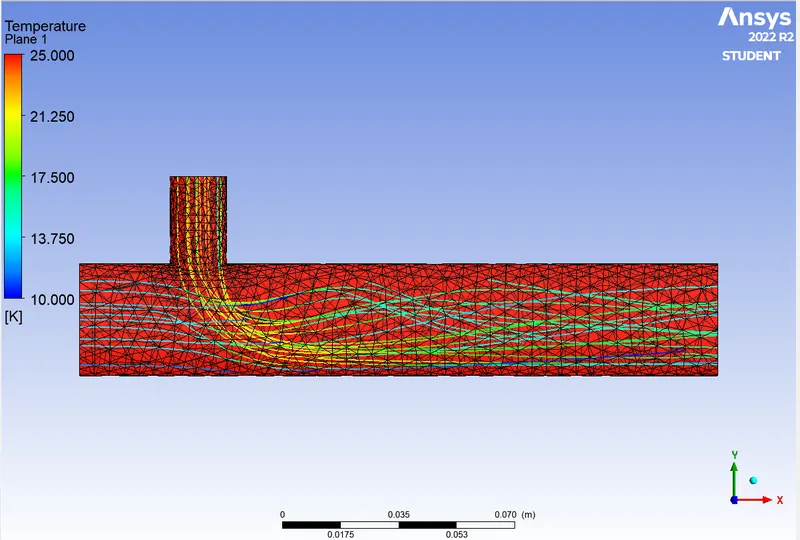
- Temperature streamline contour
- K-omega model
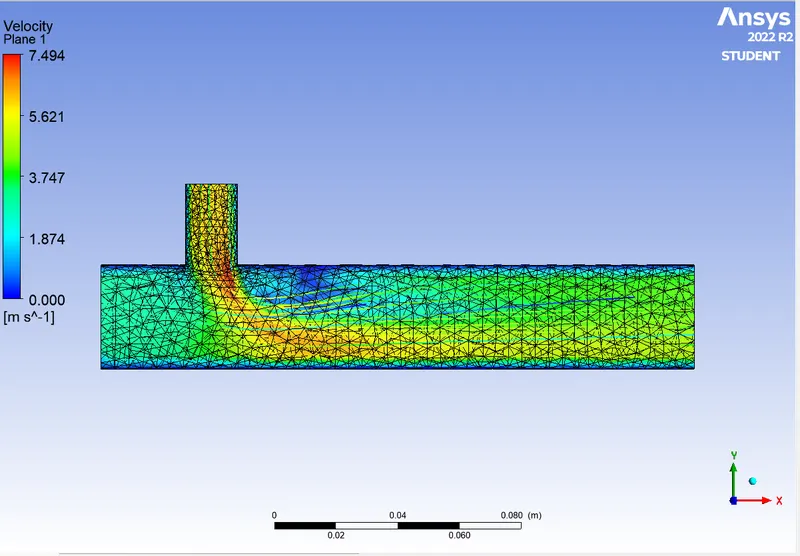
- Velocity contour
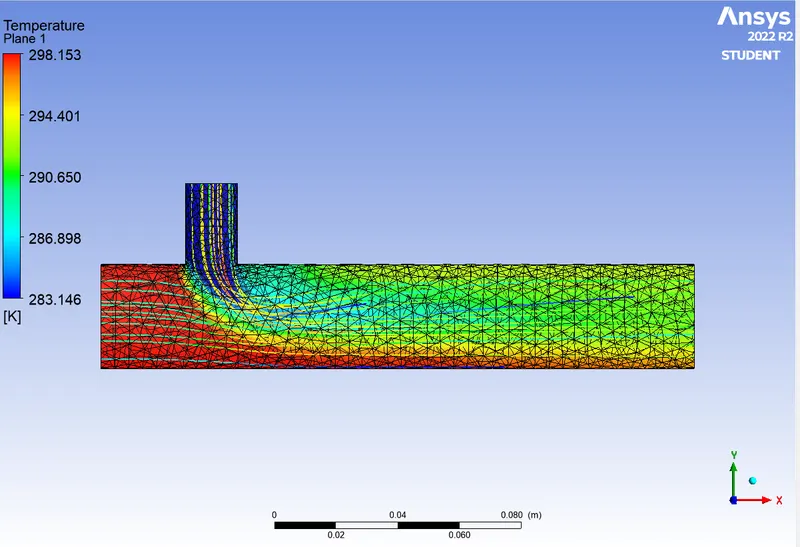
- Temperature contour
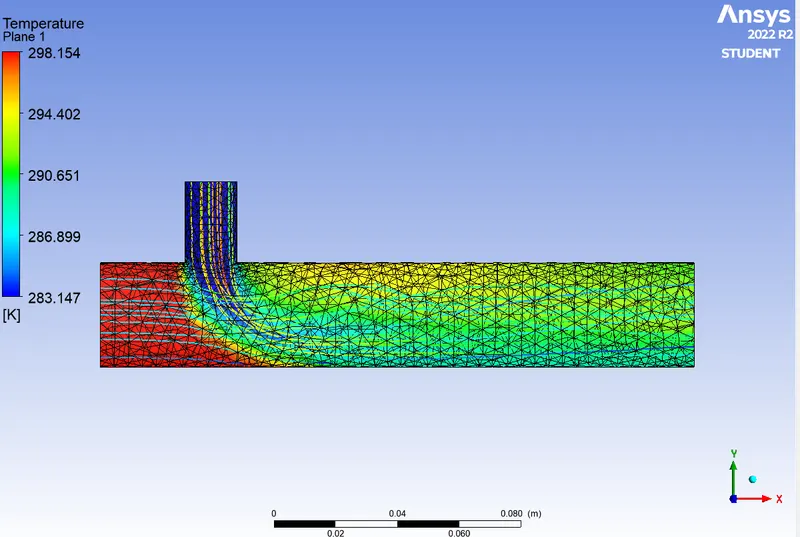
- Momentum ratio =4 , Solver - k-epsilon model
- Temperature contour
- Velocity contour
- K-omega
- Temperature contour
- Momentum ratio = 2 , k-epsilon , Outlet Temperature = 20.31 C , No. of iterations = 150
- Momentum ratio = 2 , k-omega , Outlet Temperature = 20.12 C , No. of iterations = 150
- Momentum ratio = 2 , k-epsilon , Outlet Temperature = 27.56 C , No. of iterations = 300
- Momentum ratio = 2 , k-omega , Outlet Temperature = 27.62 C , No. of iterations = 300
- Momentum ratio = 4 , k-epsilon , Outlet Temperature = 25.53 C , No. of iterations = 150
- Momentum ratio = 4 , k-omega , Outlet Temperature = 25.52 C , No. of iterations = 150
- Momentum ratio = 4 , k-epsilon , Outlet Temperature = 25.53 C , No .of iterations = 300
- Momentum ratio = 4 , k-omega , Outlet Temperature =25.52 C , No of iterations = 300
- Momentum ratio Tmixture value
- 2 28
- 4 25.88
- Cell count
- Conclusion:
- AVERAGE OUTLET TEMPERATURE: Comparing the two models at the analytical solution gave nearly identical results.
- Number of iterations to convergence: The number of iterations to convergence is lower for the feasible K-Epsilon model than for the K-Omega-SST model.
- STANDARD DEVIATION:The standard deviation of the k-ε model is smaller than that of the k-ω model, indicating a higher mixing efficiency for the k-ε model.
- So based on the above observations the K-epsilon turbulence model is predicting the results accurately in less no. of iterations. So we can use realisable k-epsilon model for case 2.
- Case 2
- Long mixing tee with a hot inlet velocity of 3m/s.
- Momentum ratio of 2, 4.
- Long mixing tee with a hot inlet velocity of 3m/s.
- Momentum ratio of 2.
-
GEOMETRY SETUP:
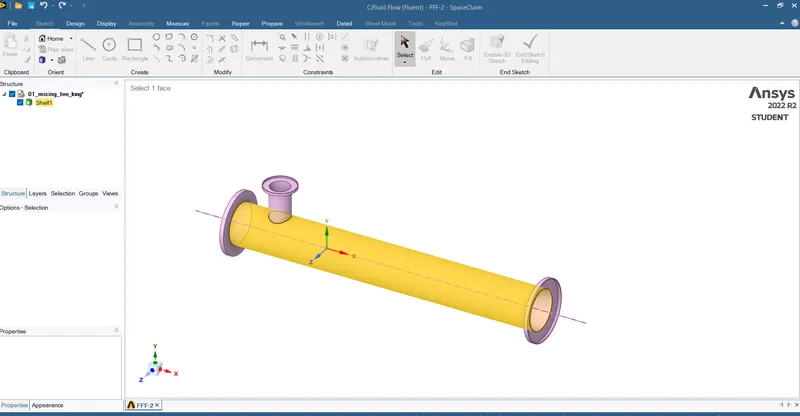
- Volume Extraction
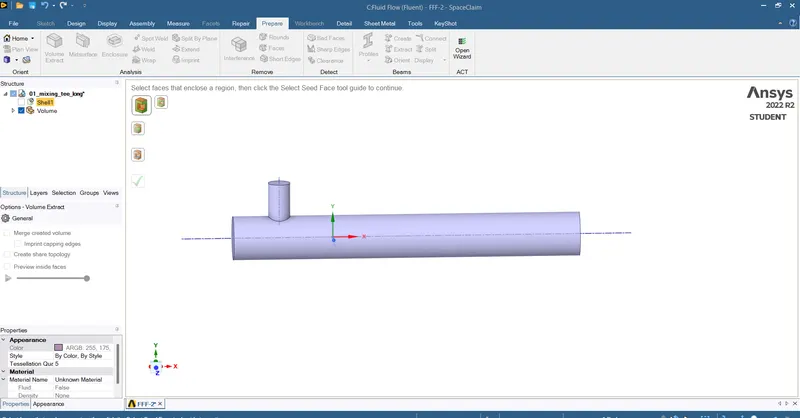
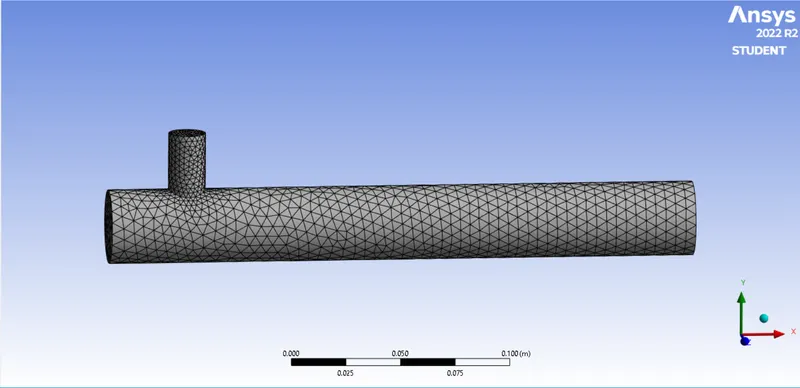
- Mesh Generation
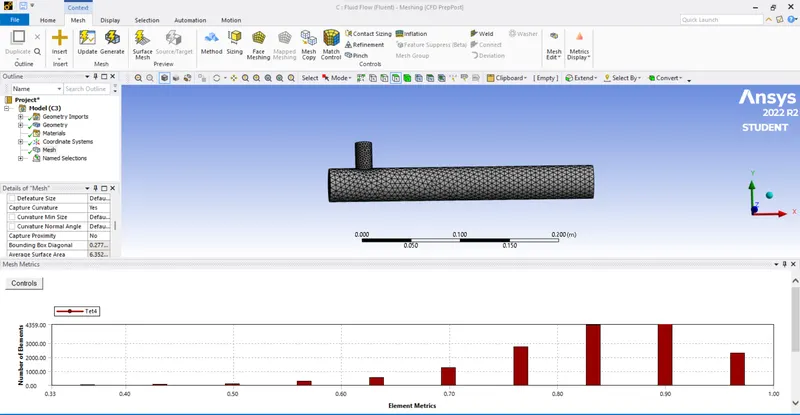
- Steps
- Calculation models are uploaded to Ansys space claim as step files.
- For this project, we are interested in performing liquid flow analysis through geometry, so we used the volume extraction option to extract the liquid volume from the geometry. The physics solid model is then constrained from the fluid model and a mesh is created in the region of interest.
- Boundary names Inlet_x, Inlet_y, Outlet, and Wall are defined with named options.
- After generating the mesh, use the statistics option to find out the number of nodes and elements. Then check the mesh quality by selecting the Mesh Metrics option in the Quality section.
- SETUP AND SOLUTION:
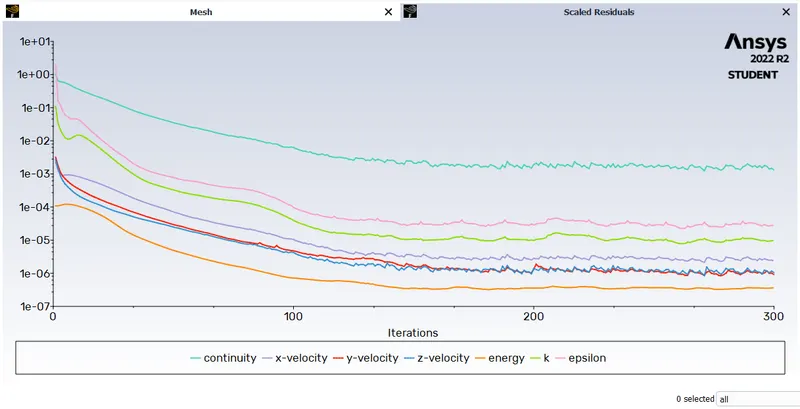
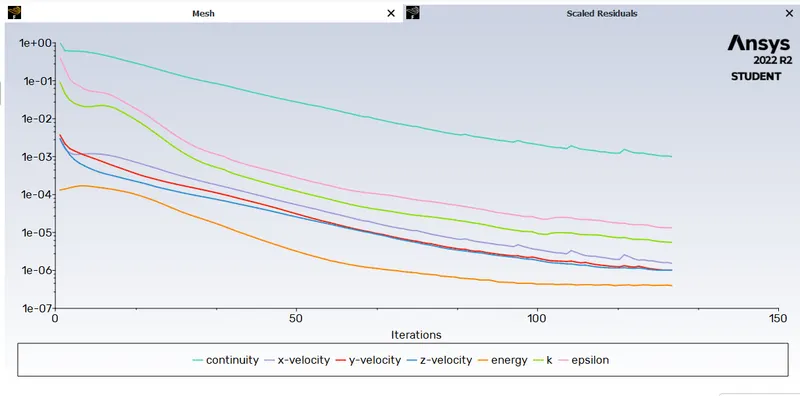
- Residuals
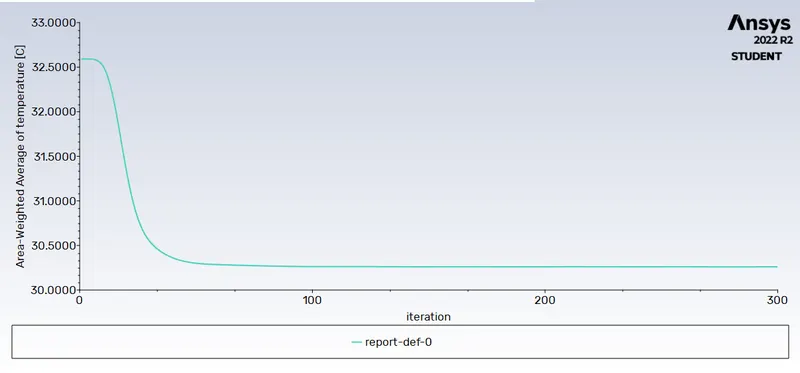
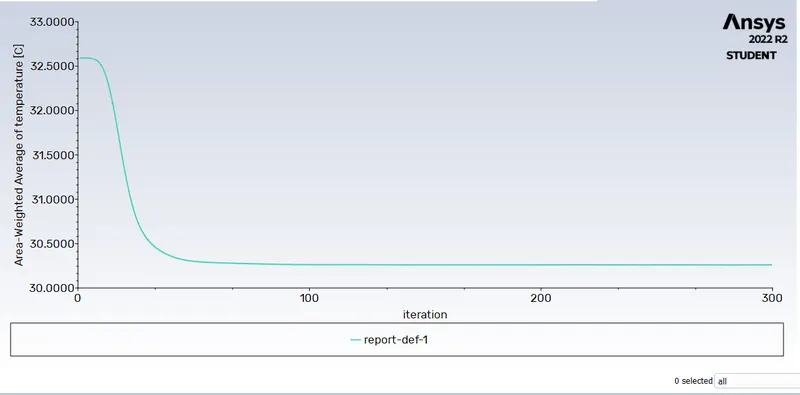
- Contour plot
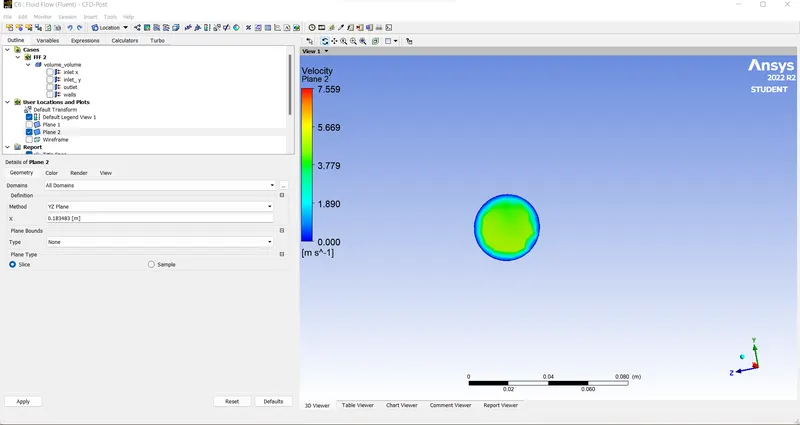
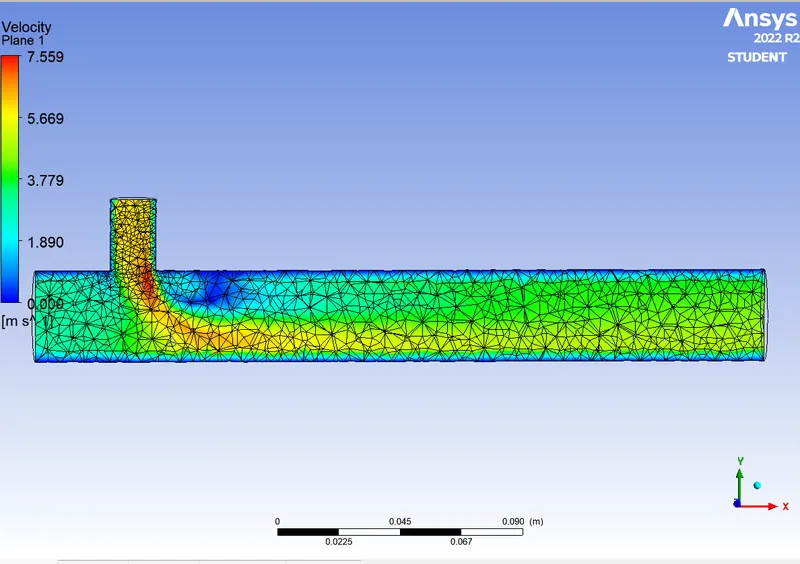
- Outlet velocity
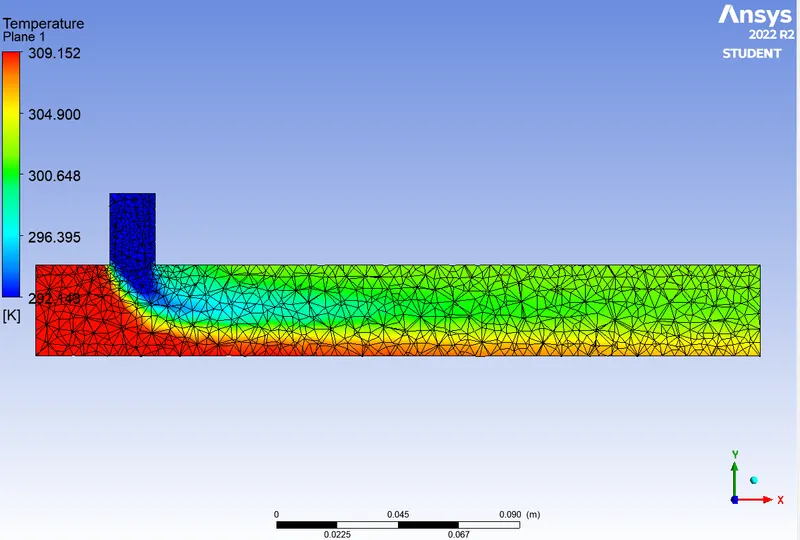
- Temperature contour
- Velocity contour
- Long mixing tee with a hot inlet velocity of 3m/s.
- Momentum ratio of 4.
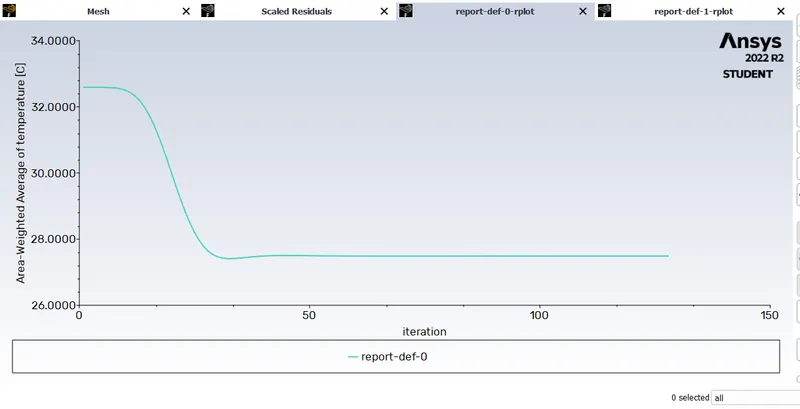
- Residuals
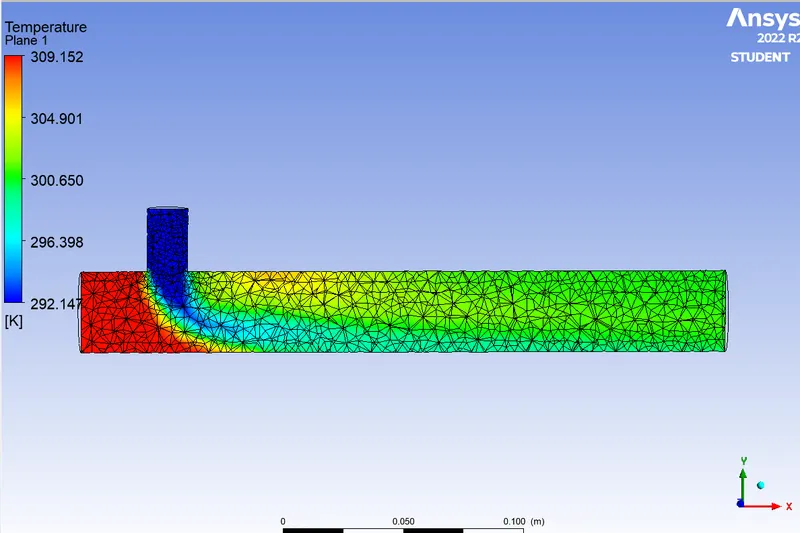
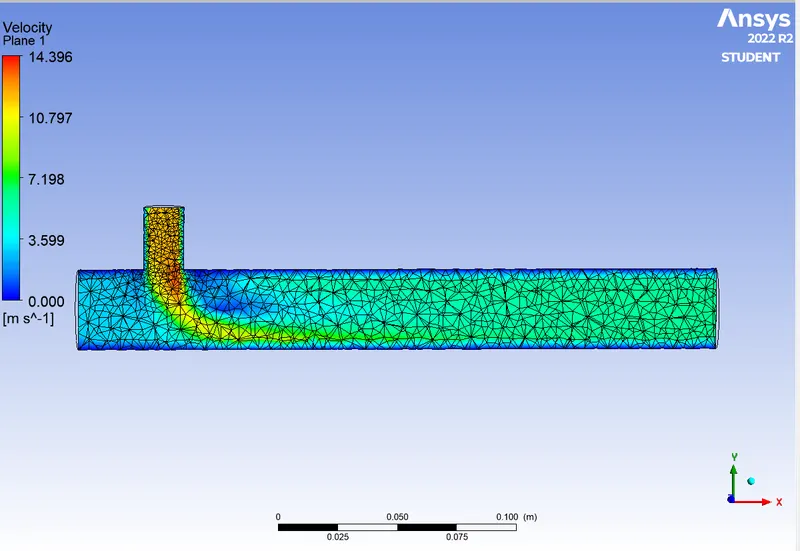
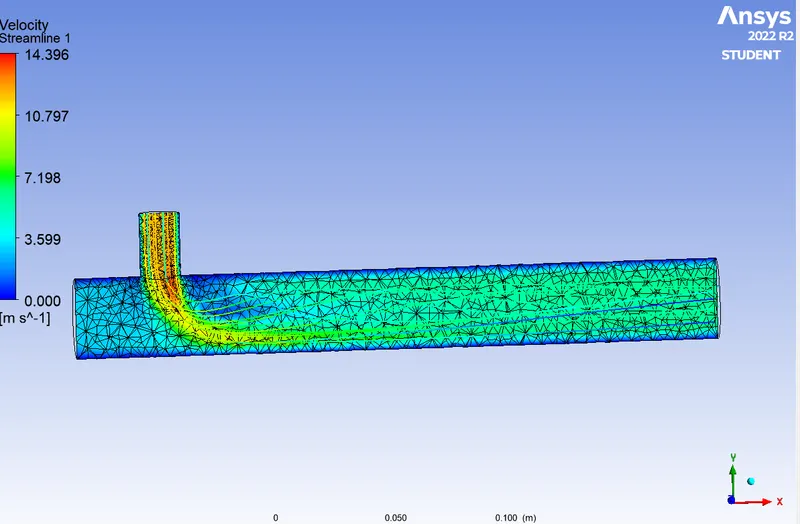
- Contours
- Temperature contour
- Velocity contour
- Streamline plot
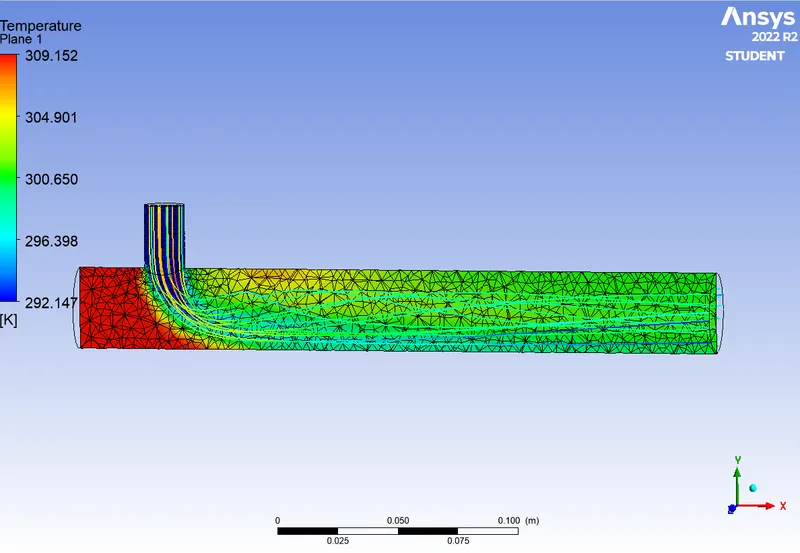
- Momentum ratio:
As the momentum ratio increases, the velocity of the cold inlet fluid increases and the higher relative velocity between the fluids creates more turbulence, thus lowering the temperature of the outlet fluid. - Conclusion
- Longer tees take longer to converge than shorter tees.
- The higher the pulse ratio, the higher the mixing efficiency of the tee.
- Elongating the tube is not for efficient mixing. Therefore, it is efficient to use short tubes.
-
GRID INDEPENDENCY TEST:
Short Tee model is selected for grid dependence test.
MESH GENERATION:
- 5mm
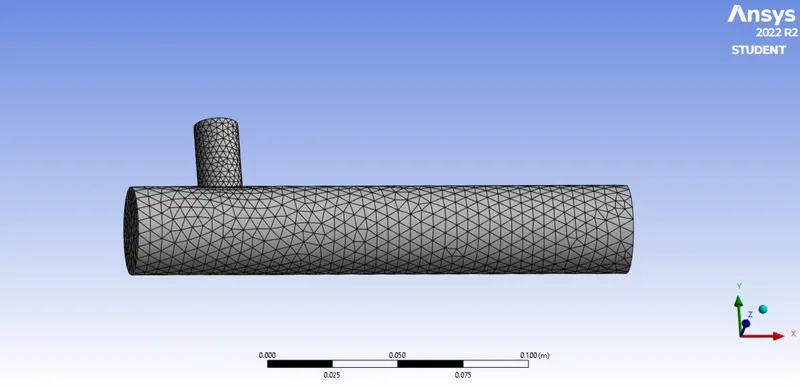
- 2mm
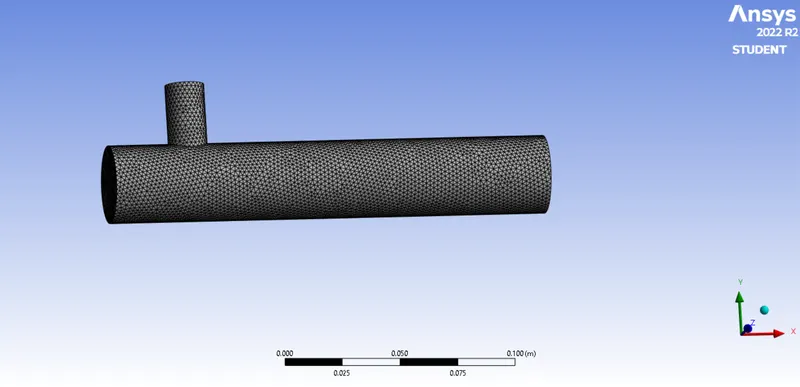
- 4mm
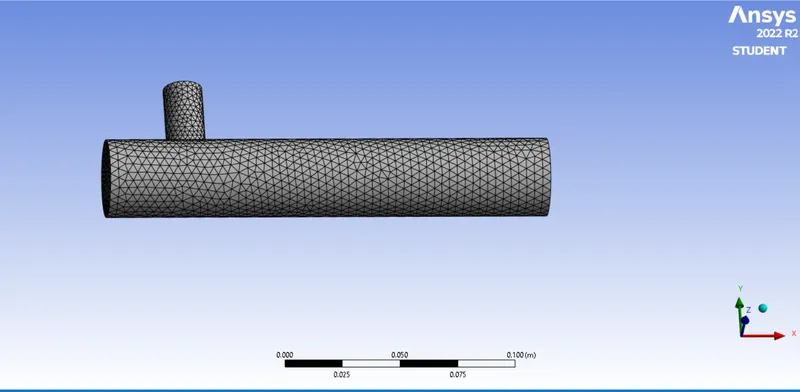
SUMMARY:
Mesh Size No. of nodes No. of elements Ave. Outlet temperature No. of iterations
5mm 3144 14248 25.55 C 500
2mm 21392 106253 25.56 C 100
4mm 4794 22256 25.53 C 150
- Conclusion - As the mesh size decreases, the average outlet temperature approaches the analysis result.