Week 1- Mixing Tee
AIM:- To set up steady-state simulations to compare the mixing effectiveness when hot inlet temperature is 360C & the Cold inlet is at 190C.
OBJECTIVE:-
- Use the k-epsilon and k-omega SST model for the first case and based on your judgment use the more suitable model for further cases. Giving the reason for choosing a suitable model.
- Case 1
- Short mixing tee with a hot inlet velocity of 3m/s.
- Momentum ratio of 2, 4.
- Case 2
- Long mixing tee with a hot inlet velocity of 3m/s.
- Momentum ratio of 2, 4.
Where,
Momentum ratio = velocity at cold inlet / velocity at hot inlet
- compare the following values from the 2 cases.
- Cell count
- Average outlet temperature
- Number of iterations for convergence
INTRODUCTION:-
Mixing Tee:- Mixing Tee is the Device use to mix the Two Fluids in one stream, we are using mixing tee for Mixing Hot Air and Cold Air to get optimum Air Temperature at Outlet. Two inlets has Different Velocities. We will use Two cases for analyse effect on Results.
PROCEDURE:-
STEP 1 :- Geometry:-
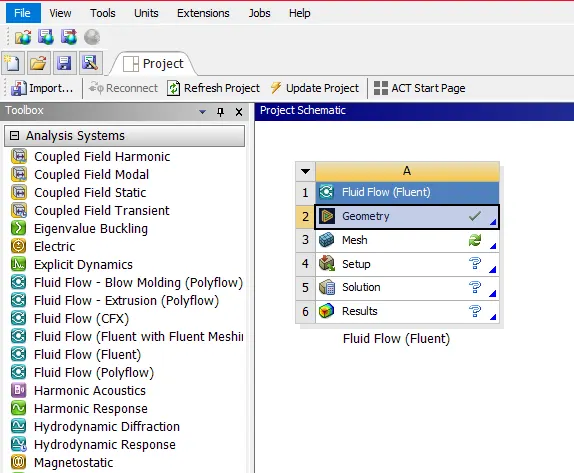
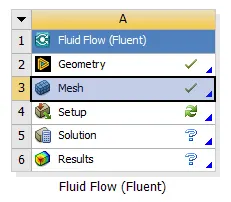
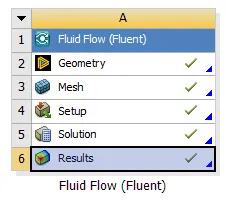
- Open Ansys Workbench and Select 'Fluid Flow (Fluent)' and Select geometry and open Geometry file from Location and generate in 'spaceclaim'
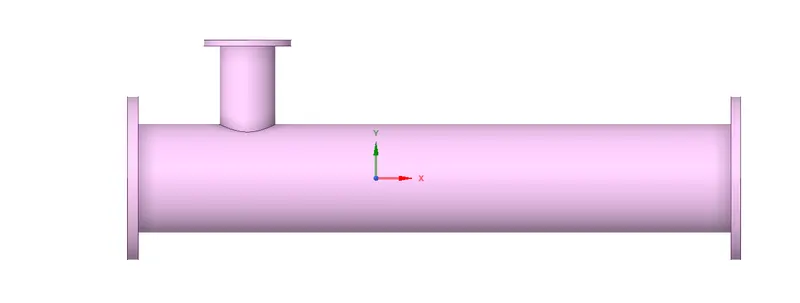
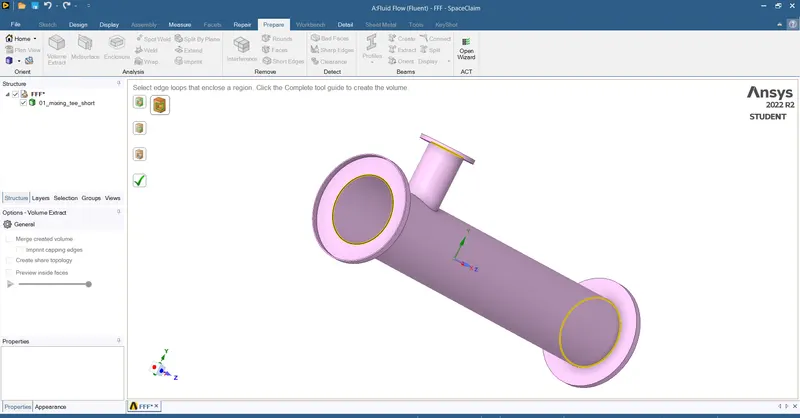
- we do not need the solid geometry so we can extract by using volume extraction then select edges where fluid is flowing.
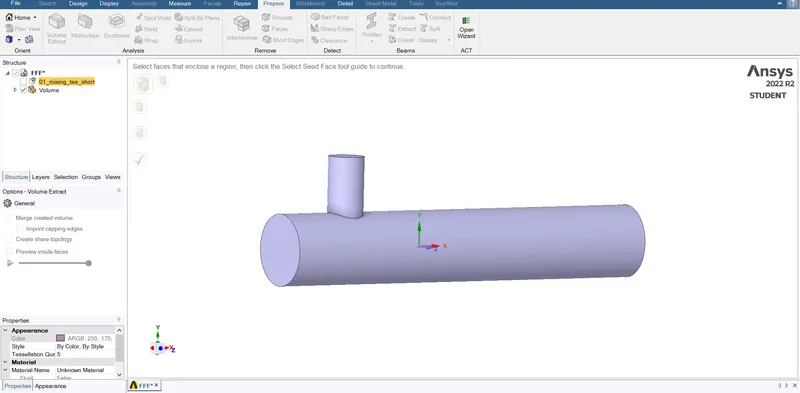
- Then hide solid componenet by Suppressing it and close the model.
STEP 2:- Meshing:-
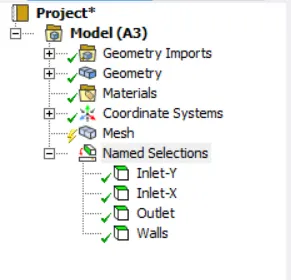
Now we can Mesh Geometry before meshing we can named selection by 'ctrl+F'
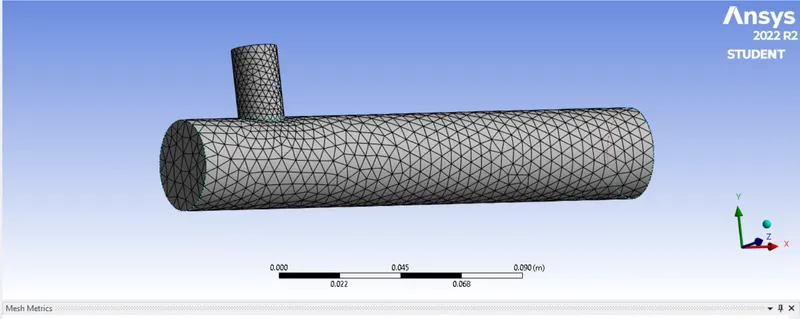
Then Generate Mesh
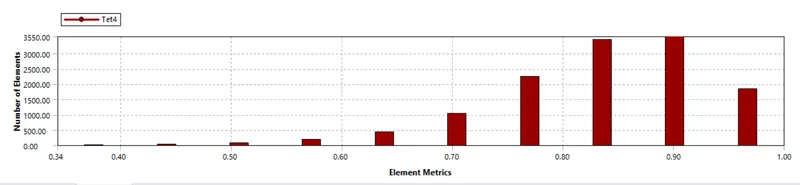
Element Mesh Metrics:
here we can see element quality above 34 % so we can use this Mesh for further process.
STEP 3:- Setup:-
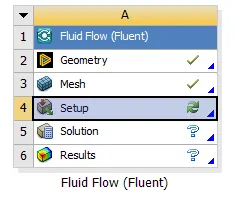
after getting in to setup we got the following Ansys Fluent interface.
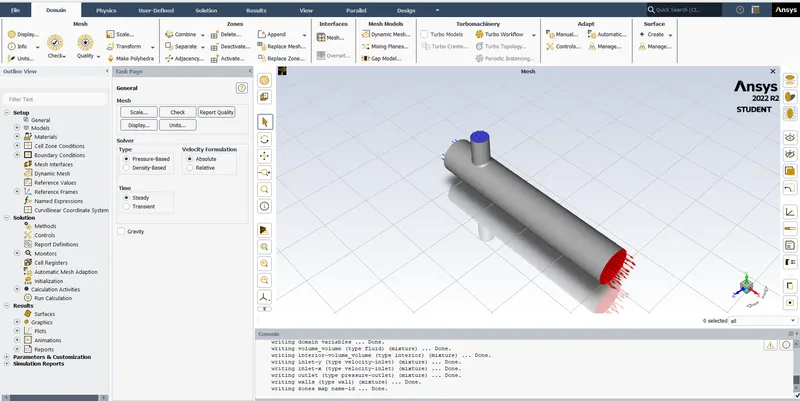
CASE 1:-
- Short mixing tee with a hot inlet velocity of 3m/s.
- Momentum ratio of 2
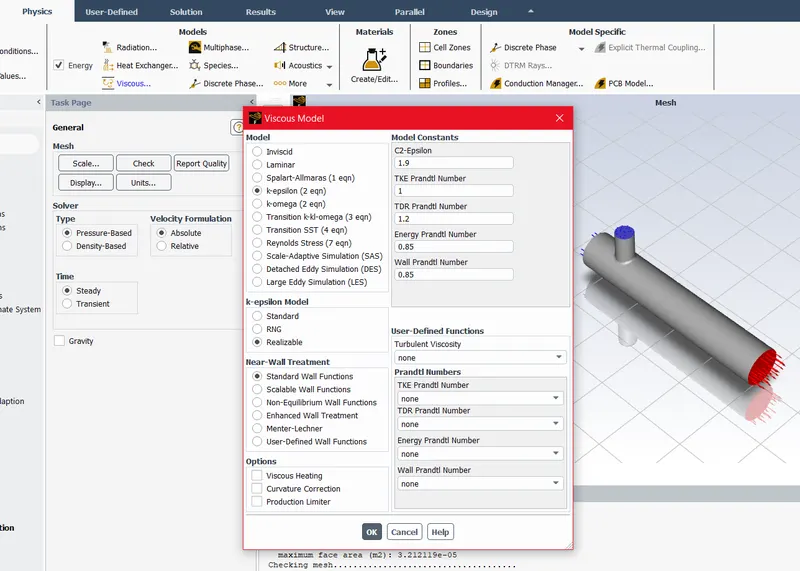
Then we can use K epsilon Realizable Viscous Model :-
STEP 4 :-Solution:-
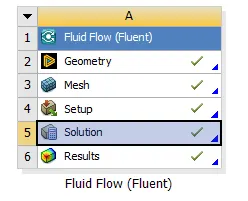
After Setup we have to open Solution for apply correct boundary conditions. in definitions we can got boundary conditions for Inlet-X Velocity 3 m/s and Thermal `36^0 C` and Inlet-Y Velocity 6 m/s and Thermal `19^0 C`. then we have to initialize and calculate for No. of Iterations, we can get the no. of plots shown in below Residual plot, area weighted average and standard deviation of Temperature.
- Residual Plot for k epsilon model momentum Ratio is 2:-
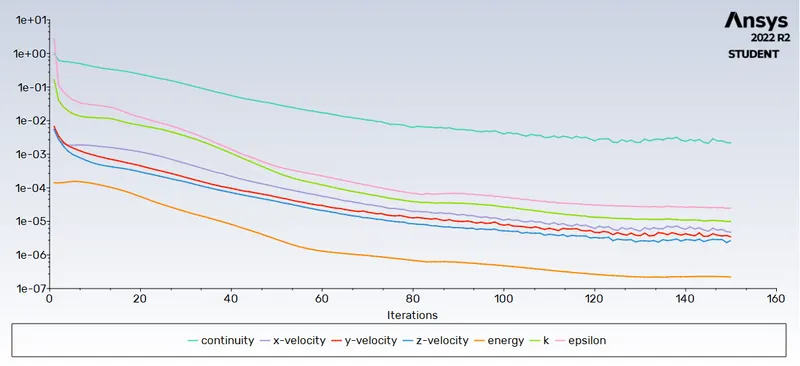
Fig.1 Residual Plot for k epsilon model momentum Ratio is 2
- Area weighted average for temperature for k epsilon model momentum Ratio is 2:-
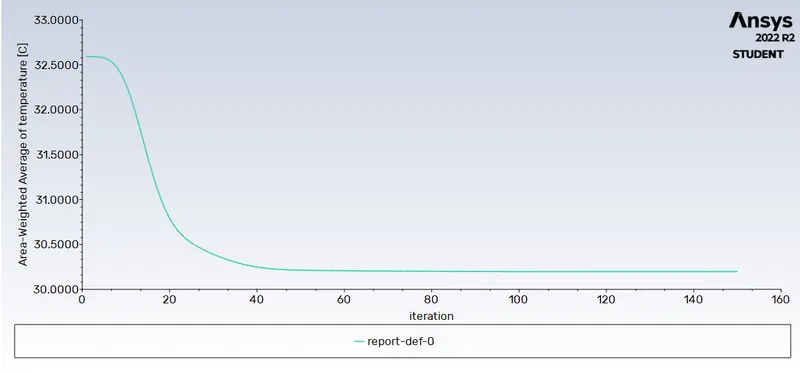
Fig.2 area weighted average for temperature for k epsilon model momentum Ratio is 2
- Standard deviation of Temperature for k epsilon model momentum Ratio is 2.
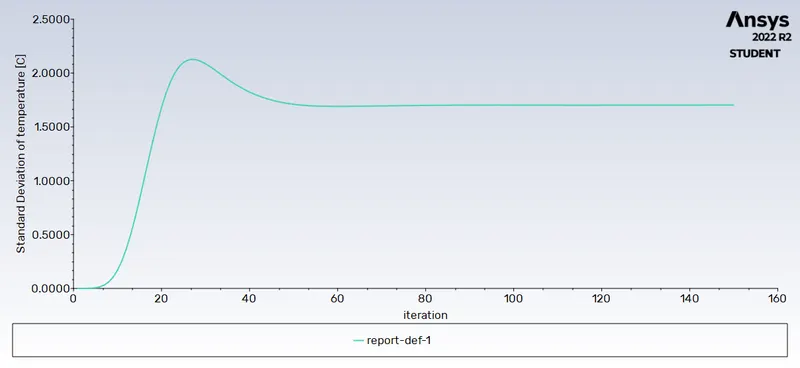
Fig.3 standard deviation of Temperature for k epsilon model momentum Ratio is 2.
STEP 5 :-Result:-
after getting Solution get Converged we can open Results, here we can plot Temeprature and Velocity Plot along XY Plane and also plot Line plot along and across the plane. we can check result below.
- Temperature Contour for k epsilon model momentum Ratio is 2:-
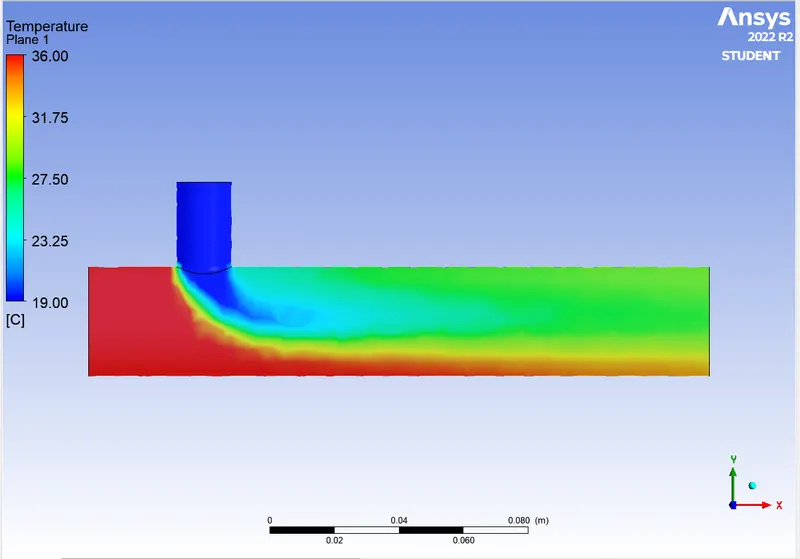
Fig. 4 Temperature Contour for k epsilon model momentum Ratio is 2
- Velocity Contour for k epsilon model momentum Ratio is 2:-
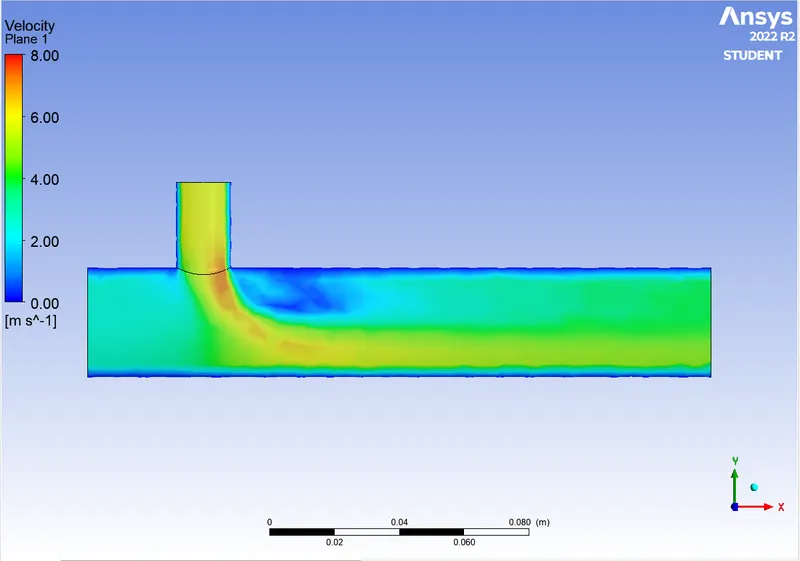
Fig.5 Velocity Contour for k epsilon model momentum Ratio is 2
- Temperature Contour for Across the pipe k epsilon model momentum Ratio is 2:-
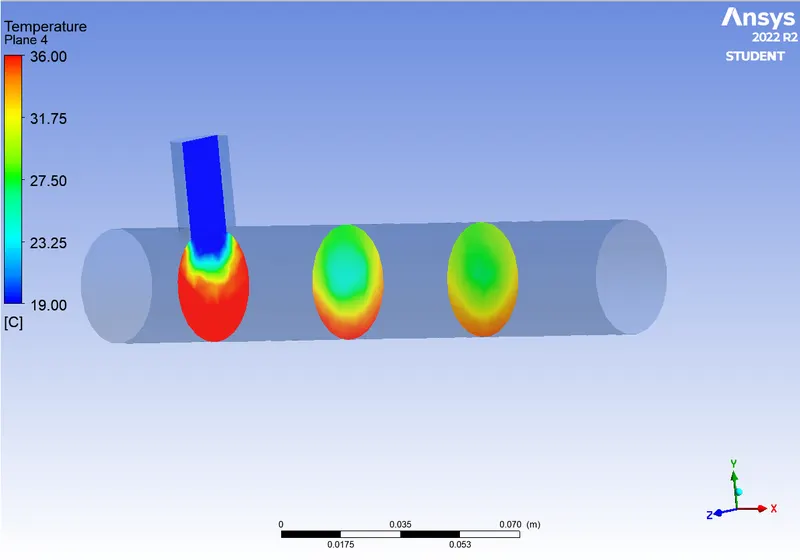
Fig.6 Temperature Contour for Across the pipe k epsilon model momentum Ratio is 2
- Velocity Contour for Across the pipe k epsilon model momentum Ratio is 2:-
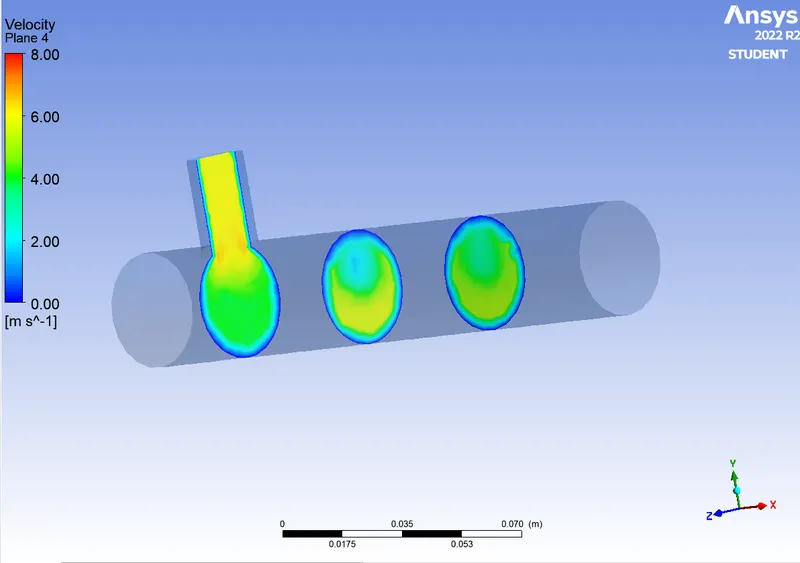
Fig.7 Velocity Contour for Across the pipe k epsilon model momentum Ratio is 2
- Temperature Contour line for along the pipe k epsilon model momentum Ratio is 2:-
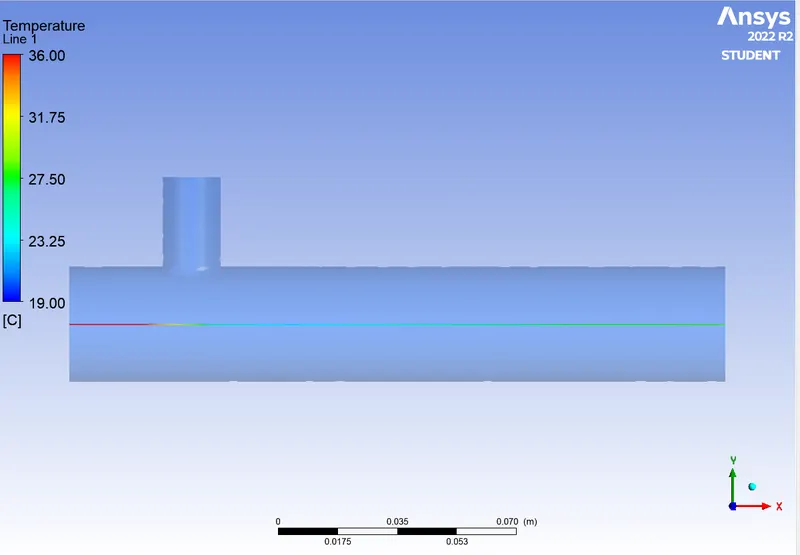
Fig. 8 Temperature Contour line for along the pipe k epsilon model momentum Ratio is 2
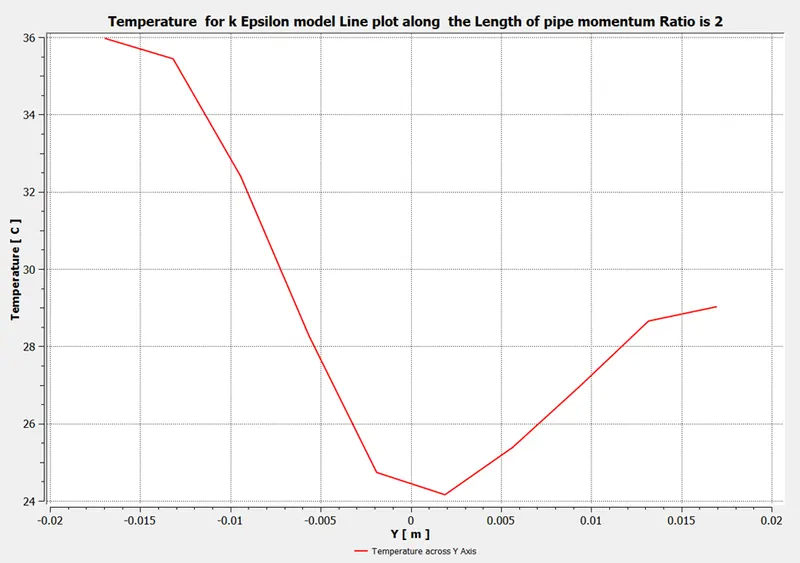
Fig. 9 Temperature Profile line for along the pipe k epsilon model momentum Ratio is 2
- Velocity Contour line for along the pipe k epsilon model momentum Ratio is 2:-
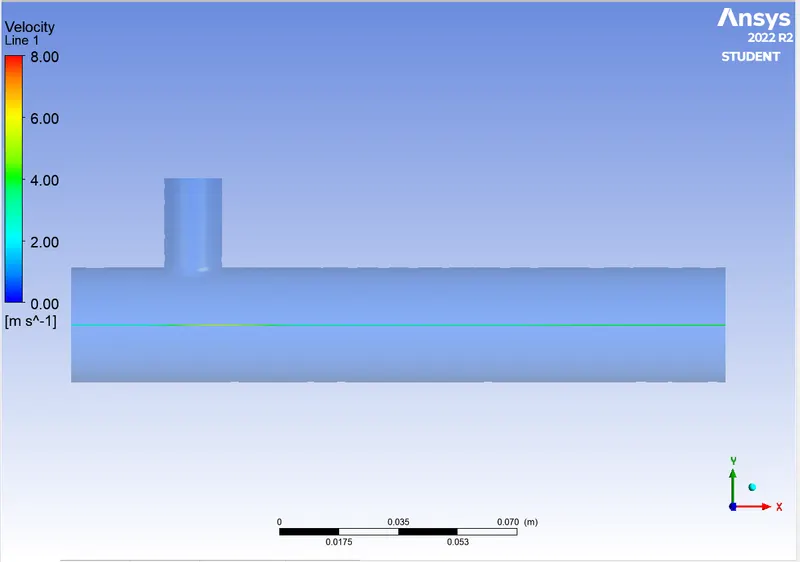
Fig.10 Velocity Contour line for along the pipe k epsilon model momentum Ratio is 2
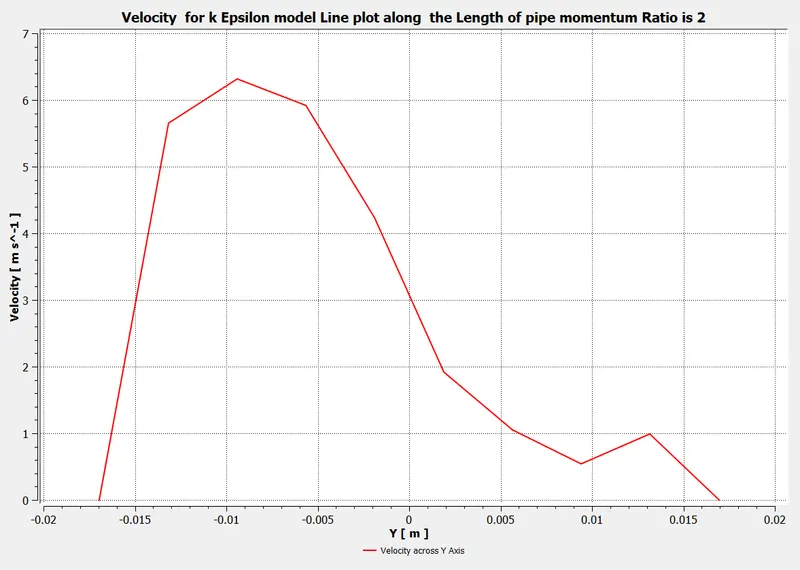
Fig.11 Velocity Profile line for along the pipe k epsilon model momentum Ratio is 2
- Temperature Contour line for across the pipe k epsilon model momentum Ratio is 2
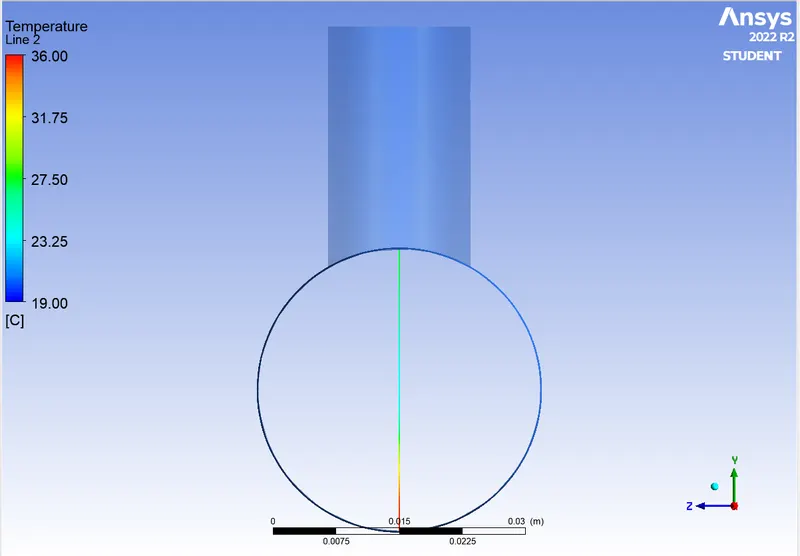
Fig.12 Temperature Contour line for across the pipe k epsilon model momentum Ratio is 2
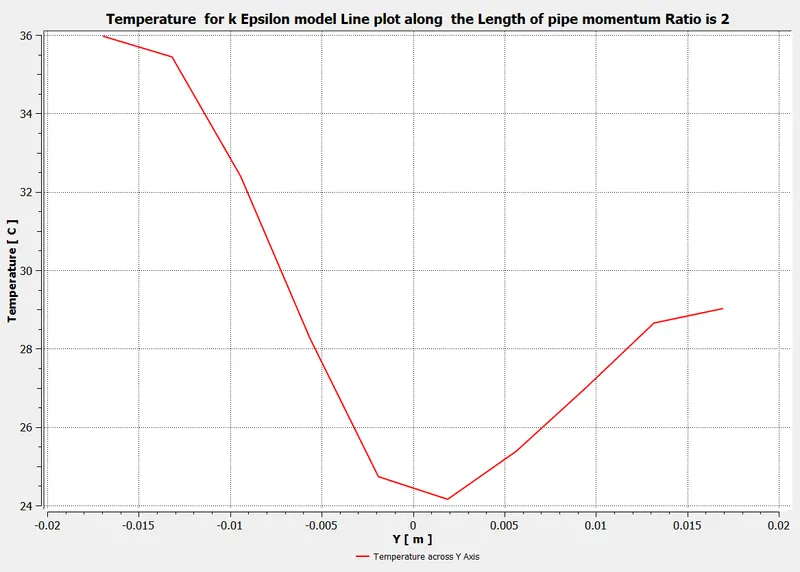
Fig.13 Temperature Profile line for across the pipe k epsilon model momentum Ratio is 2
- Velocity Contour line for across the pipe k epsilon model momentum Ratio is 2:-
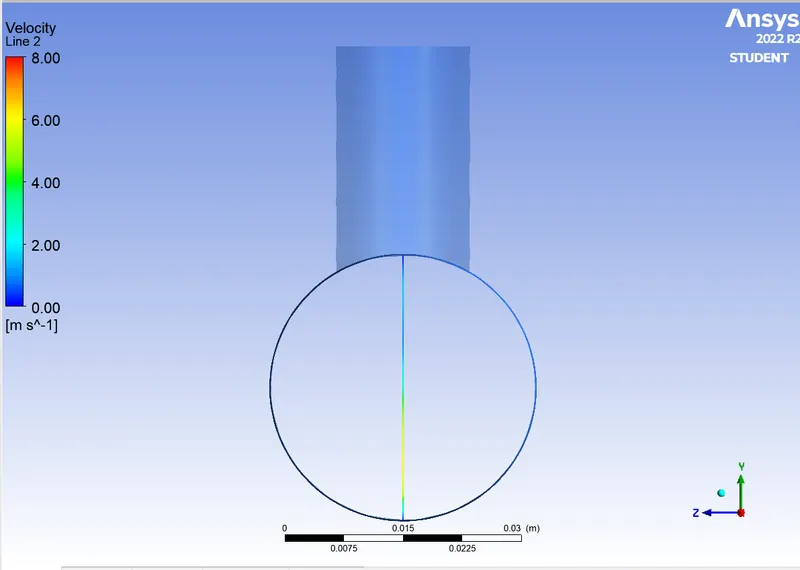
Fig.14 Velocity Contour line for across the pipe k epsilon model momentum Ratio is 2
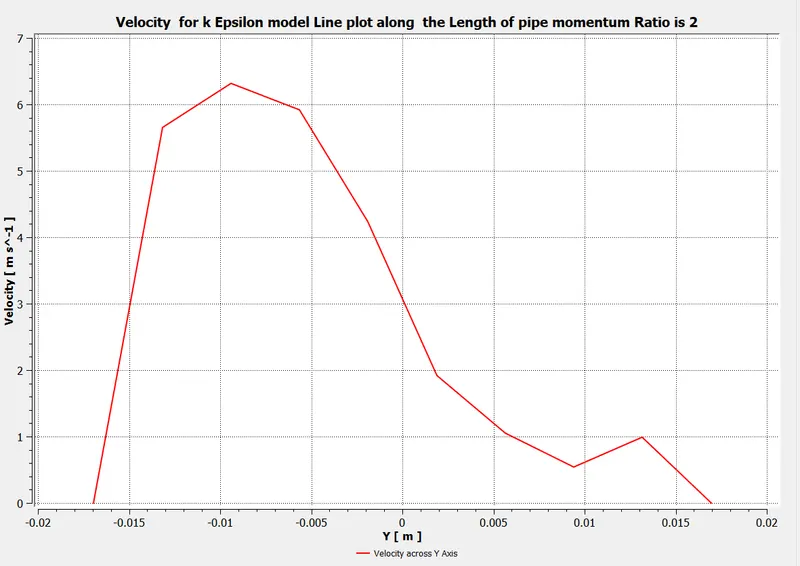
Fig.15 Velocity Profile line for across the pipe k epsilon model momentum Ratio is 2
NOW WE CAN USE K- OMEGA TURBULANCE MODEL:-
- Short mixing tee with a hot inlet velocity of 3m/s.
- Momentum ratio of 2
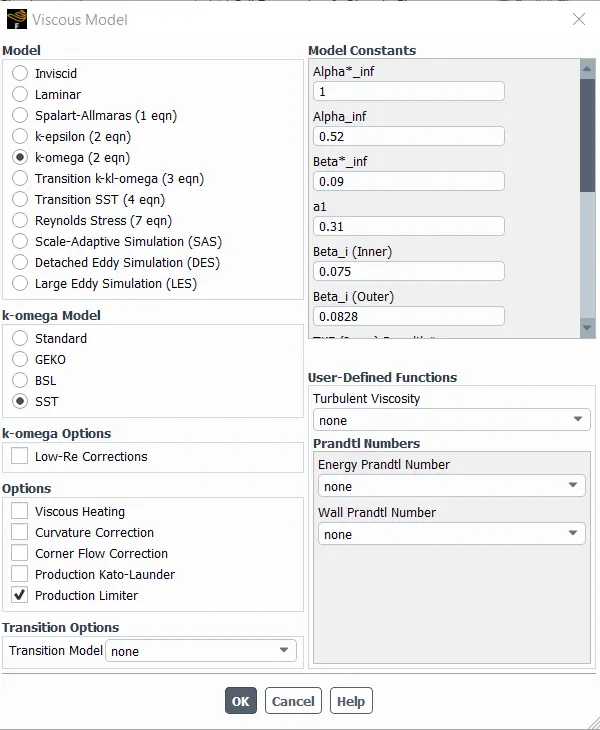
- Residual Plot for k Omega SST model momentum Ratio is 2:-
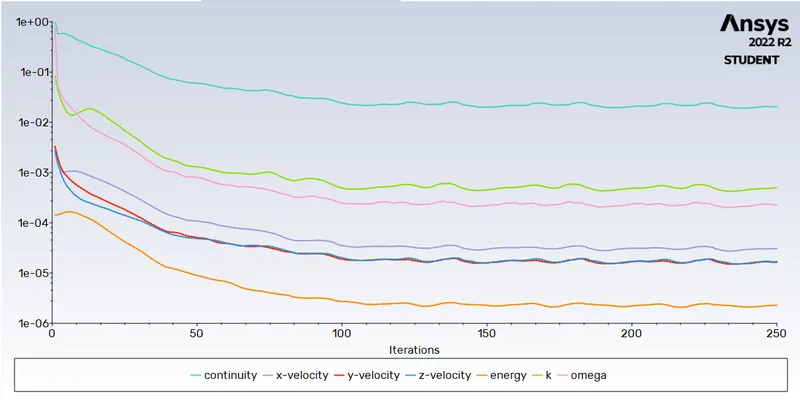
Fig. 16 Residual Plot for k Omega SST model momentum Ratio is 2
- Area weighted average for temperature for k Omega SST model momentum Ratio is 2:-
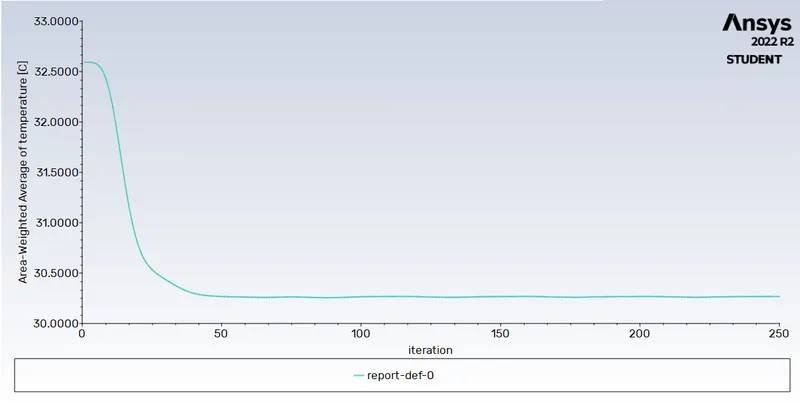
Fig 17 Area weighted average for temperature for k Omega SST model momentum Ratio is 2
- Standard deviation of Temperature for k Omega SST model momentum Ratio is 2:-
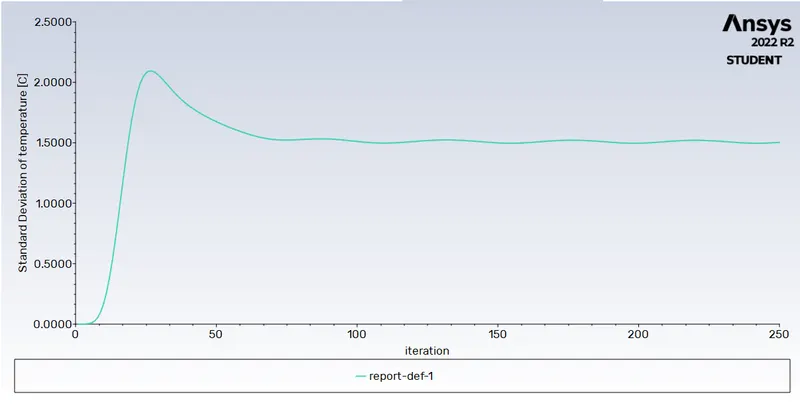
Fig. 18 Standard deviation of Temperature for k Omega SST model momentum Ratio is 2
- Temperature Contour for k Omega SST model momentum Ratio is 2:-
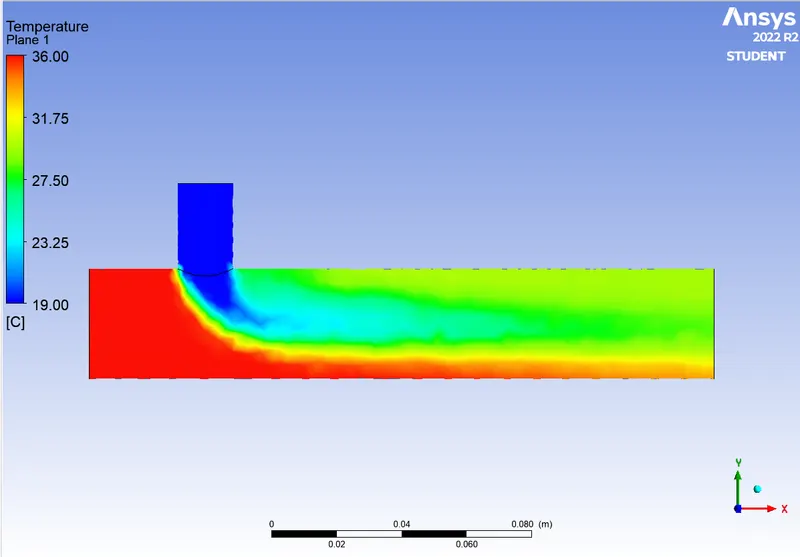
Fig.19 Temperature Contour for k Omega SST model momentum Ratio is 2
- Velocity Contour for k Omega SST model momentum Ratio is 2:-
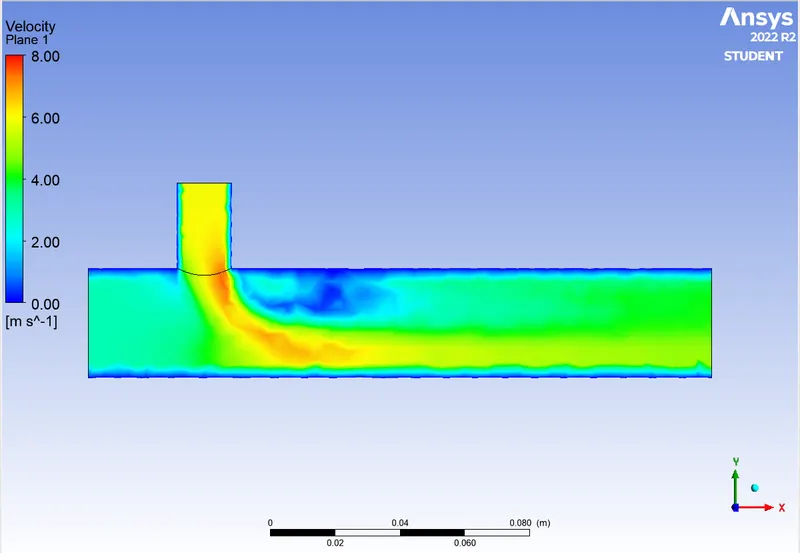
Fig.20 Velocity Contour for k Omega SST model momentum Ratio is 2
- Temperature Contour for k Omega SST model Across the Length momentum Ratio is 2:-
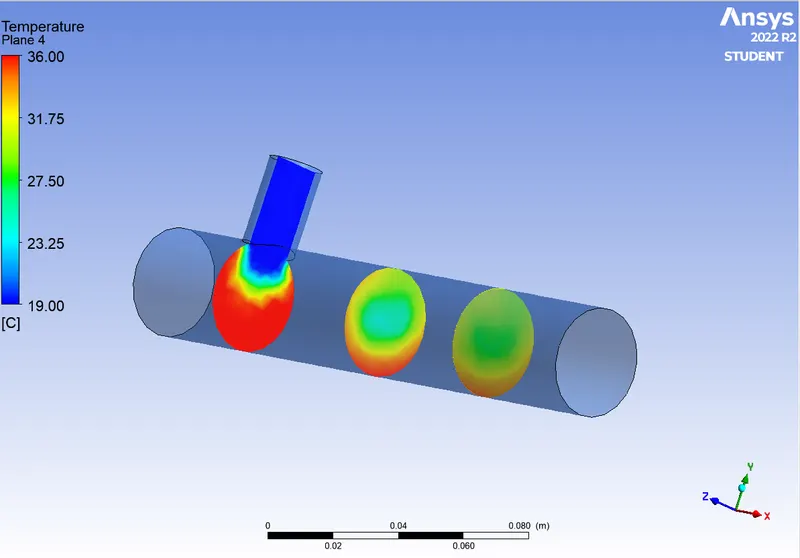
Fig.21 Temperature Contour for k Omega SST model Across the Length momentum Ratio is 2
- Velocity Contour for k Omega SST model Across the Length momentum Ratio is 2:-
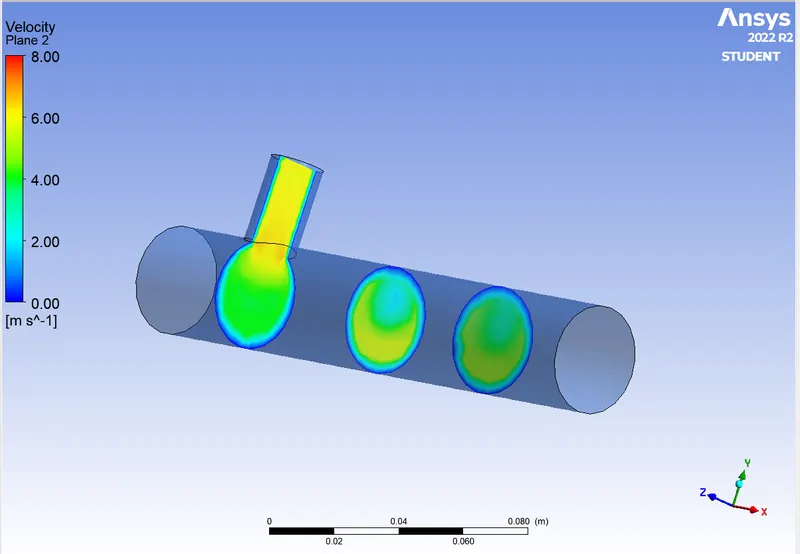
Fig. 22 Velocity Contour for k Omega SST model Across the Length momentum Ratio is 2
- Temperature Contour for k Omega SST model Line plot along the Length of pipe momentum Ratio is 2:-
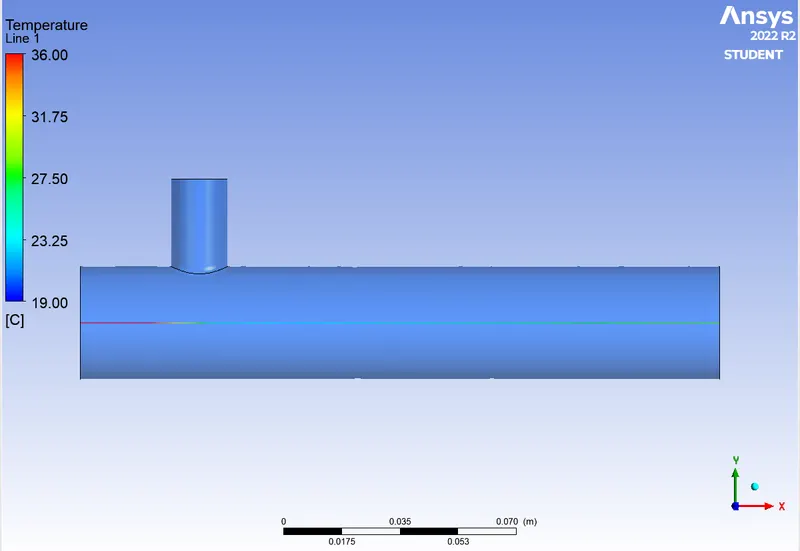
Fig. 23 Temperature Contour for k Omega SST model Line plot along the Length of pipe momentum Ratio is 2
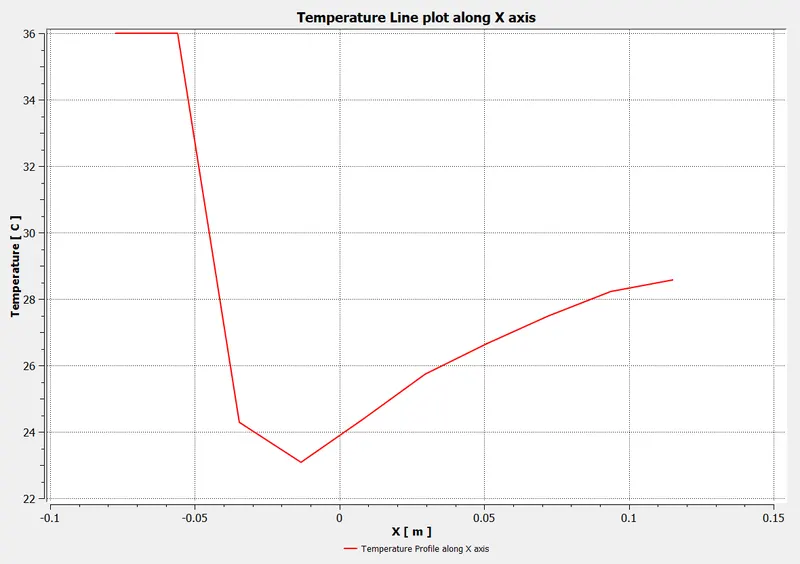
Fig. 24 Temperature for k Omega SST model Line plot along the Length of pipe momentum Ratio is 2
- Velocity Contour for k Omega SST model Line plot along the Length of pipe momentum Ratio is 2:-
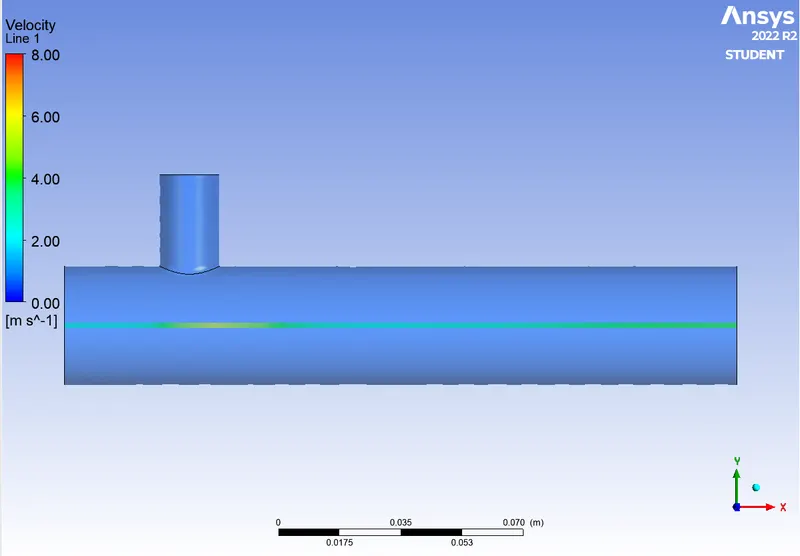
Fig. 25 Velocity Contour for k Omega SST model Line plot along the Length of pipe momentum Ratio is 2
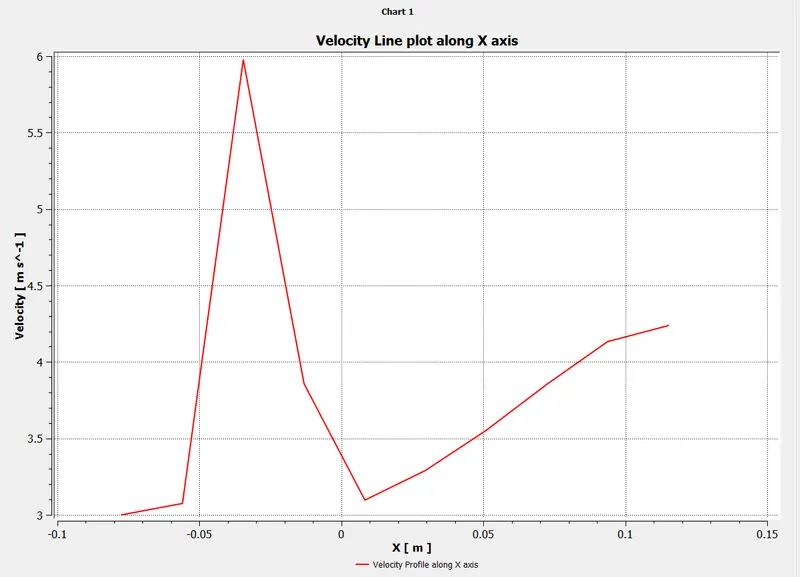
Fig. 26 Velocity Profile for k Omega SST model Line plot along the Length of pipe momentum Ratio is 2
- Temperature Contour for k Omega SST model Line plot across the Length of pipe momentum Ratio is 2:-
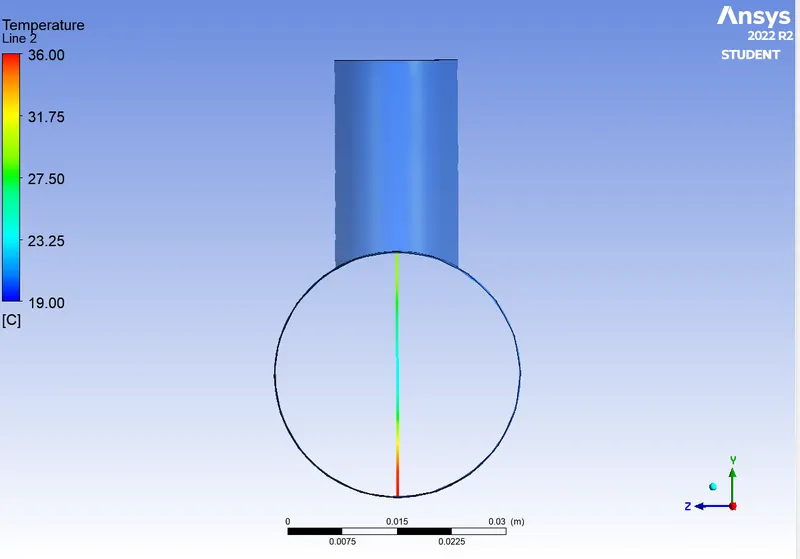
Fig. 27 Temperature Contour for k Omega SST model Line plot across the Length of pipe momentum Ratio is 2
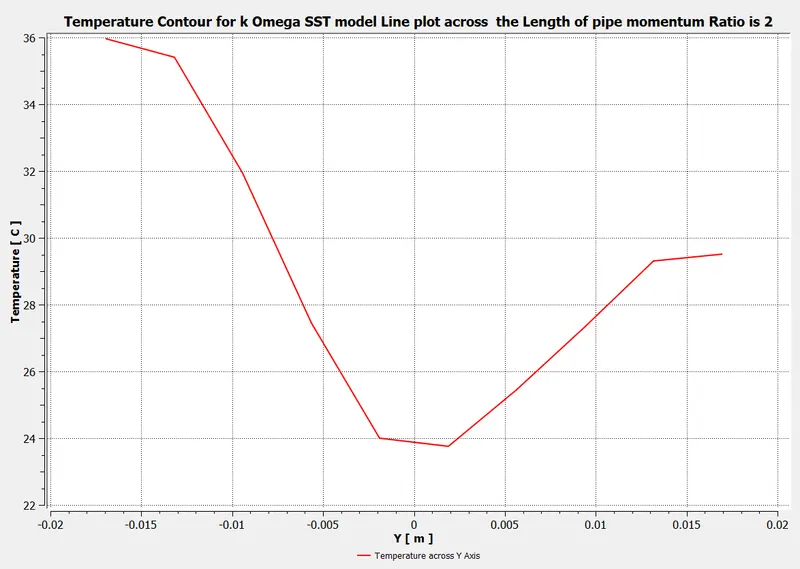
Fig. 28 Temperature Profile for k Omega SST model Line plot across the Length of pipe momentum Ratio is 2
- Velocity Contour for k Omega SST model Line plot across the Length of pipe momentum Ratio is 2:-
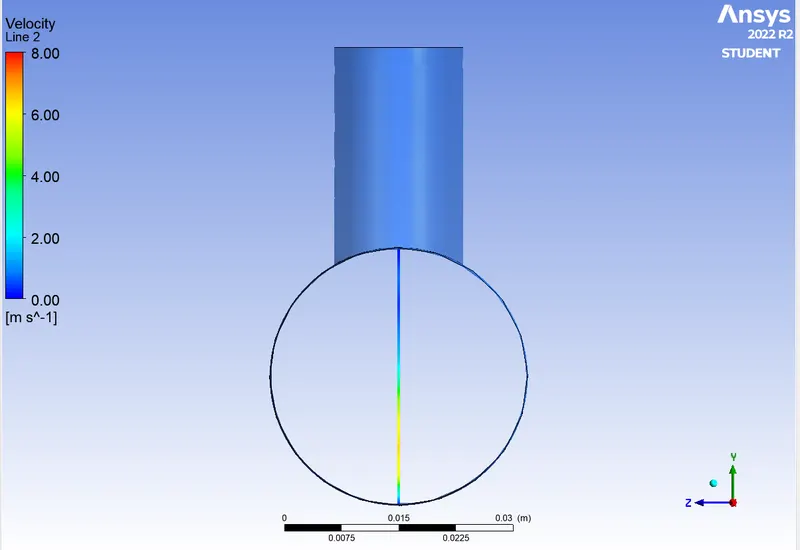
Fig. 29 Velocity Contour for k Omega SST model Line plot across the Length of pipe momentum Ratio is 2
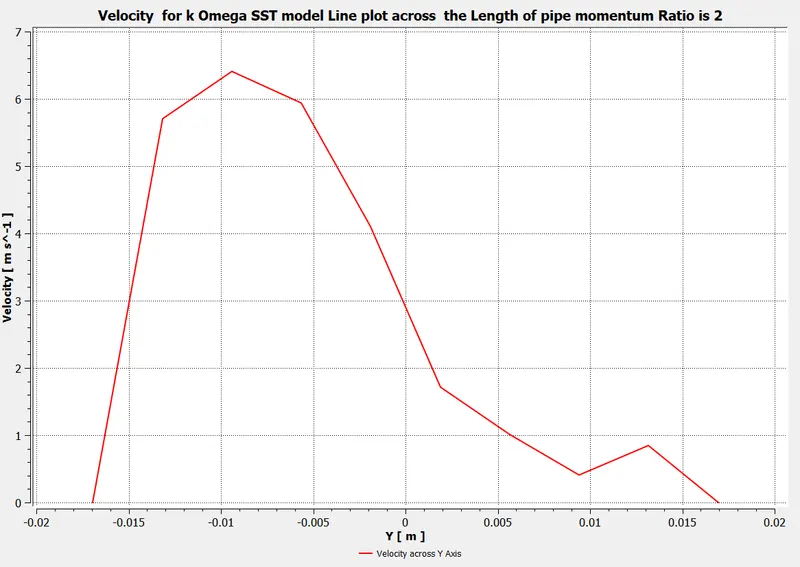
Fig.30 Velocity Profile for k Omega SST model Line plot across the Length of pipe momentum Ratio is 2
Now We can Take Momentum Ratio 4 for Short Tee K-epsilon and K-Omega SST Turbulance Model:-
- Therefore Cold inlet Velocity 3 m/s and Hot inlet Velocity 12 m/s.
For K-epsilon Model:-
- Residual Plot for k-Epsilon model momentum Ratio is 4:-
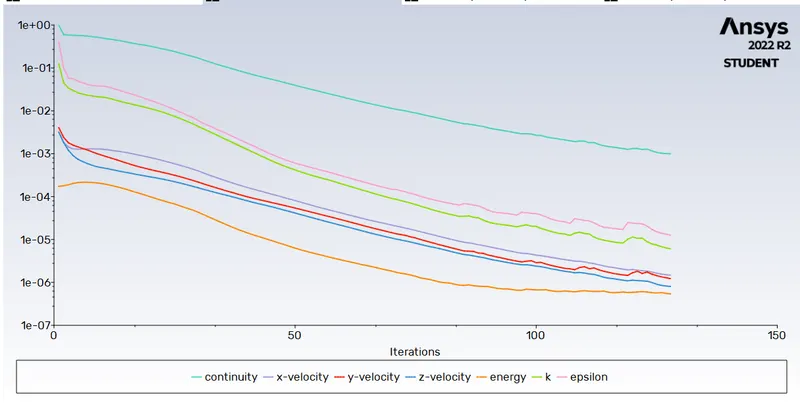
Fig.31 Residual Plot for k-Epsilon model momentum Ratio is 4
- Area Weighted Average Temperature Plot for k-Epsilon model momentum Ratio is 4:-
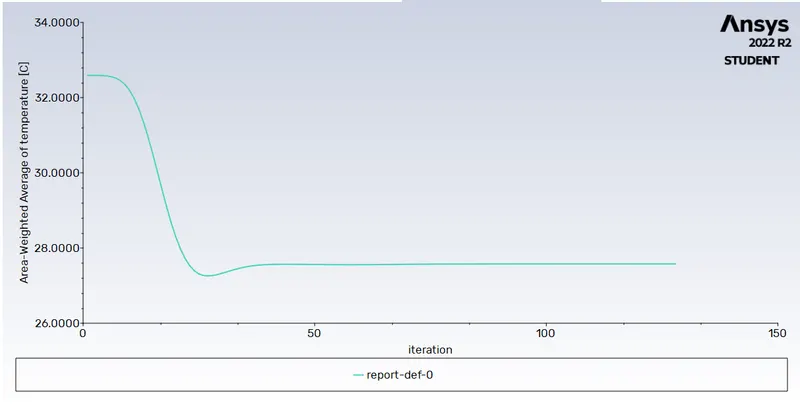
Fig.32 Area Weighted Average Temperature Plot for k-Epsilon model momentum Ratio is 4
- Standard Deviation of Temperature Plot for k-Epsilon model momentum Ratio is 4:-
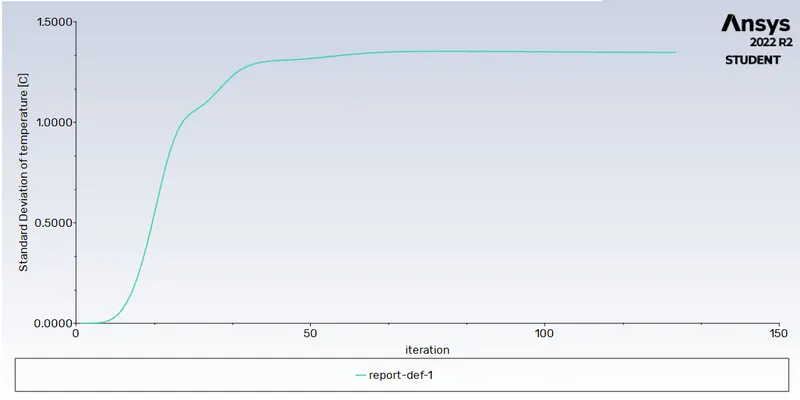
Fig.33 Standard Deviation of Temperature Plot for k-Epsilon model momentum Ratio is 4
- Temperature Contour for k Epsilon model momentum Ratio is 4:-
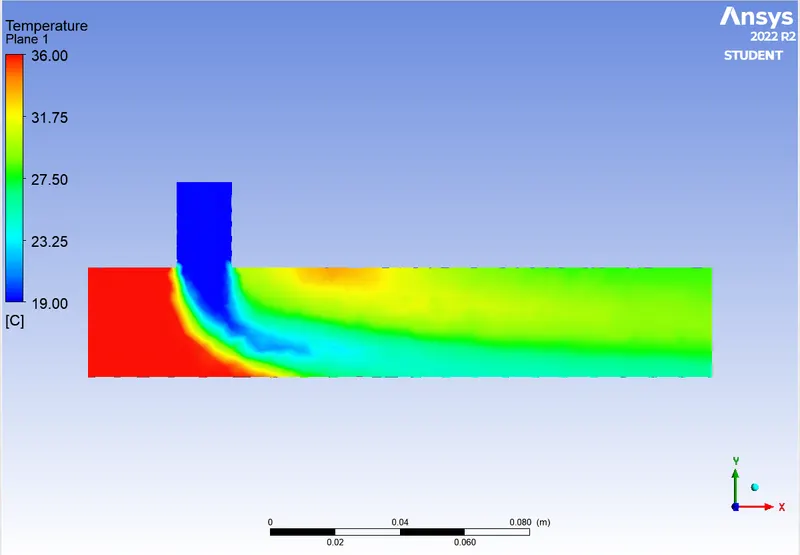
Fig.34 Temperature Contour for k Epsilon model momentum Ratio is 4
- Velocity Contour for k Epsilon model momentum Ratio is 4:-
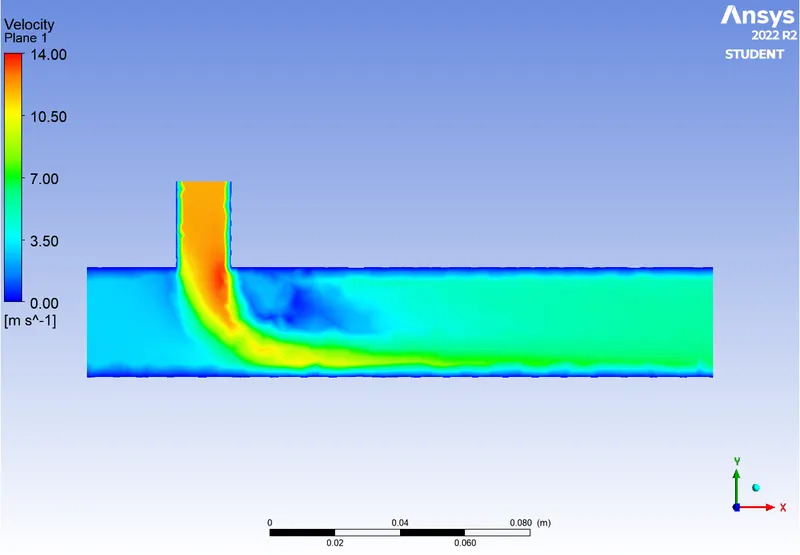
Fig.35 Velocity Contour for k Epsilon model momentum Ratio is 4
For K-Omega SST Model:-
- Residual Plot for k-Omega SST model momentum Ratio is 4:-
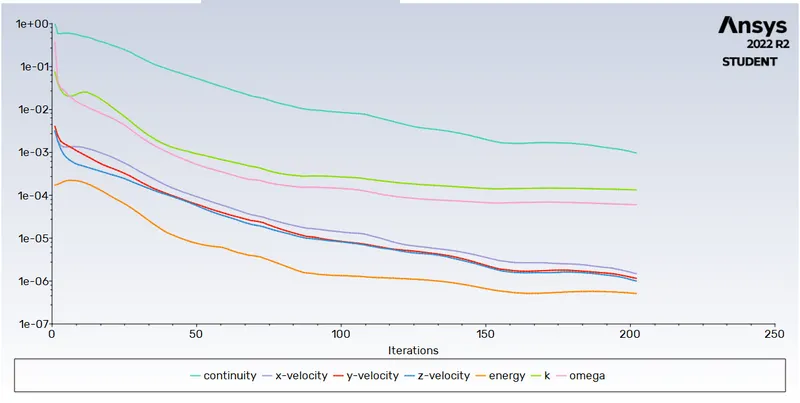
Fig.36 Residual Plot for k-Omega SST model momentum Ratio is 4
- Area Weighted Average Temperature Plot for k-Omega SST model momentum Ratio is 4:-
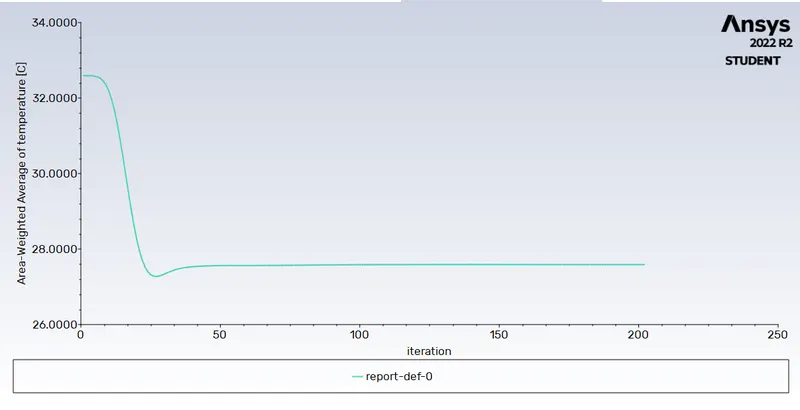
Fig.37 Area Weighted Average Temperature Plot for k-Omega SST model momentum Ratio is 4
- Standard Deviation of Temperature Plot for k-Omega SST model momentum Ratio is 4:-
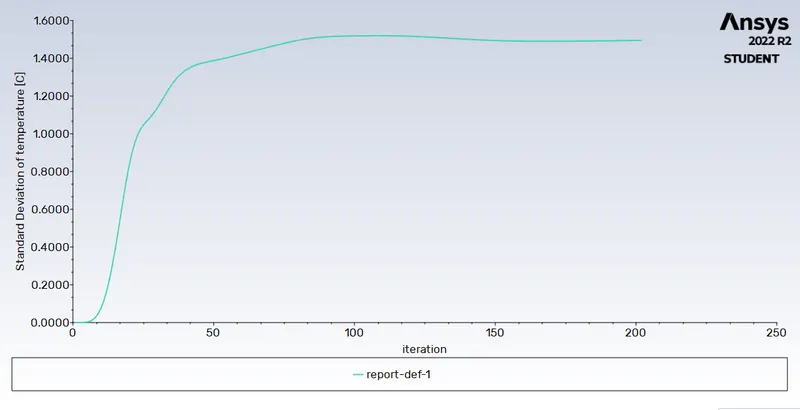
Fig.38 Standard Deviation of Temperature Plot for k-Omega SST model momentum Ratio is 4
- Temperature Contour for k Omega SST model momentum Ratio is 4:-
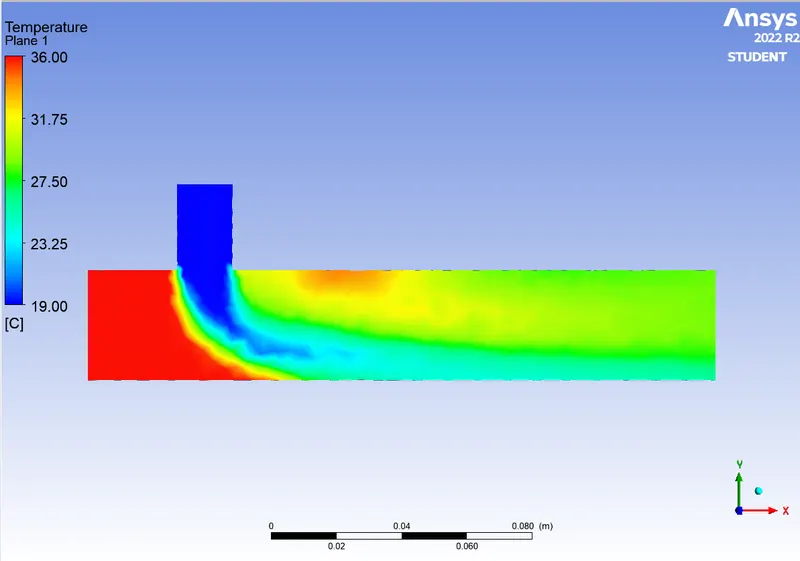
Fig.39 Temperature Contour for k Omega SST model momentum Ratio is 4
- Velocity Contour for k Omega SST model momentum Ratio is 4:-
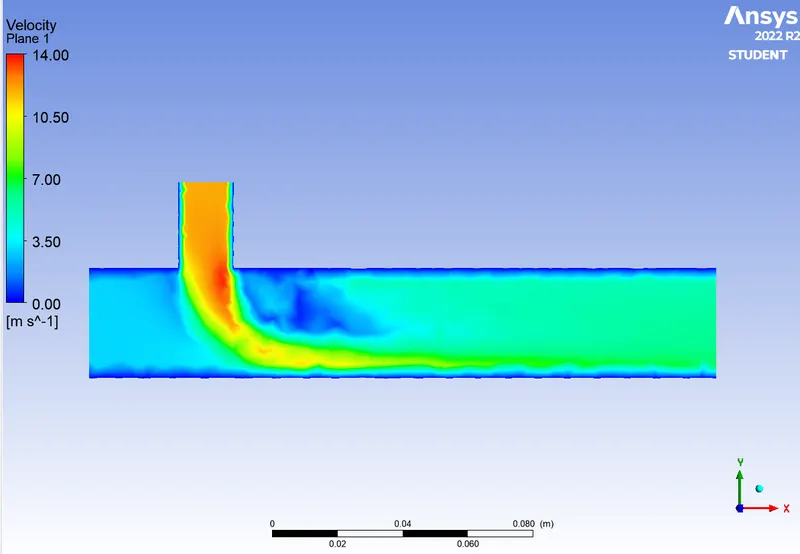
Fig.40 Velocity Contour for k Omega SST model momentum Ratio is 4
We used both terbulance model for Simulation of Short Tee Mixing Comparison of all parameters as below:
| Sr No | Turbulance Model | model | Momentum Ratio | Avg Temperature at Outlet | Standard Deviation Temperature | Cell Count | Number of Iterations |
| 1 | K-epsilon | Short Tee | 2 | 30.1984 | 1.7012 | 12780 | 150 |
| 2 | K-omega | Short Tee | 2 | 30.3212 | 1.8123 | 12780 | 250 |
| 3 | K-epsilon | Short Tee | 4 | 27.5766 | 1.3473 | 12780 | 128 |
| 4 | K-omega | Short Tee | 4 | 27.5884 | 1.4952 | 12780 | 202 |
From above table we can observed that K-epsilon Model takes less time for convergeing also K-epsilon Turbulance model takes less iterations to converge solution. so we can observed K-epsilon is the most Convinient for Simulation. so we are using K-epsilon for further.
Case 2 Long Tee:-
- Long mixing tee with a hot inlet velocity of 3m/s.
- Momentum ratio of 2, 4.
First we can solve as per momentum ratio 2, ie hot inlet velocity is 3 m/s and cold inlet 6 m/s.
- Residual plot for momentum ratio 2 and K-epsilon Model:-
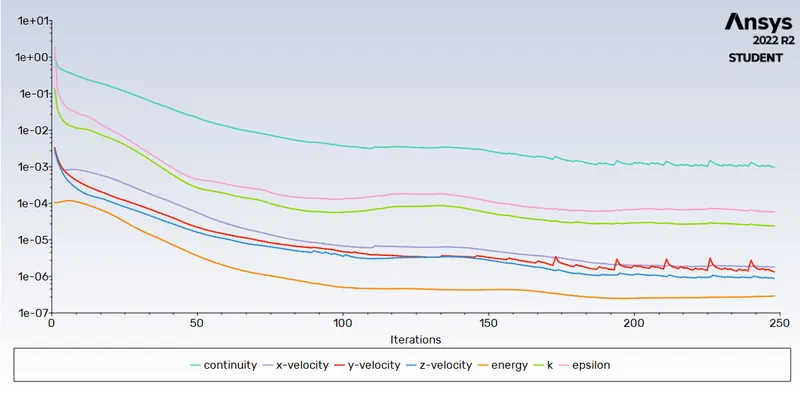
Fig. 41 Residual plot for momentum ratio 2 and K-epsilon Model
- Area Weighted Avrage of Temperature for momentum ratio 2 and K-epsilon Model:-
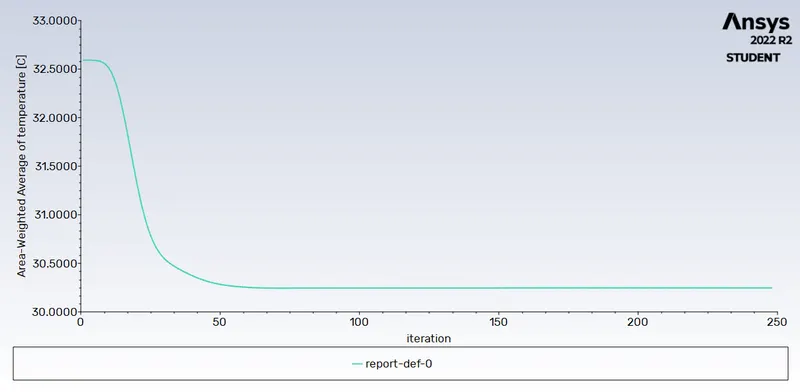
Fig.42 Area Weighted Avrage of Temperature for momentum ratio 2 and K-epsilon Model
- Standard Deviation of Temperature for momentum ratio 2 and K-epsilon Model:-
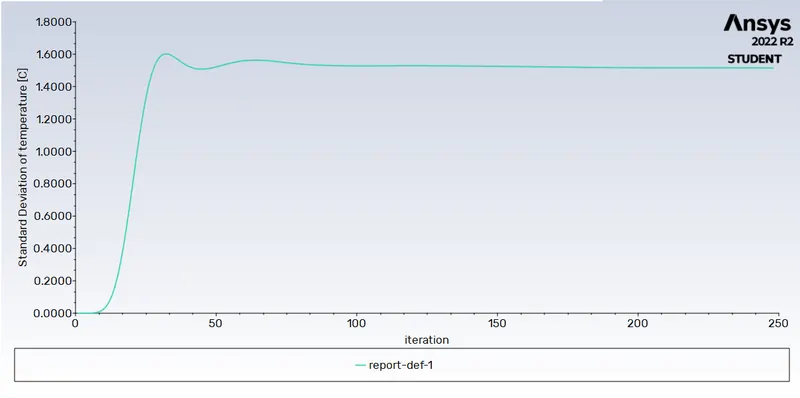
Fig.43 Standard Deviation of Temperature for momentum ratio 2 and K-epsilon Model
- Temperature Contour for k epsilon model momentum Ratio is 2:-
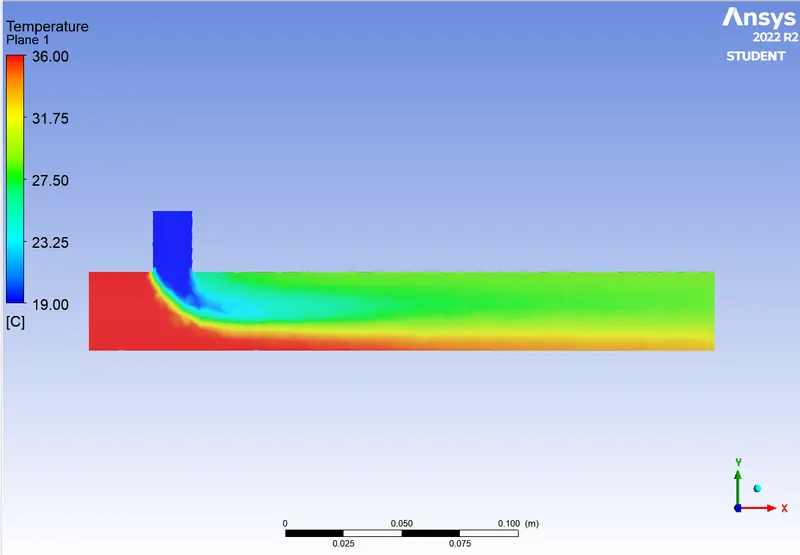
Fig.44 Temperature Contour for k epsilon model momentum Ratio is 2
- Velocity Contour for k epsilon model momentum Ratio is 2:-
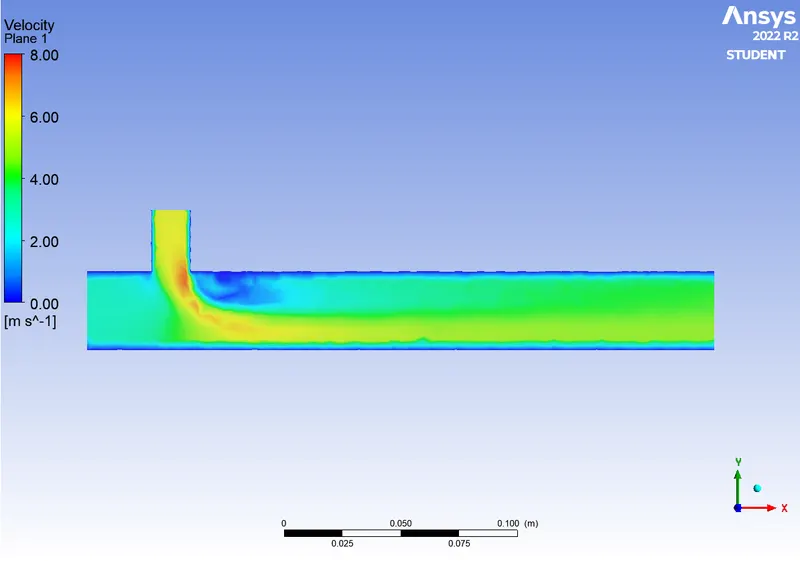
Fig.45 Velocity Contour for k epsilon model momentum Ratio is 2
- Temperature Contour for across the XY Plane k-epsilon model momentum Ratio is 2:-
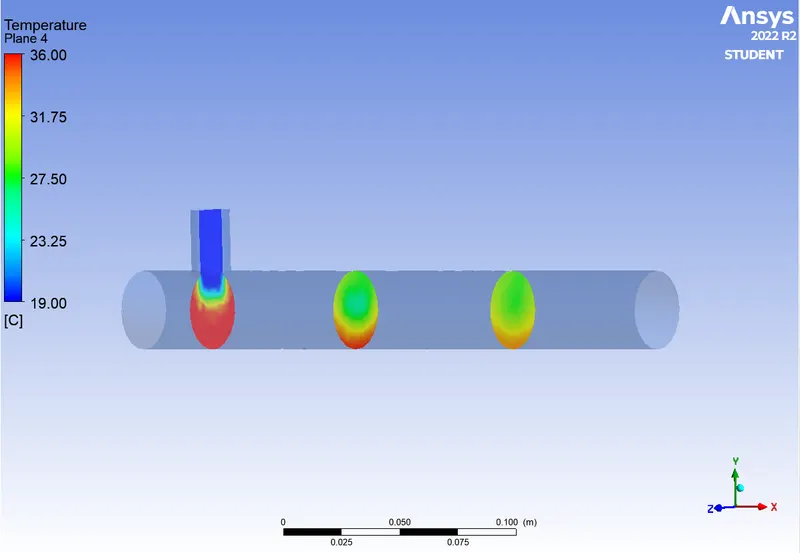
Fig. 46 Temperature Contour for across the XY Plane k-epsilon model momentum Ratio is 2
- Velocity Contour for across the XY Plane k-epsilon model momentum Ratio is 2:-
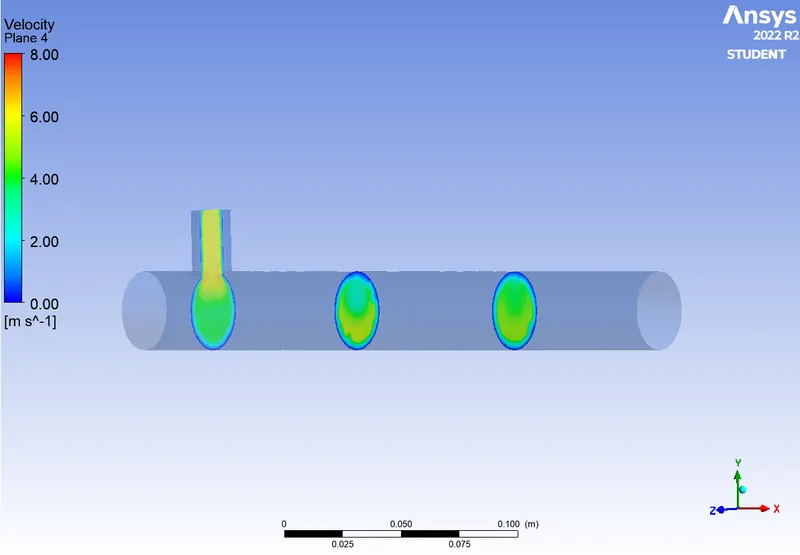
Fig.47 Velocity Contour for across the XY Plane k-epsilon model momentum Ratio is 2
- Temperature Contour for line plot along the pipe k-epsilon model momentum Ratio is 2:-
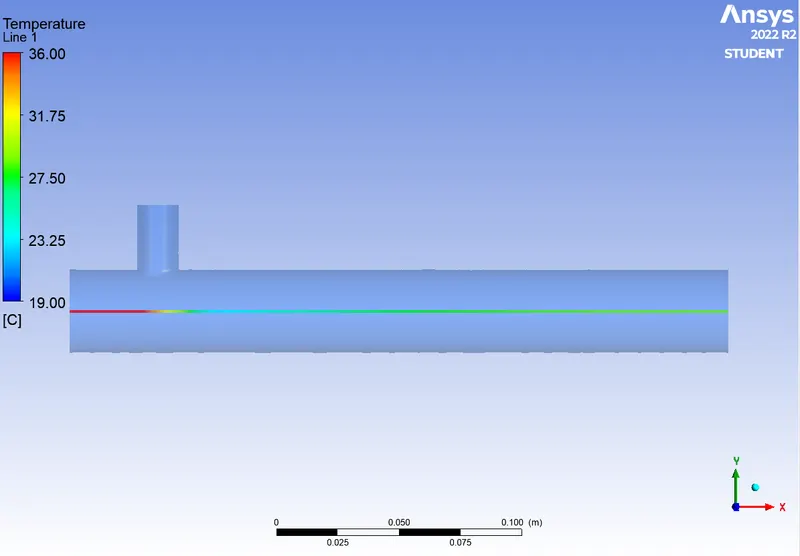
Fig. 48 Temperature Contour for line plot along the pipe k-epsilon model momentum Ratio is 2
- Temperature Profile for line plot along the pipe k-epsilon model momentum Ratio is 2:-
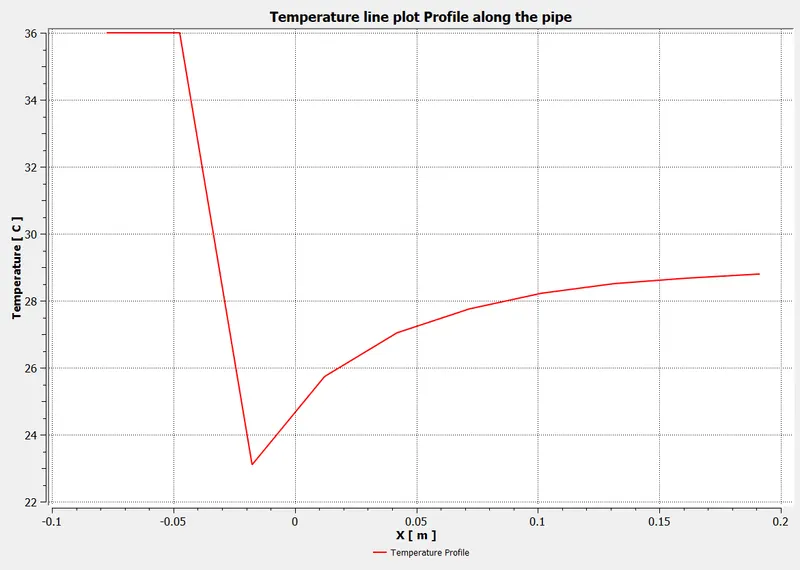
Fig.49 Temperature Profile for line plot along the pipe k-epsilon model momentum Ratio is 2
- Velocity Contour for line plot along the pipe k-epsilon model momentum Ratio is 2:-
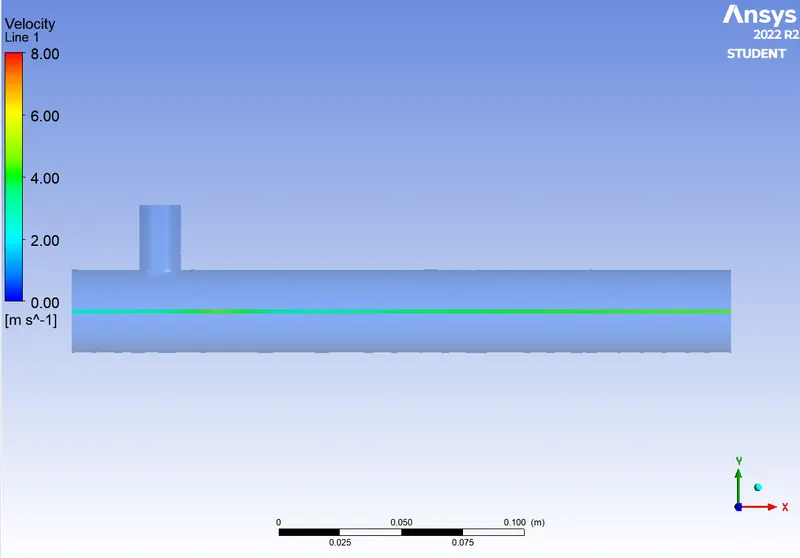
Fig.50 Velocity Contour for line plot along the pipe k-epsilon model momentum Ratio is 2
- Velocity Profile for line plot along the pipe k-epsilon model momentum Ratio is 2:-
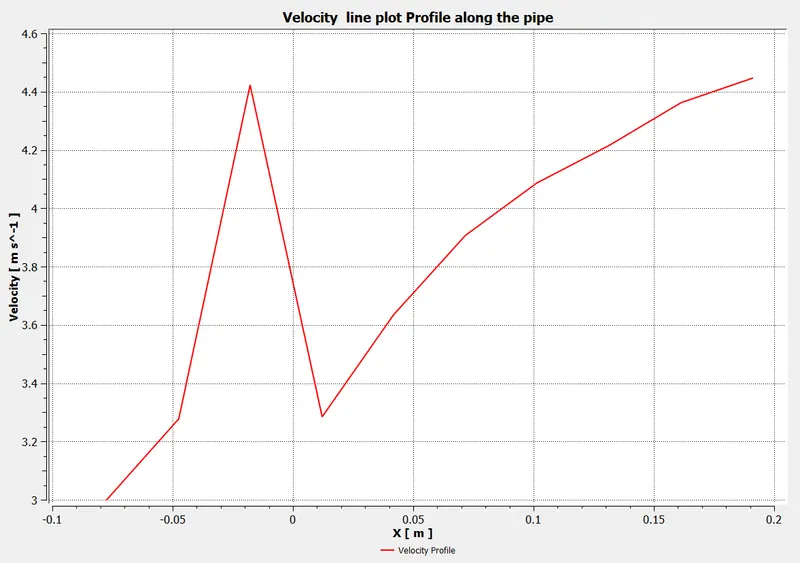
Fig. 51 Velocity Profile for line plot along the pipe k-epsilon model momentum Ratio is 2
- Temperature Contour for line plot across the pipe k-epsilon model momentum Ratio is 2:-
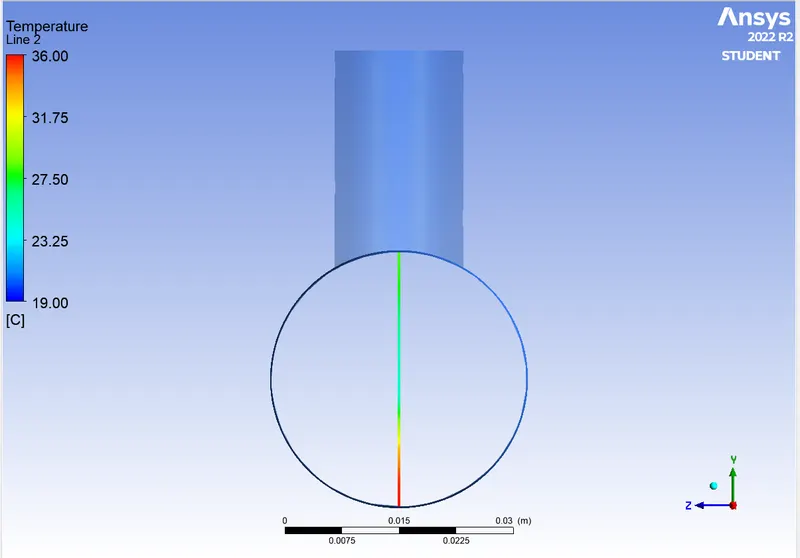
Fig. 52 Temperature Contour for line plot across the pipe k-epsilon model momentum Ratio is 2
- Velocity Contour for line plot across the pipe k-epsilon model momentum Ratio is 2:-
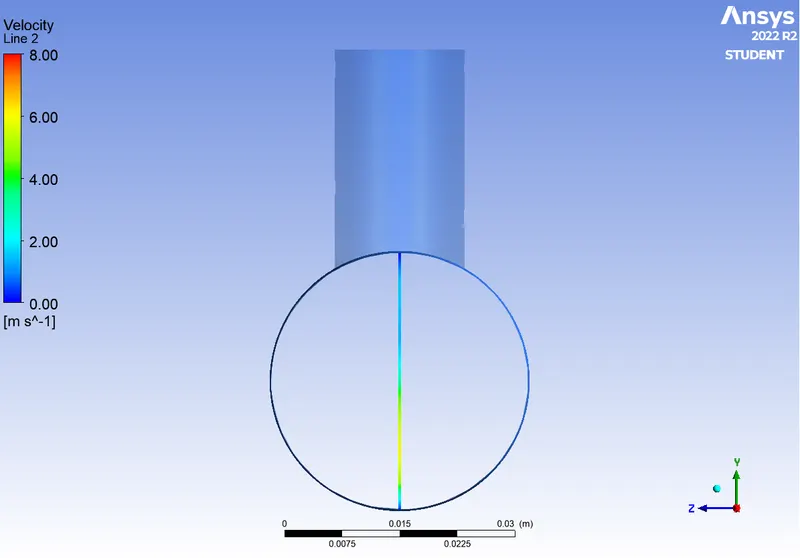
Fig.53 Velocity Contour for line plot across the pipe k-epsilon model momentum Ratio is 2
Momentum Ratio 4:-
- Residual Plot for K-epsilon Momentum Ratio 4:-
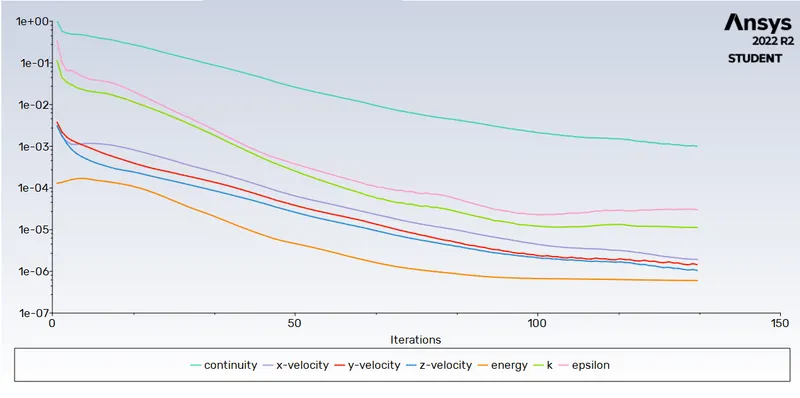
Fig. 54 Residual Plot for K-epsilon Momentum Ratio 4
- Area Weighted Avg for Temperature for K-epsilon Momentum Ratio 4:-
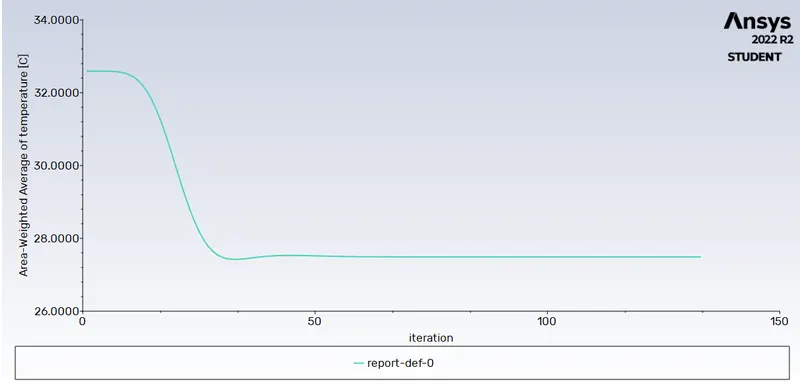
Fig. 55 Area Weighted Avg for Temperature for K-epsilon Momentum Ratio 4
- Standard Deviation for Temperature for K-epsilon Momentum Ratio 4:-
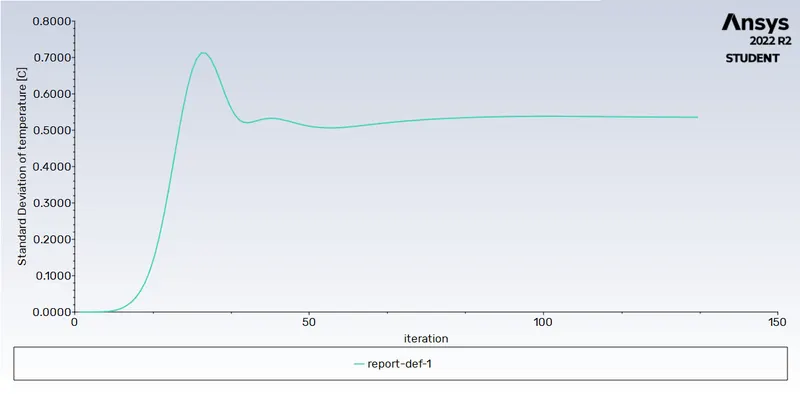
Fig. 56 Standard Deviation for Temperature for K-epsilon Momentum Ratio 4
- Temperature Contour for k epsilon model momentum Ratio is 4:-
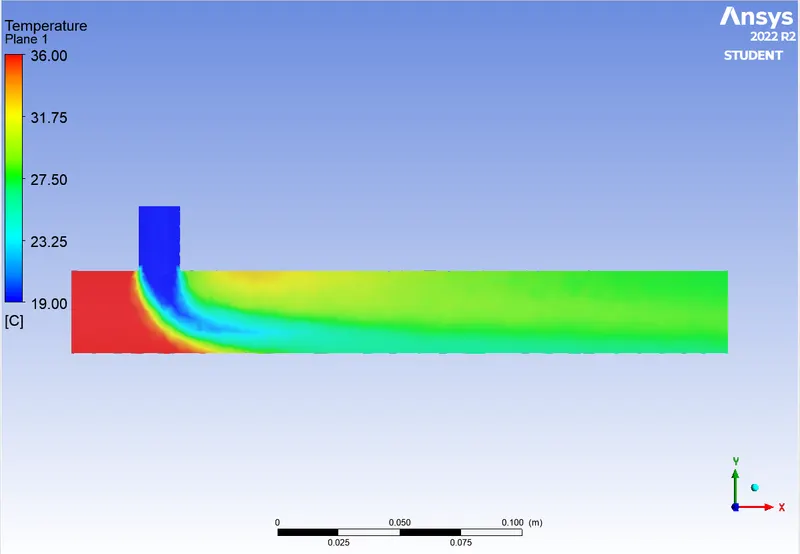
Fig.57 Temperature Contour for k epsilon model momentum Ratio is 4
- Velocity Contour for k epsilon model momentum Ratio is 4:-
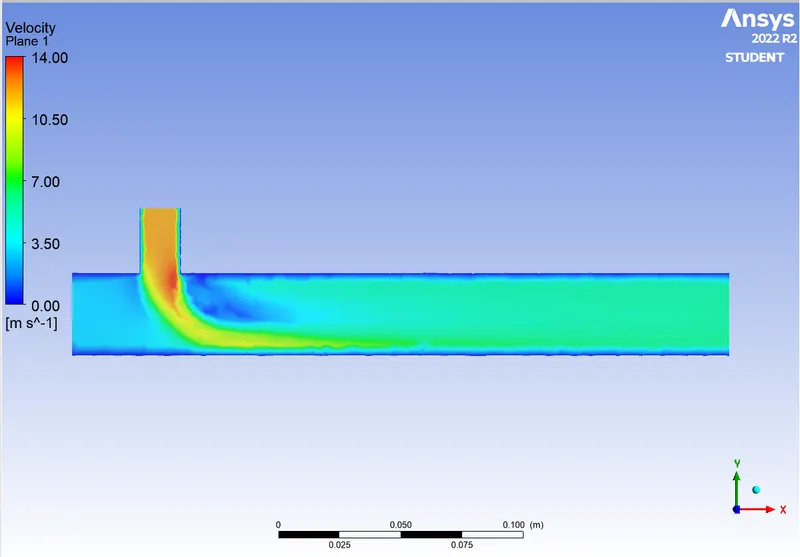
Fig. 58 Velocity Contour for k epsilon model momentum Ratio is 4
- Temperature Contour Across the plane XY for k epsilon model momentum Ratio is 4:-
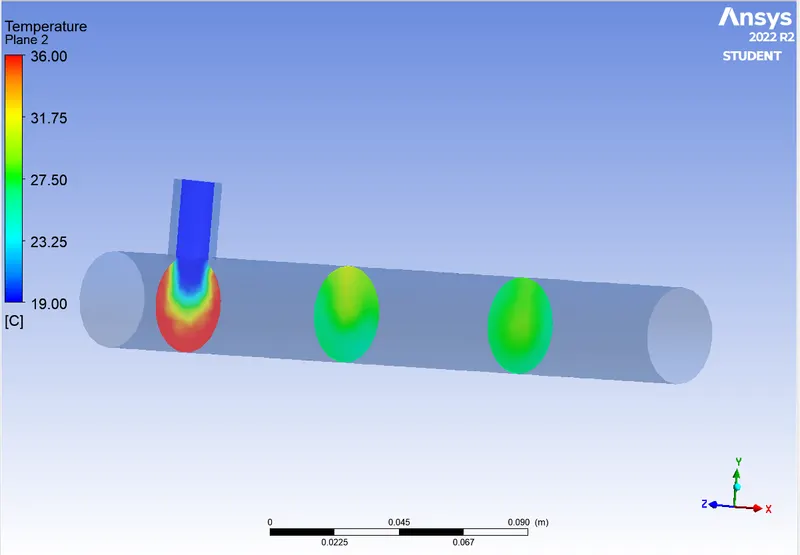
Fig. 59 Temperature Contour Across the plane XY for k epsilon model momentum Ratio is 4
- Velocity Contour Across the plane XY for k epsilon model momentum Ratio is 4:-
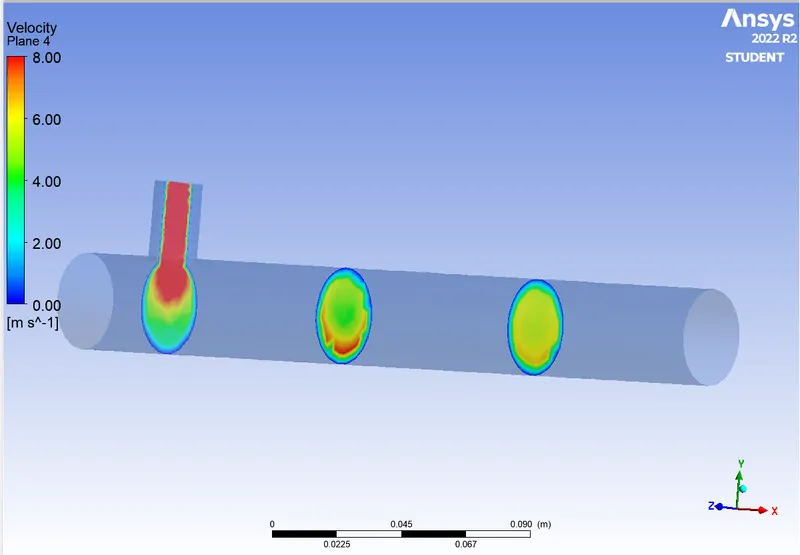
Fig. 60 Velocity Contour Across the plane XY for k epsilon model momentum Ratio is 4
- Temperature Contour for line plot along the pipe k-epsilon model momentum Ratio is 4:-
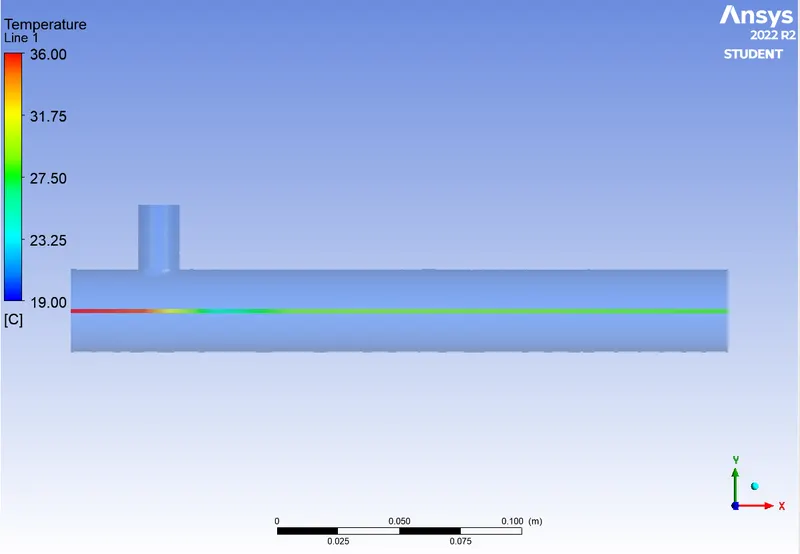
Fig. 61 Temperature Contour for line plot along the pipe k-epsilon model momentum Ratio is 4
- Velocity Contour for line plot along the pipe k-epsilon model momentum Ratio is 4:-
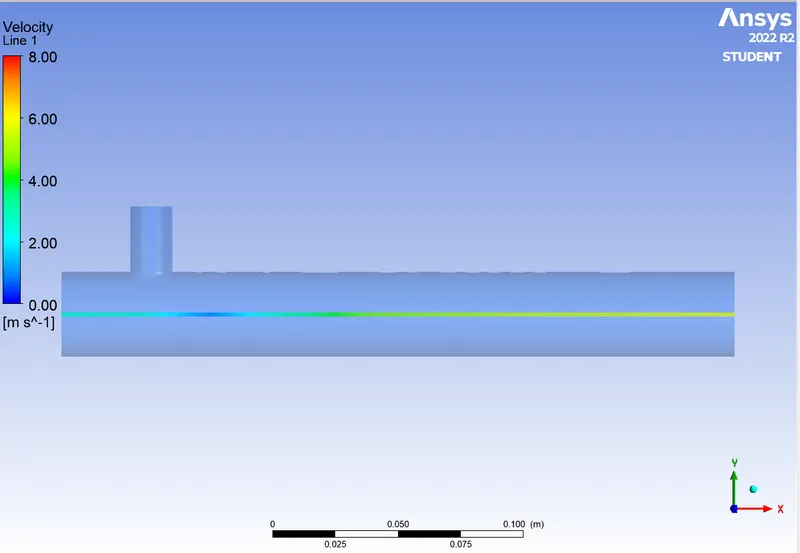
Fig. 62 Velocity Contour for line plot along the pipe k-epsilon model momentum Ratio is 4
- Temperature Contour for line plot across the pipe k-epsilon model momentum Ratio is 4:-
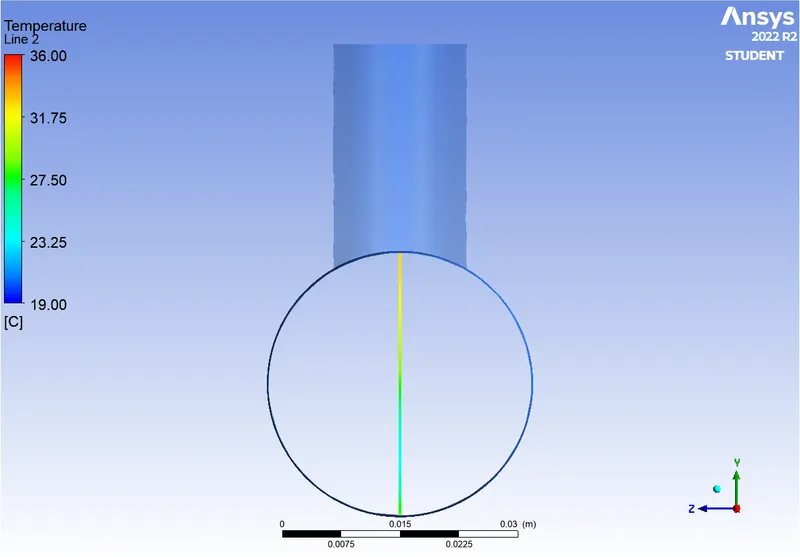
Fig. 63 Temperature Contour for line plot across the pipe k-epsilon model momentum Ratio is 4
- Velocity Contour for line plot across the pipe k-epsilon model momentum Ratio is 4:-
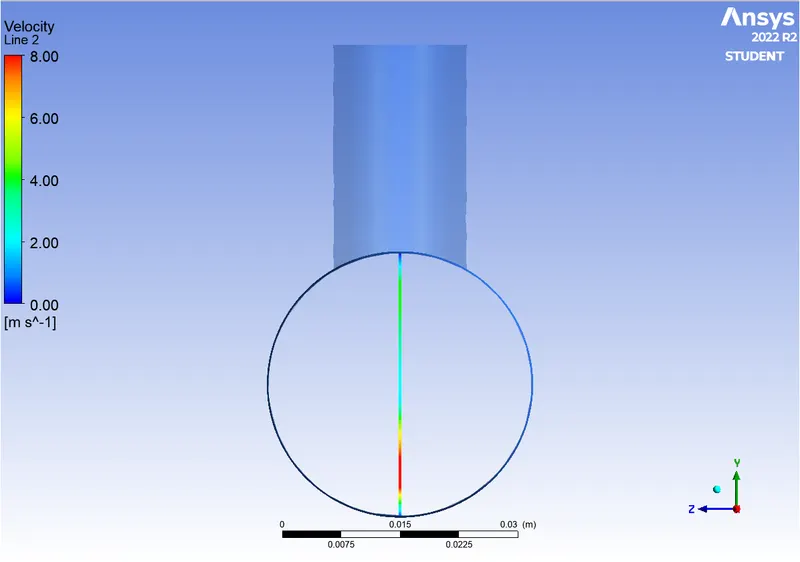
Fig. 64 Velocity Contour for line plot across the pipe k-epsilon model momentum Ratio is 4
Results are tabulated as below:-
| Sr No | Model | Turbulance Model | Cell Count | Mometum Ratio | Average Temperature at Outlet | Standard Deviation temperature | No. od Iterations |
| 1 | Long Tee | K- epsilon | 15635 | 2 | 30.2467 | 1.5147 | 248 |
| 2 | Long Tee | K-epsilon | 15635 | 4 | 27.4913 | 0.5355 | 133 |
Mesh Independence Study:-
- For Mesh Independence Test we have Selected Long Tee
- for study element size is 3 mm, 5 mm and 7 mm.
1. Mesh Element Size 3 mm:-
- Generated Mesh of size 3 mm
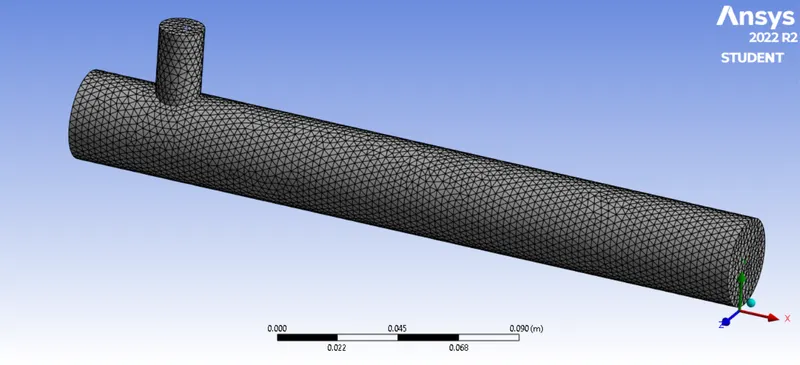
Fig. Generated Mesh of size 3 mm
- Residual plot :-
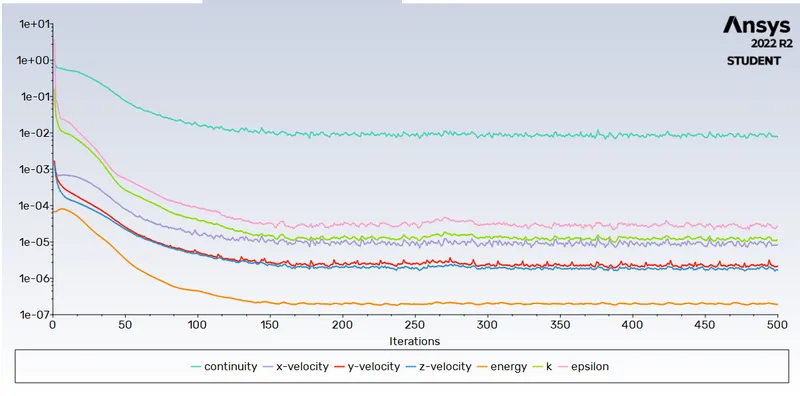
Fig. Residual Plot
- Area weighted Avreage for Temperature:-
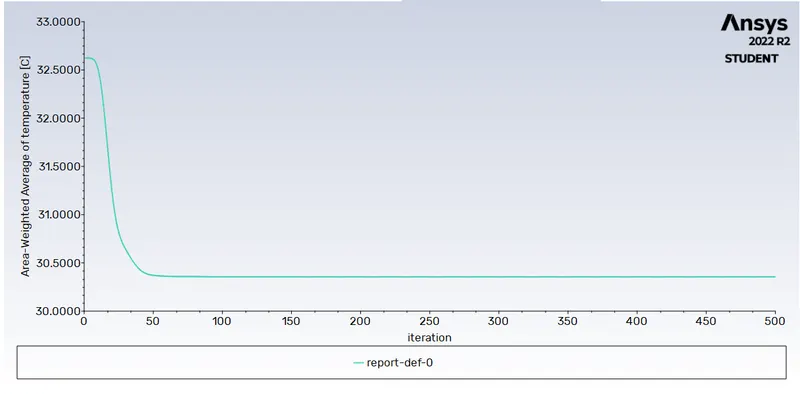
Fig. Area weighted Avreage for Temperature
- Standard Deviation of Temperature:-
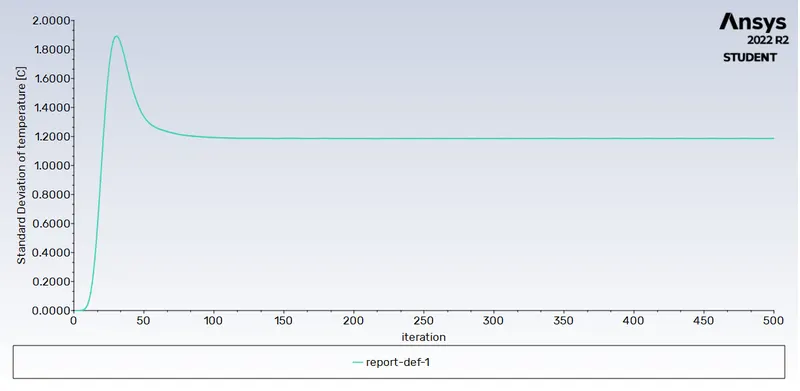
Fig. Standard Deviation of Temperature
2. Mesh Element Size 5 mm:-
- Generated Mesh
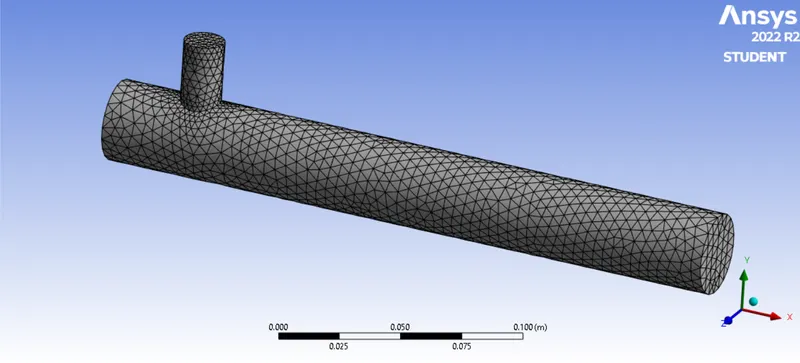
Fig. Generated Mesh for 5 mm Size
- Residual Plot:-
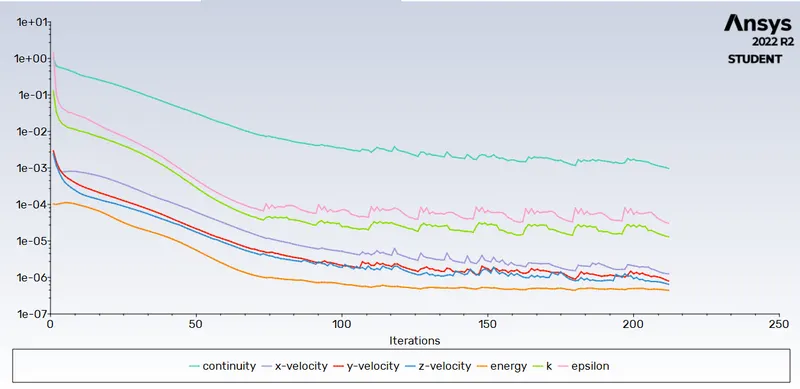
Fig. Residual Plot for 5 mm Mesh size
- Area Weighted Avg Temperature:-
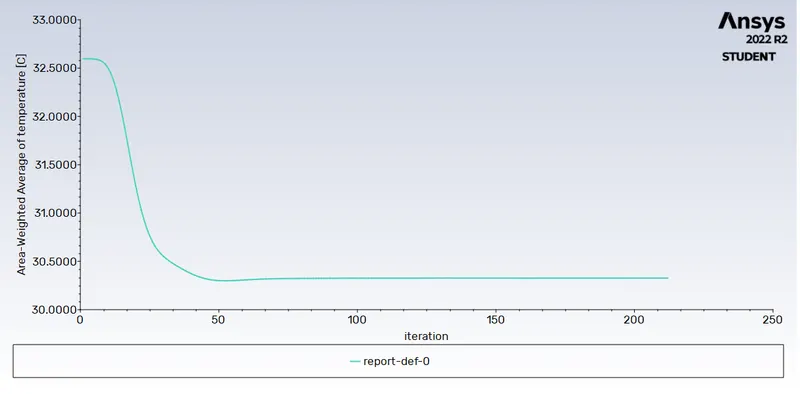
Fig. Area Weighted Avg Temperature
- Standard Deviation of Temperature:-
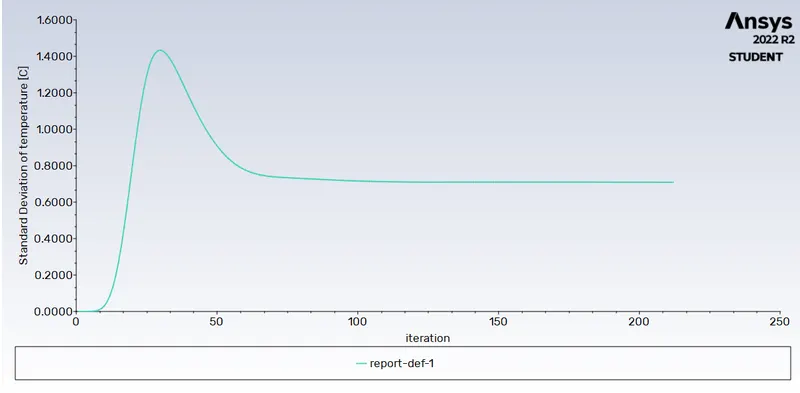
Fig. Standard Deviation of Temperature
3. Mesh Element Size 7 mm:-
- Generated Mesh:-
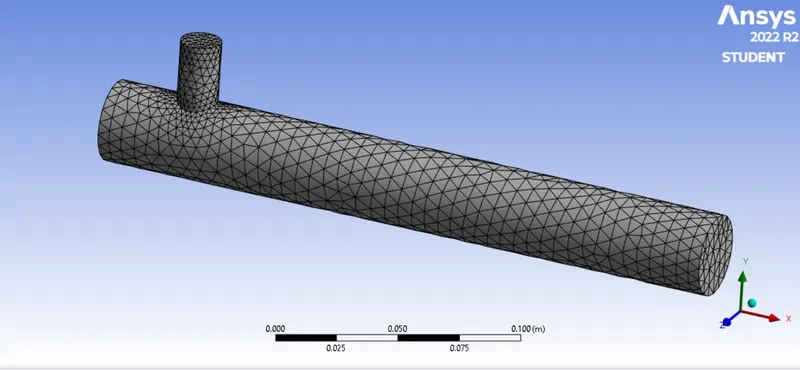
Fig. Generated Mesh for 7 mm Mesh Size
- Residual Plot for 7 mm Mesh Size:-
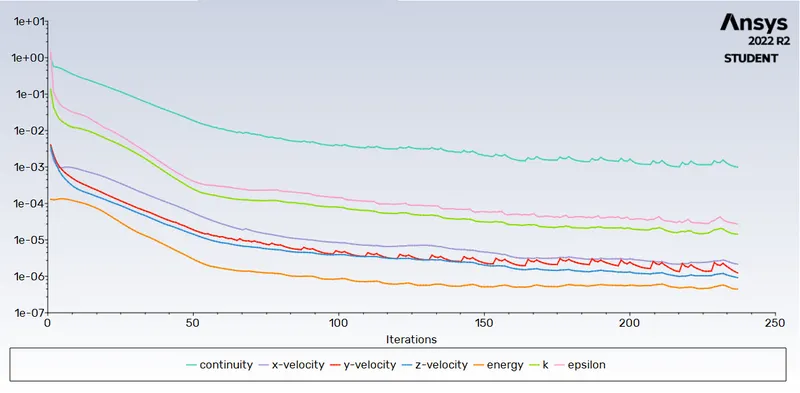
Fig. Residual Plot for 7 mm Mesh Size
- Area Weighted Avg Temperature for 7 mm Mesh Plot:-
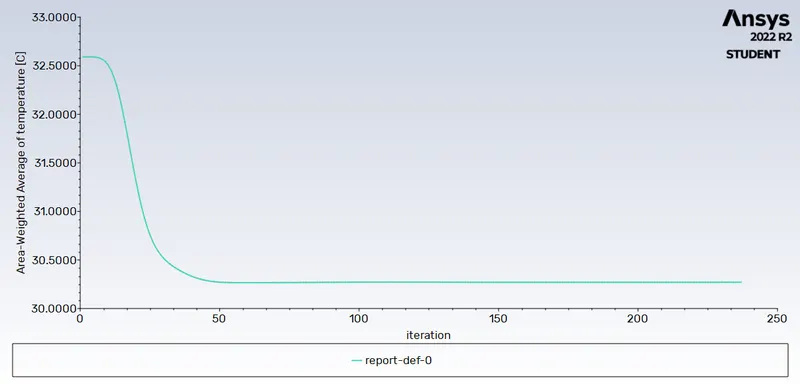
Fig. Area Weighted Avg Temperature for 7 mm Mesh Plot
- Standard Deviation of Temperature For 7 mm Mesh:-
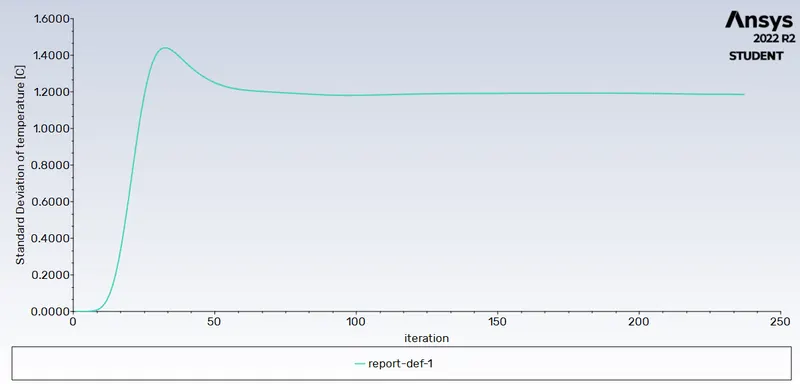
Fig. Standard Deviation of Temperature For 7 mm Mesh
Result Of Mesh independent Test:-
| Sr No | Mesh element Size | No of Iterations | Cell Count | Averahe Temperature at Outlet | Standerd Deviation of Temperature |
| 1 | 3mm | 500 | 56294 | 30.3531 | 1.1860 |
| 2 | 5mm | 212 | 16768 | 30.3266 | 0.7091 |
| 3 | 7mm | 237 | 9731 | 30.2708 | 1.1862 |
From Above Mesh indepenence study we can observed that no any difference in Avereage outlet Temperature so we can use time saving Mesh ie 5 mm due to it takes less iterations.
CONCLUSION:-
Effect of Length of Tee and Momentum Ratio on Results:-
- we can conclude that Output Temperature Not affects by Increasing Length.
- Momentum Ratio affect to the Output Temperature, If Momentum Ratio Incresed Output Temprature Drop suddenly.
- For Proper Mixing of Air Velocities are very important as required Temperature.