Week 1- Mixing Tee
PROJECT REPORT
- Aim: - To analyse the flow in mixing Tee in two different Momentum Ratio and two different Geometries, to Record the results and change in temperature at the Outlet
- Objective: - 1) Measure the temperature changes at outlet as the change in velocity of inlet
2) Record the changes in results as we use two different models in calculation i.e., K-omega SST and K-epsilon model
3) Record the changes in output as we change the length of geometry
For Simulation Ansys Fluent is used, The Report is as Follow.
- First Geometry
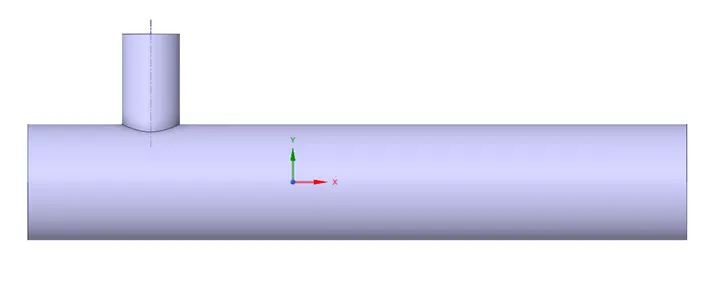
- For the First case a short Mixing-Tee is used with the length of fluid volume is 0.19m
- The Bigger Radius is 0.2m, As shown in fig.
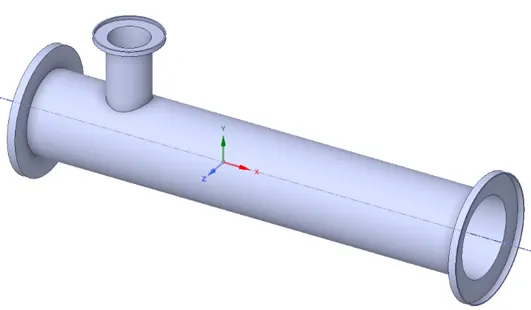
- Fluid Volume image
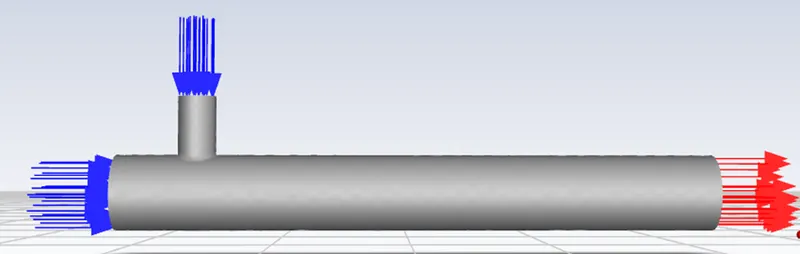
Now, for analysis there are two inlets one in x-direction and another in y-direction, from inlet 1 hot air will enter with the velocity of 3m/s, and from inlet 2 cold air will enter, we are going to record the changes in the turbulent mixture of hot and cold air, with different momentum ratio i.e., the velocity we are going to consider for cold air is 6m/s and 12m/s. We will check for the changes in outlet for both conditions respectively
- Mesh for short Mixing Tee
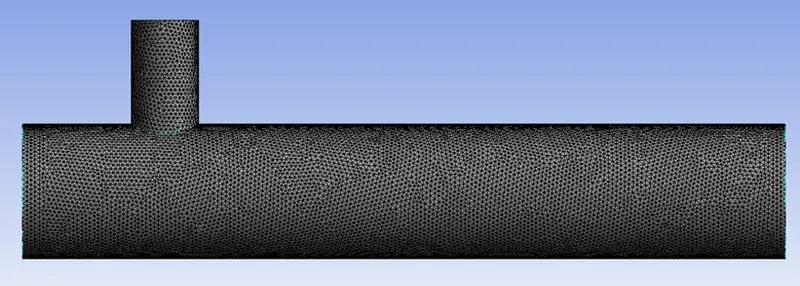
In small mixing tee simulation, I have used a very fine mesh quality with unstructured Trapezoidal mesh type, to get some sharp image of temperature in the results. No. of cell in this mesh is 302455 and no. of nods are 5900
- Input
Now, Parameters
Inlet 1 velocity = 3m/s
Inlet 1 temperature = 36 Degree Celsius
Inlet 2 velocity = 6m/s (Momentum Ratio = 2)
Inlet 2 temperature = 19 Degree Celsius
Model – K- Epsilon
- Output
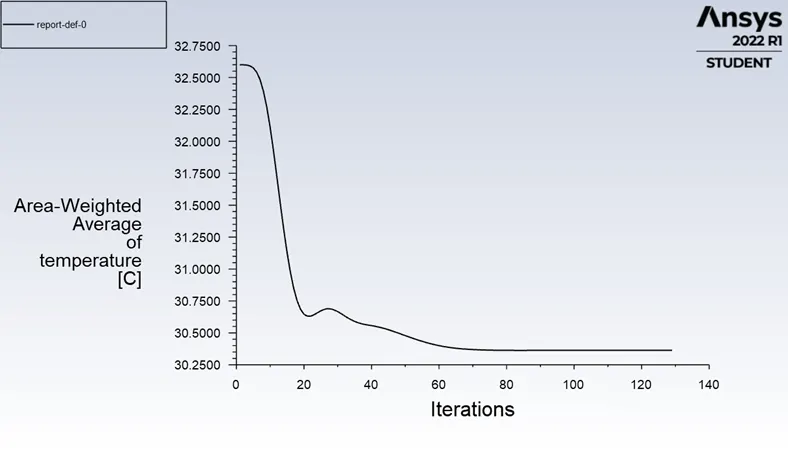
Temperature at outlet through iterations of calculation
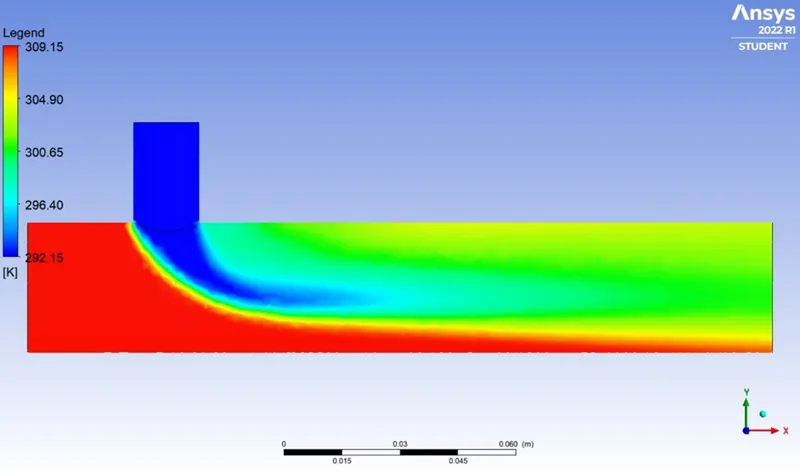
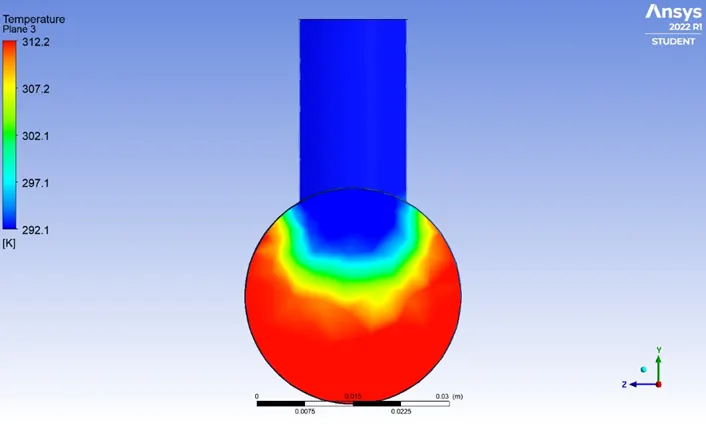
K-Epsilon model with Momentum Ratio = 2
In side view it shows some beautiful turbulent mixing of both airs, with the Sudden change in temperature
Final Results, as we can see the Mixing is not that good and turbulent, ad the velocity of cold air is low the turbulent mixing is not completed and a hot flow line can be spotted at the bottom of the tee. The final outlet quantities are specified at end chart
Similarly, the experiment was done for the momentum ratio of 4, i.e., the inlet velocity for cold air is doubled to 12m/s. and for both K- Epsilon and K-omega SST model
- K-Epsilon model for momentum ratio of 4 (Only inlet velocity of cold air is changed to 12m/s)
Output:
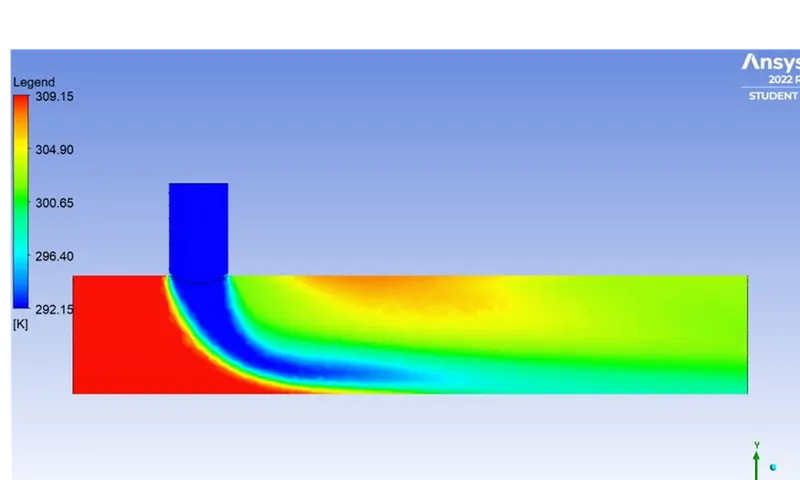
K-Epsilon model with momentum ratio of 4
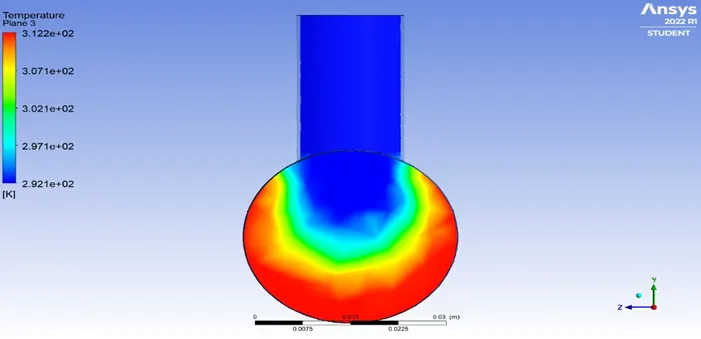
The change in side view can be spotted as the velocity changes, from previous simulation
- Velocity Distribution
Output:
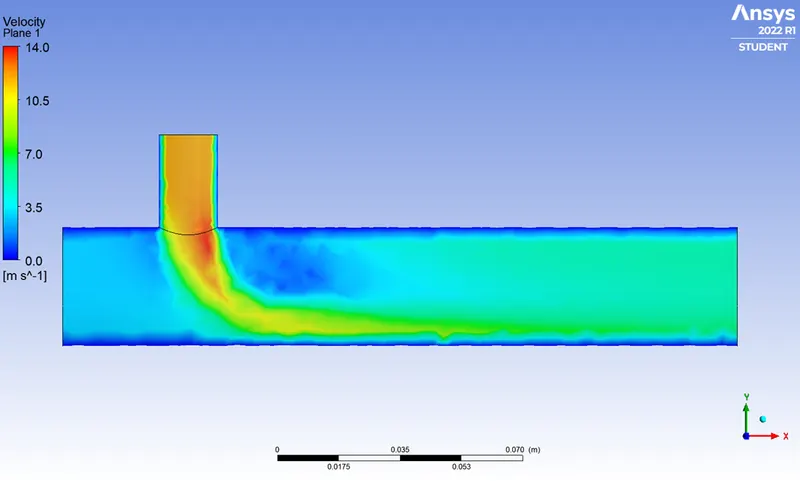
Velocity Distribution Through the pipe
At the point of Turbulent Mixture Where hot air with low velocity mixes with cold air with high velocity with momentum ratio of 4, a patch is shown with a circle where there low velocity of air. The velocity distribution with no. of iterations can be seen in the following graph
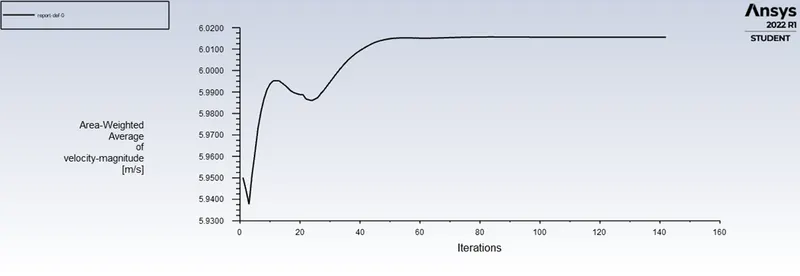
- Temperature Graph
As, we can see here the mixing and the turbulent flow is better and at the output we can see a uniform temperature. Overall, the mixing of both inlet air is better than previous low momentum ratio
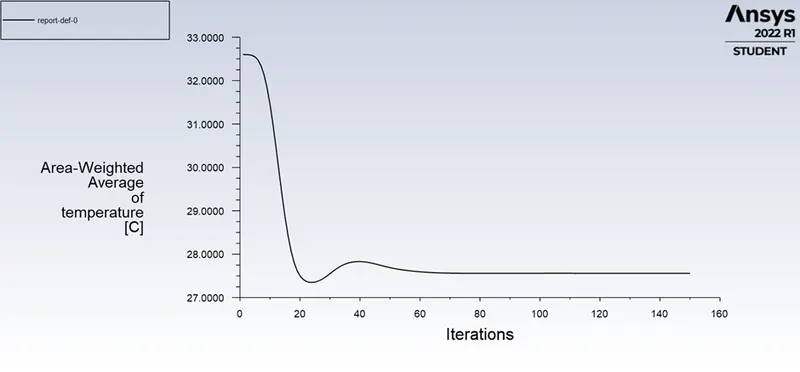
Temperature at outlet along with Iteration
- Which method to use?
- Both Omega and Epsilon Represent the same physical quantities
- Both have a relation - Omega = epsilon / Cmue * K, Where Cmue = 0.09
- K-omega SST model is More accurate than K-Epsilon method as K-Omega SST is made by both K-epsilon and K-Omega model but it is more accurate where there is an adverse Pressure gradient or a diffusion term involved
- As there is no such thing in our simulation, we could use both method the result won’t show any drastic changes
- With both option on table, I choose to use K-Omega SST to be more accurate and in K-Epsilon model a change in free stream turbulence can significantly affect the Result
- Second Geometry
Now, to check the change in output as we change the length a longer Mixing Tee was used with the length of 0.27m of Flued volume with same radius of 0.02m
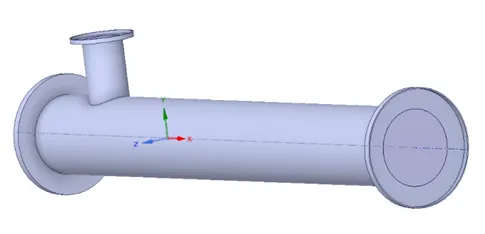
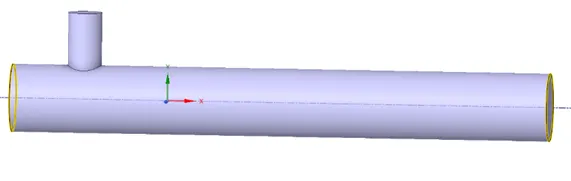
Longer Mixing Tee Fluid Volume of Longer Tee
- Output
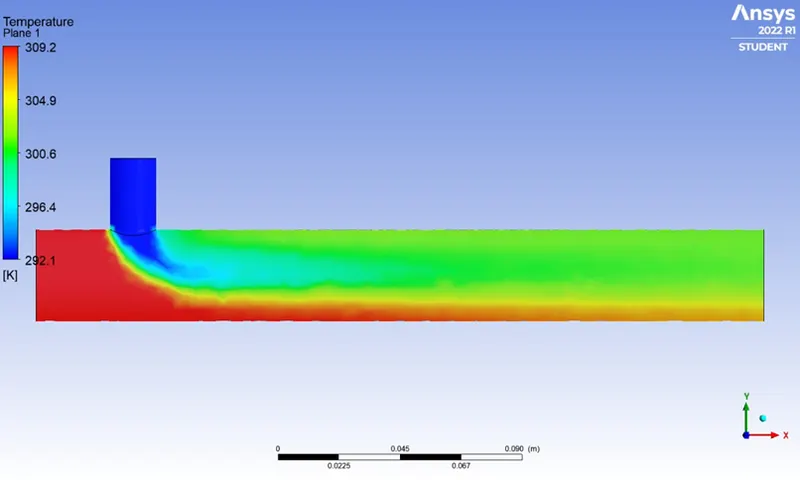
Momentum ratio = 4
Simalrly in last cast the turbulant mixing is not that effective and the average temprature at the outlet is also more upto 30.25 degree celcius
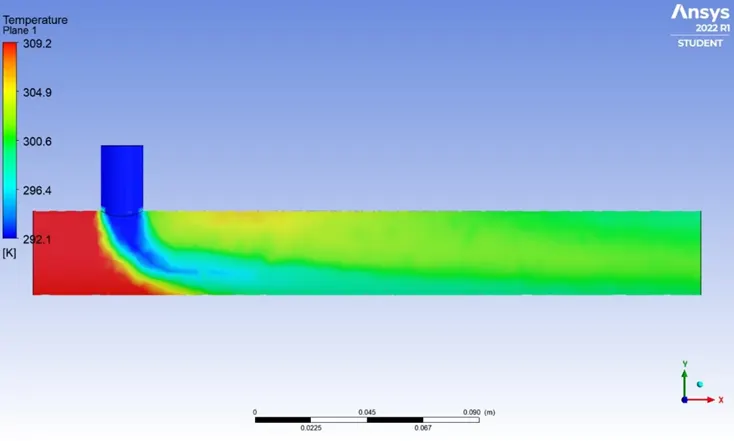
Momentum ratio = 4
As the velocity of cold air increases like last case similarly the mixing is more effective, and the output teperature is 27.5 degree celcius, which can be seen in the following graph
- Final Result Table
|
Geometry first Small Tee |
|||||||
|
Avg. Outlet Temperature(C) |
No. of sell |
No. of iterations for convergence |
|||||
|
Momentum ratio- |
2 |
4 |
2 |
4 |
2 |
4 |
|
|
K - Epsilon Model |
30.35 |
27.5 |
302455 |
302455 |
151 |
171 |
|
|
K - Omega SST Model |
30.4 |
28 |
302455 |
302455 |
231 |
137 |
|
|
Geometry second long Tee |
|||||||
|
K - Omega SST Model |
30.25 |
27.5 |
15530 |
15530 |
201 |
242 |
|
- Conclusion
- With higher Momentum ratio good turbulant Flow can be seen in mixing Tee and can give a good change in Temperatute at outlet
- If theres is not any pressure Gradient term or any diffusion term involved in our simulation both K-omega SST or K-Epsilon can show same results, but K-omega SST is more accurate in such cases
- By changing the length of the Mixing Tee there won’t be any change at the outlet temprature