Week 1- Mixing Tee
Assignment Name- mixing tee
Aim-To simulate the flow of air through missing tee and study the effect of length of pipe and momentum ratio of velocity for mixing of air by using two different types of pipes (short and long pipe)
Objective-
- To setup the steady state simulations to compare mixing effectiveness
- Compare the simulation by using k-omega SST and k-epsilon turbulence model
- Perform Independent mesh test study
- Compare the result and output for long and short mixing tee
Introduction- In HVAC and petrochemical industry used nixing tee application in which two fluid streams with different physical and chemical properties mix together.
In this assignment we perform hot air flowing in the main pipe at 36-degree Celsius temperature and cold air flowing in the tee at 19-degree Celsius and then we obtain velocity and temperature contour at different momentum ratio. And we also conclude that which technique is more suitable i.e. (k-epsilon & k-omega)
It is step up as steady state simulation to compare the mixing effectiveness when hot inlet temperature 36-degree Celsius and cold air 19-degree Celsius
Case A-short mixing tee
Hot inlet velocity-3m/s
Momentum ratio-2, 4
Case B-Long mixing tee
Hot inlet velocity-3m/s
Momentum ratio-2, 4
Momentum Ratio- It is ratio velocity of cold inlet to the velocity of hot inlet
Case set up(procedure)-
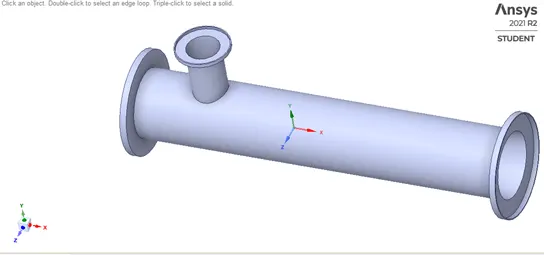
Short mixing tee-
Below figure shows short mixing tee
CAD clean-up/pre-processing-space claim
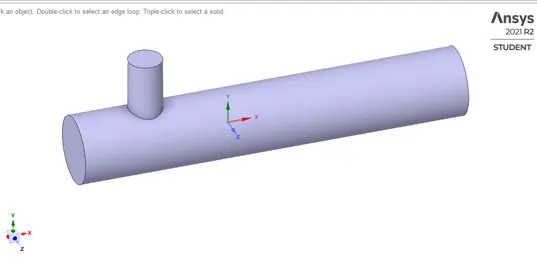
The cad model is imported into the space claim to extract the flow volume field from the model and the extracted volume is shown below
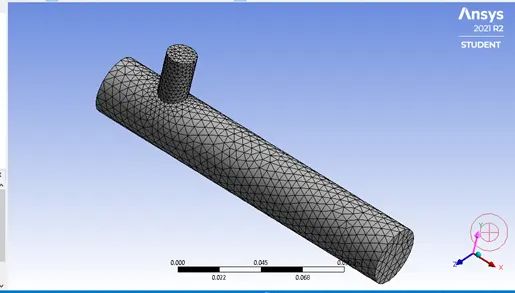
Mesh- In the step the boundary Names is assign and then mesh is generated. Please take care about spelling mistake because if you give right syntax in Ansys fluent the properties for mesh are automatically generated in Ansys fluent and also check quality of element
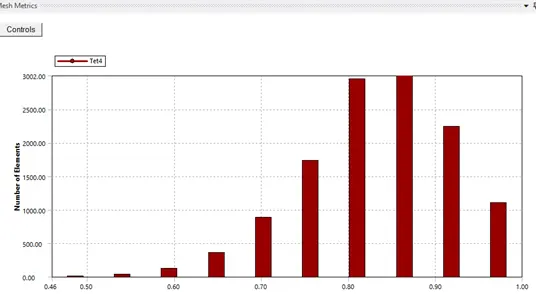
Quality of element
Setup-
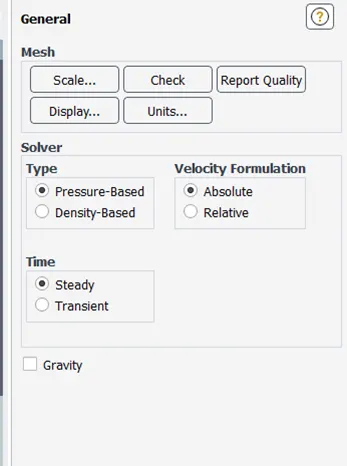
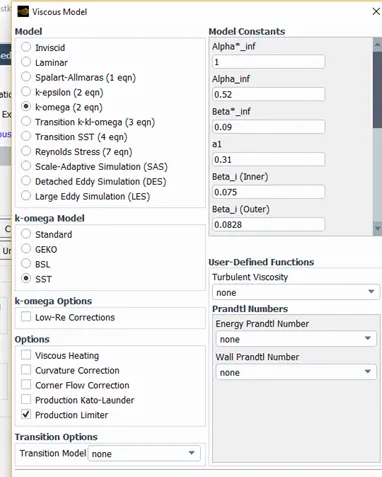
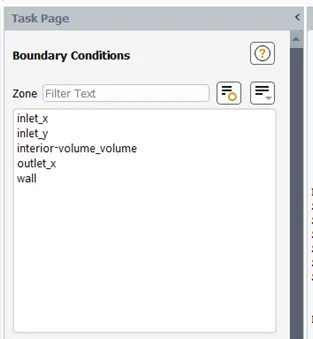
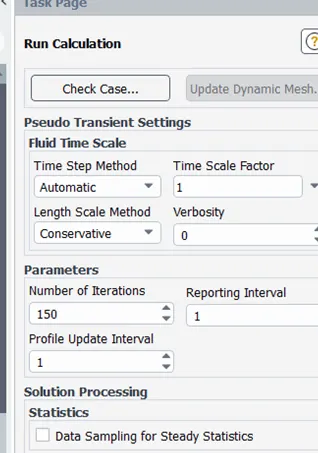
In this step we apply the boundary condition (inlet, outlet Bc) turbulence model is setup like k-epsilon and k-omega for solving the turbulent mixing of air. The number iteration is set in this section
Select your viscous model
Assign Boundary condition
After initializing your procedure, you go for Run Calculation
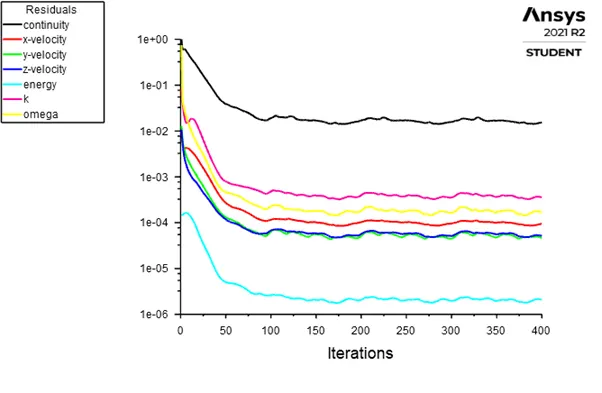
After converge the result we get following output graphs
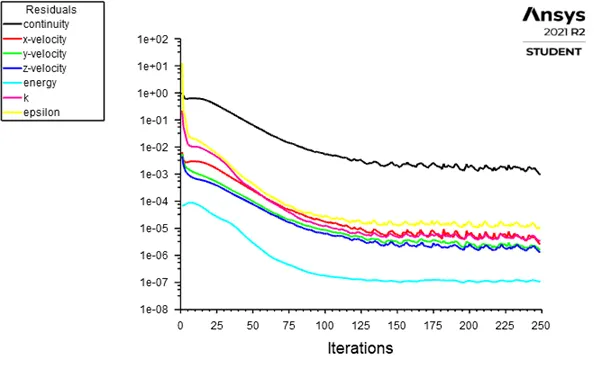
Residual plot
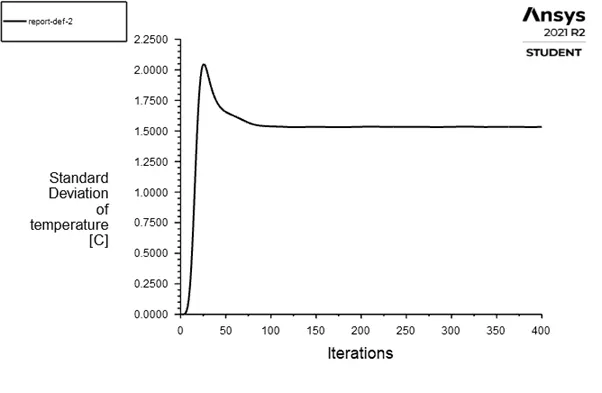
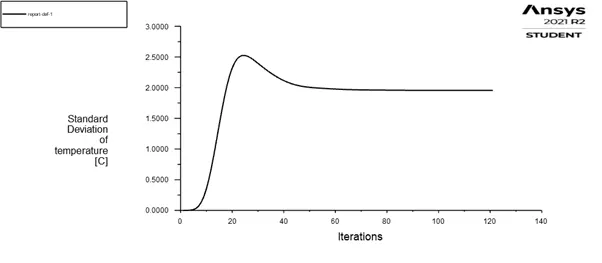
Standard Deviation Of temperature
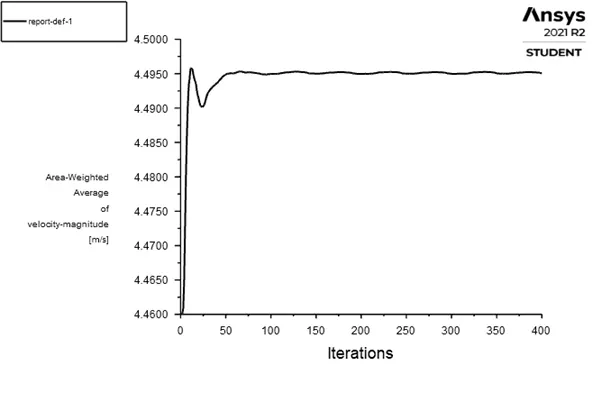
Area weighted Average of velocity Magnitude
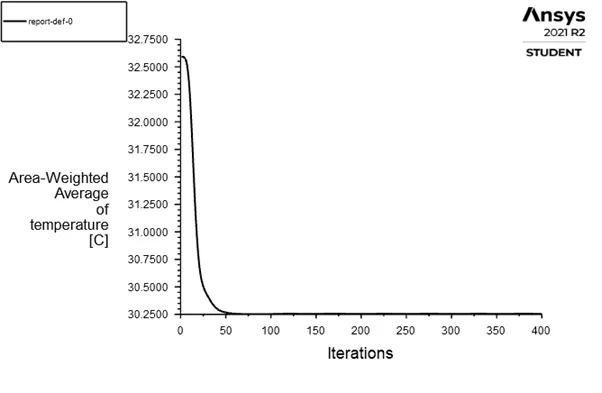
Area-Weighted Average of temperature
CFD post-processing
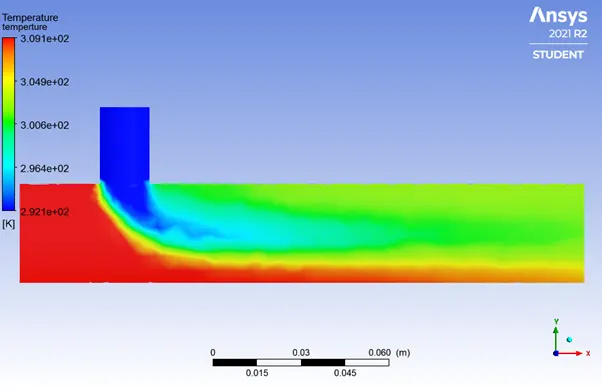
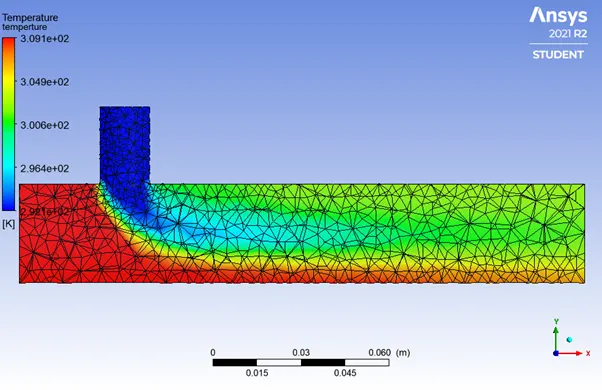
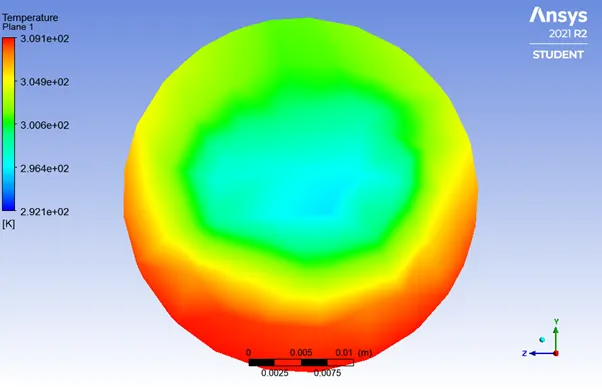
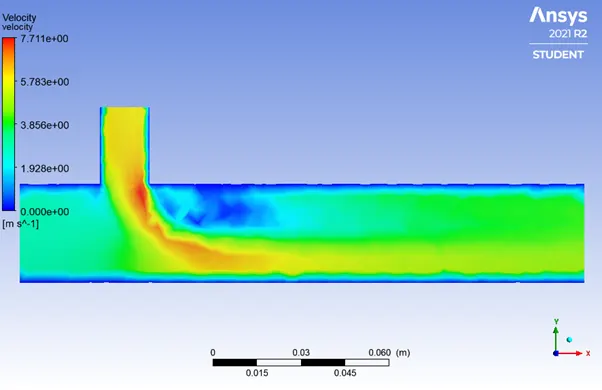
In this step we will see your results like temperature and velocity contour to visualize the properties for which simulation run
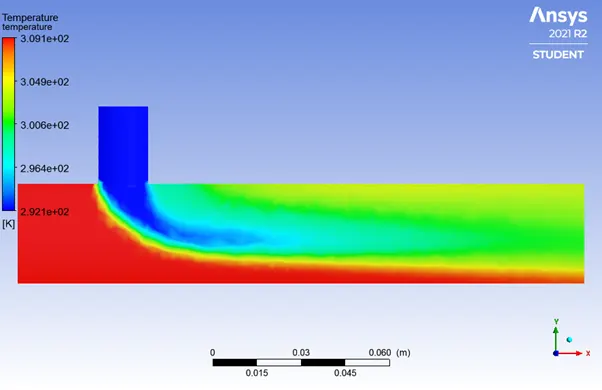
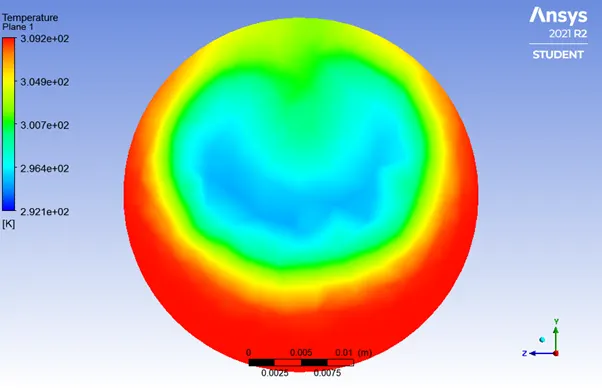
Different Temperature contour
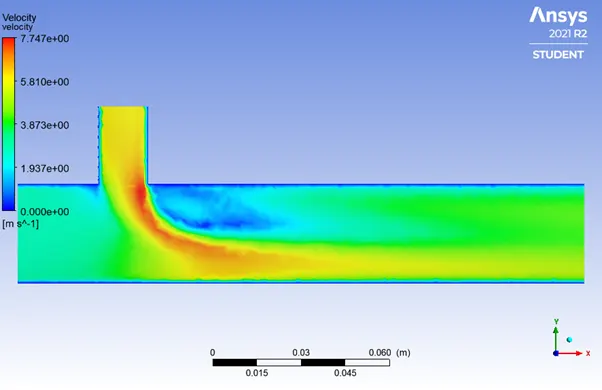
Different velocity contour
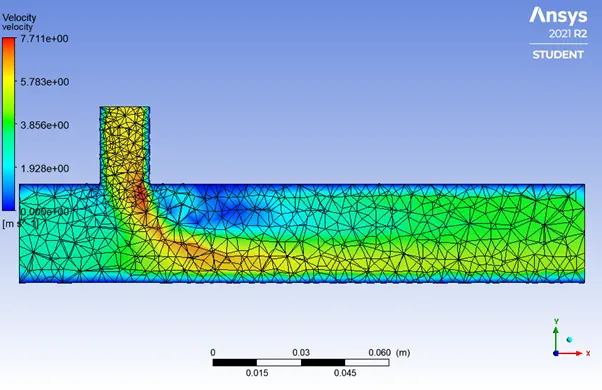
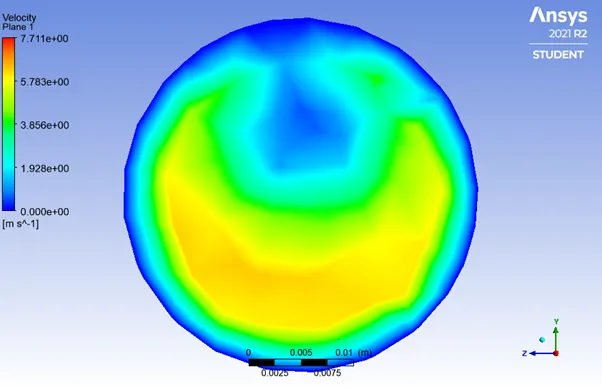
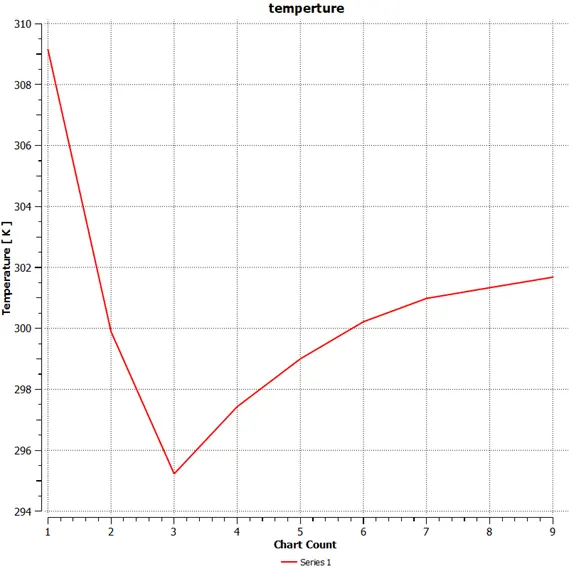
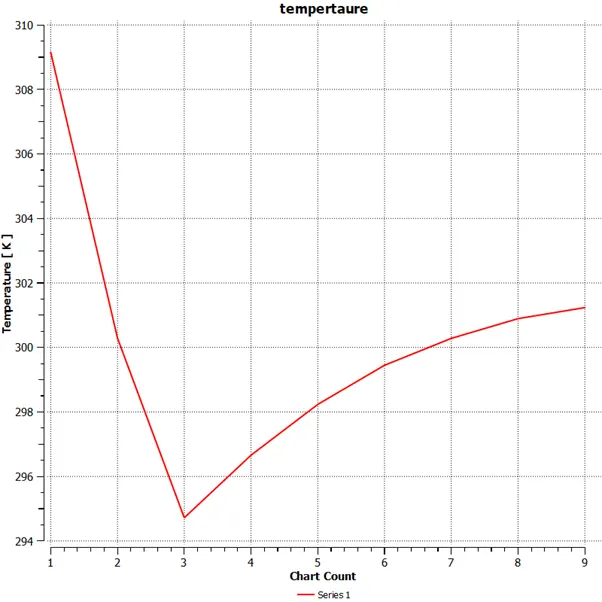
Temperture chart (chart count Vs temperture in K)
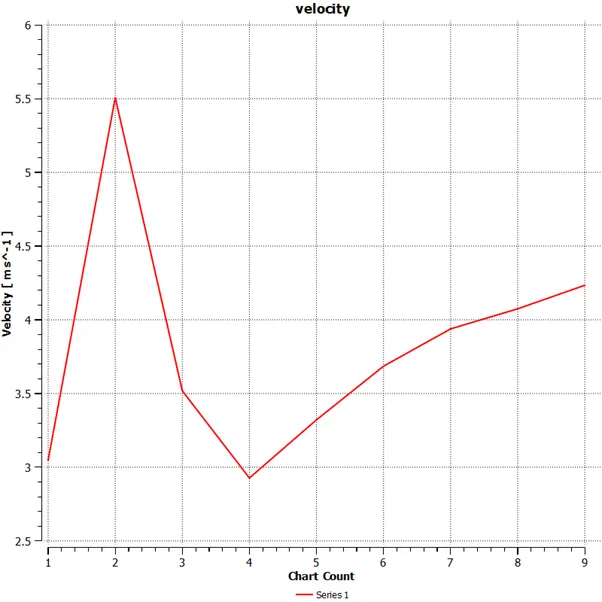
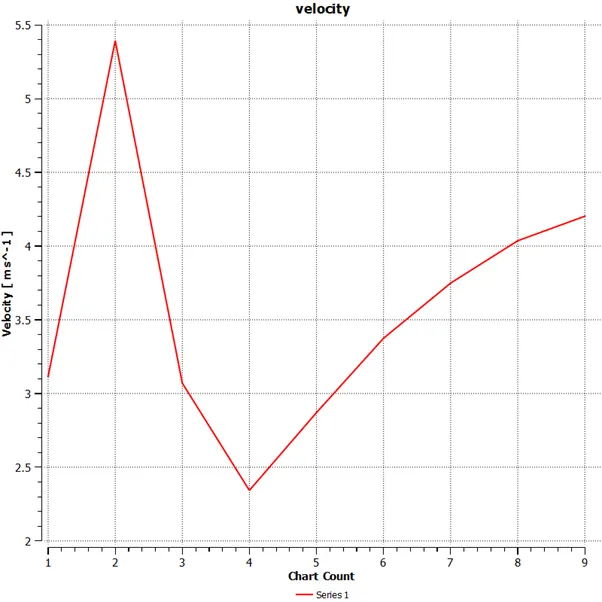
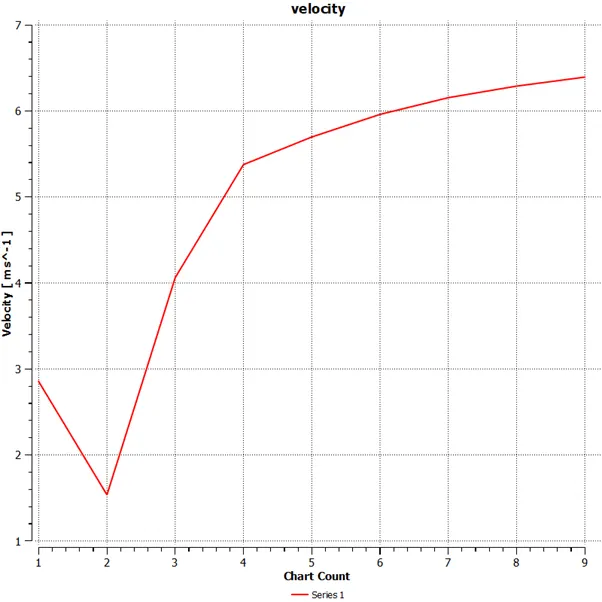
Velocity Chart (chart count vs velocity in m/s)
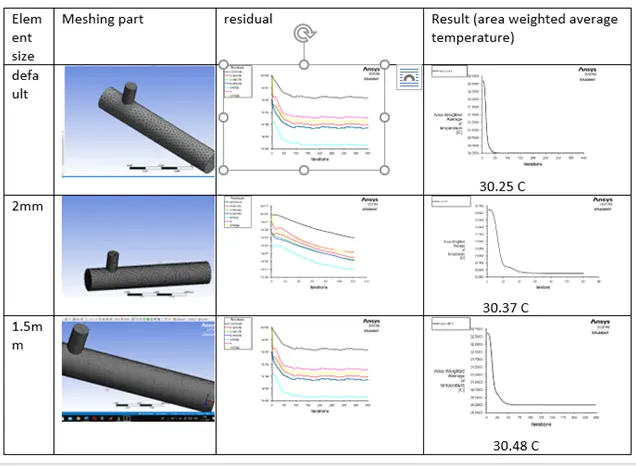
Independent Mesh test (grid test)-
Independent Mesh test means needs to perform a simulation by varying element size in and around the object. Mesh independent test does not depend on the type of mesh it depends on element size. It is also called as grid independent test
Case A-short mixing tee
Hot inlet velocity-3m/s
Momentum ratio-2, 4
Sub case-A1(momentum Ratio=2): in that case we perform simulation with k-omega SST and k-epsilon turbulence model and decide one model for further Case
Main concept
- Area Weighted average- we can find the average value on a surface
- Standard Deviation- It is measure of the amount of variation of set of values
- Momentum Ratio- It is ratio velocity of cold inlet to the velocity of hot inlet
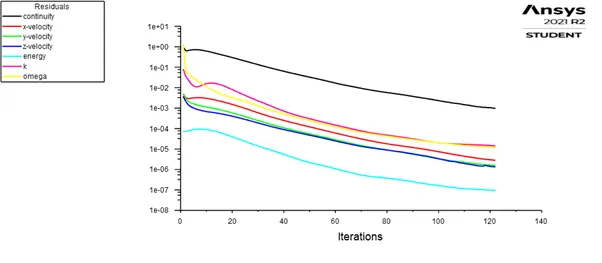
*AA1Short k-omega-SST (momentum ratio=2): Results obtained from K-omega SST model
Residual plot
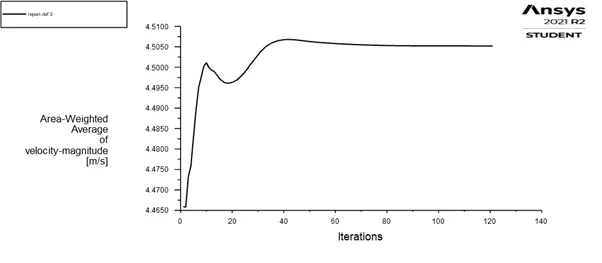
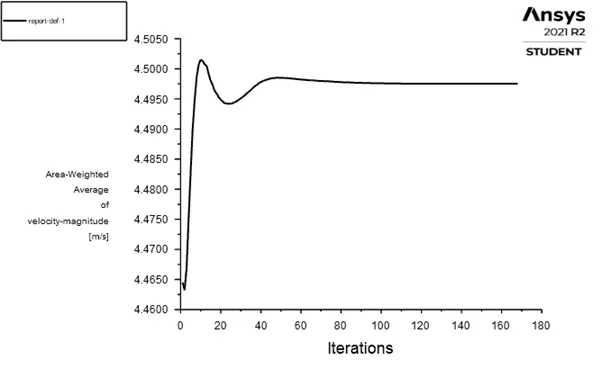
Area Weighted Average of velocity Magnitude
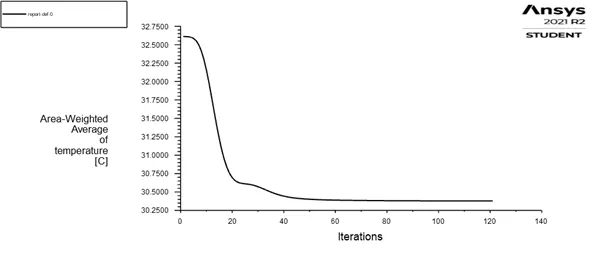
Area Weighted Average of temperature
Standard deviation of temperature
Different temperature contour
Different velocity contour
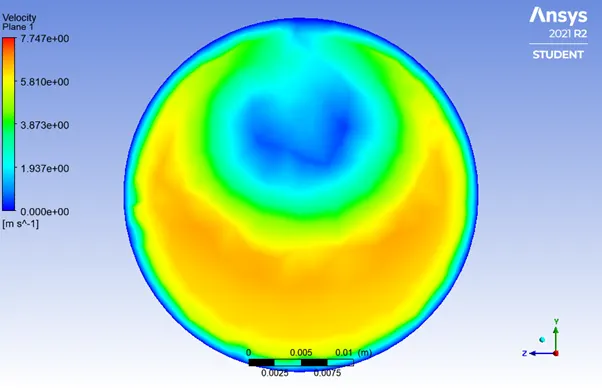
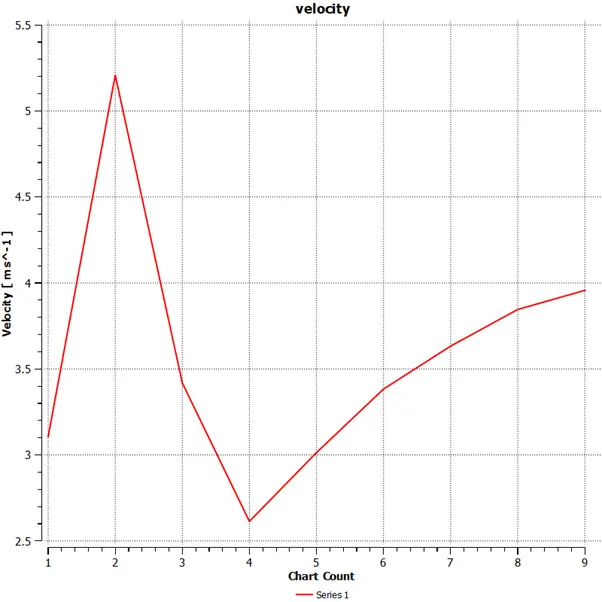
Velocity chart
Temperature chart
AA2*Short k-epsilon (momentum ratio=2)
Residual plot
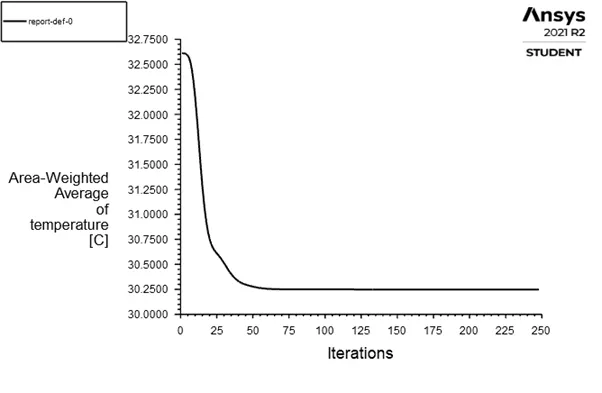
Area weighted Average of temperature
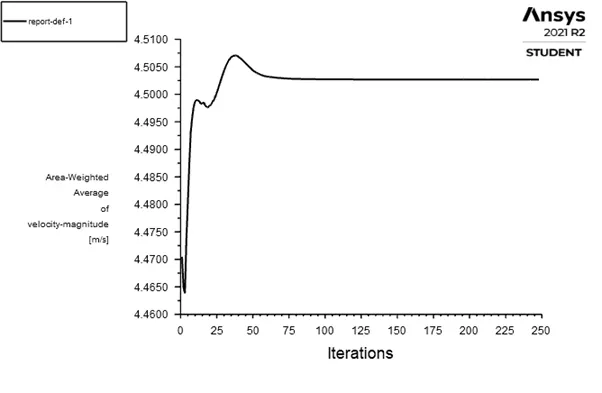
Area Weighted Average of velocity Magnitude
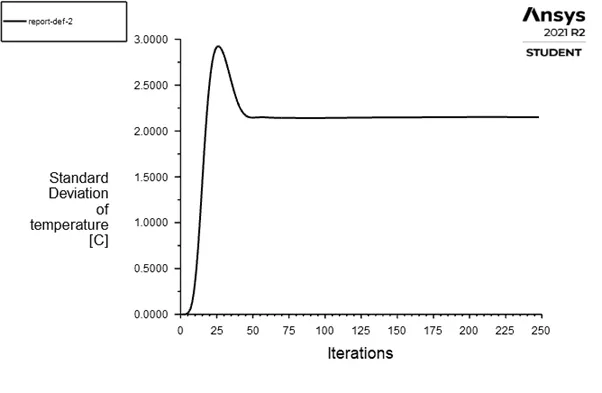
Standard Deviation of temperature
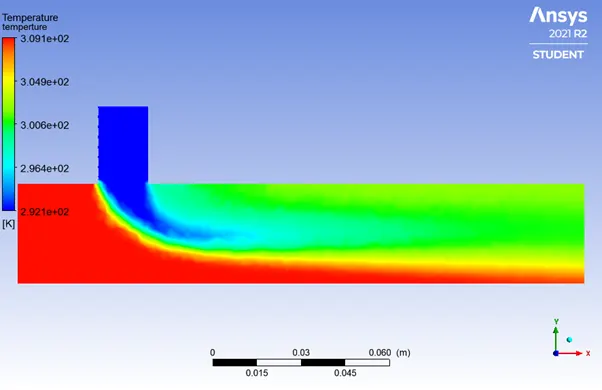
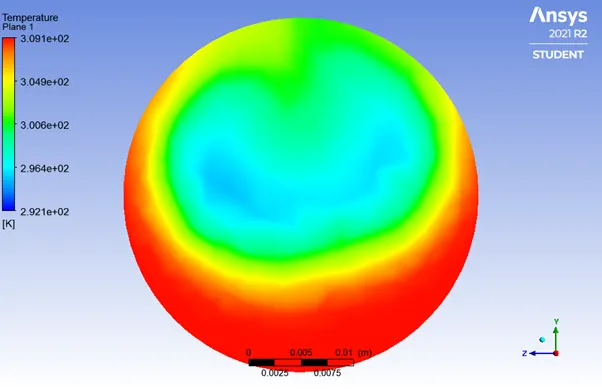
Different temperature contour
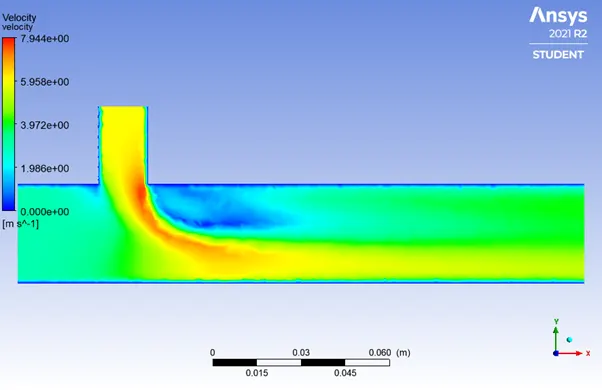
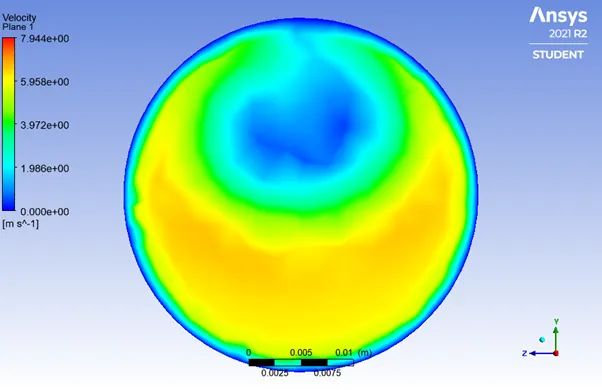
Different velocity contour
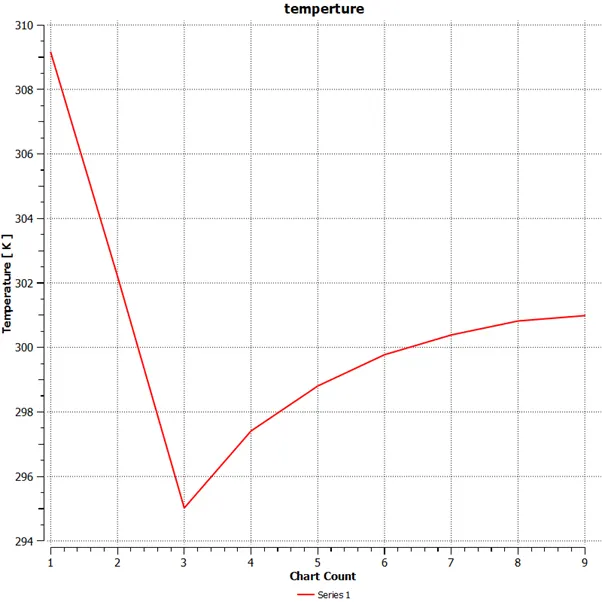
Temperature chart
Velocity chart
Decide a one turbulence model for further simulations
- k-epsilon turbulence model-is best suited for flow away from the body (free surface flow region)
- K-omega best suited for near the wall flow region where the adverse pressure gradient developed
- K-omega SST model predict better flow separation
- For momentum ratio 4 my result is not converged by k-epsilon turbulence model after 1000 iteration whereas k-omega SST model take less iteration (note I observe this during my simulation study)
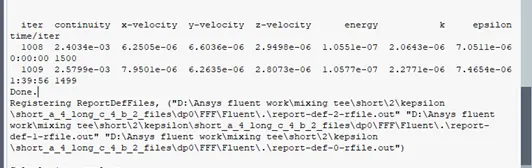
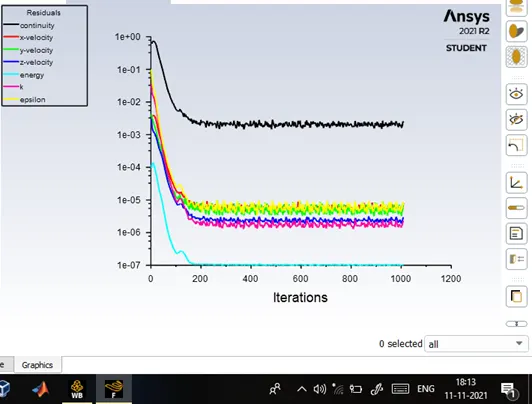
So consider all conditions and predictions I go for k-omega SST model for further simulation over k-epsilon
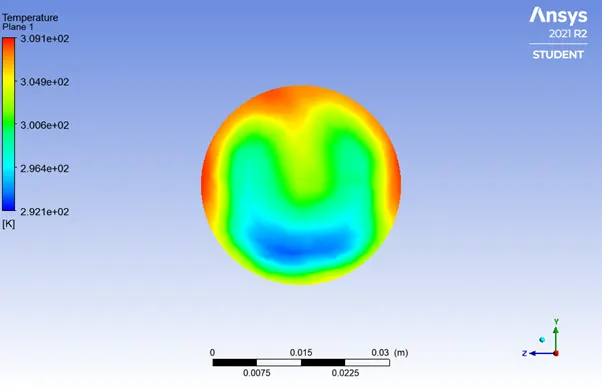
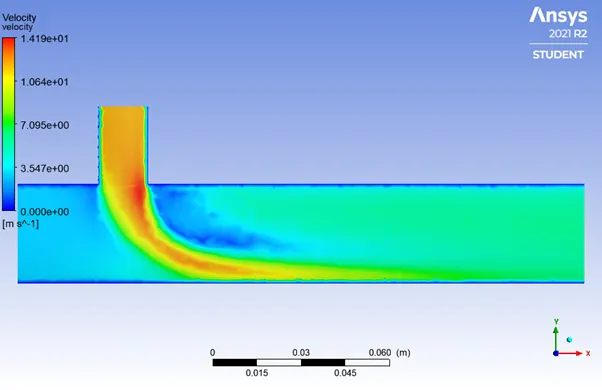
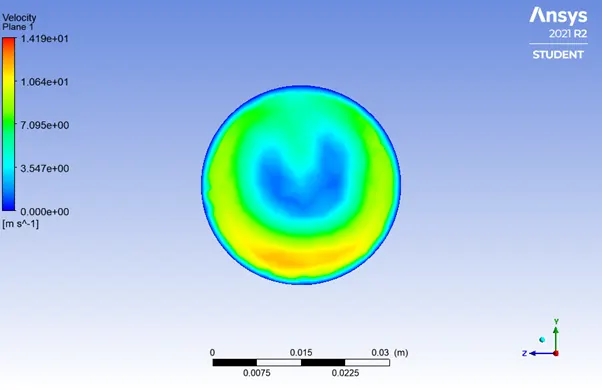
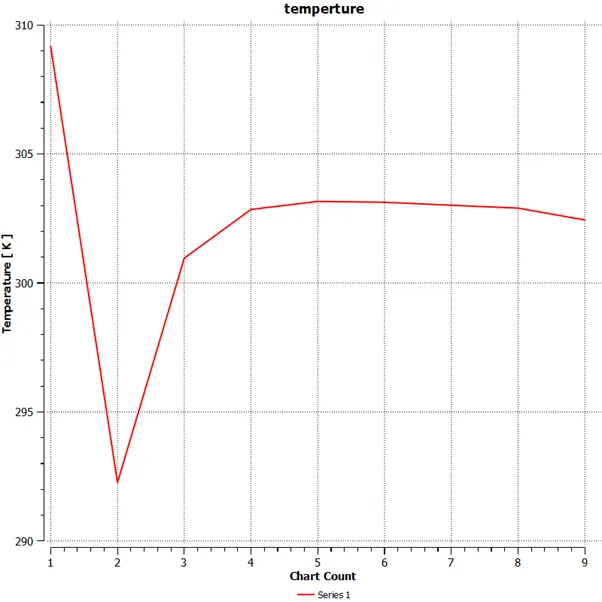
Case A2-Short k-omega-SST (momentum ratio=4)
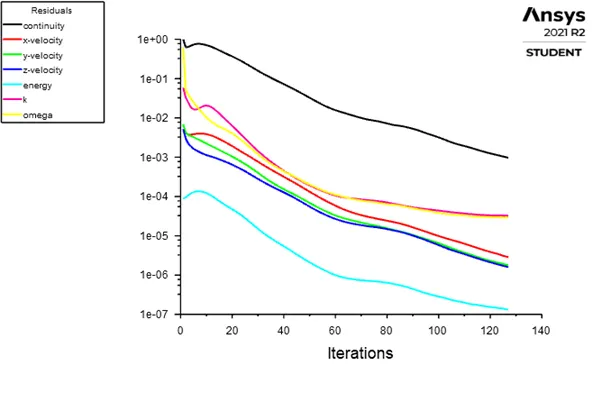
Residual plot
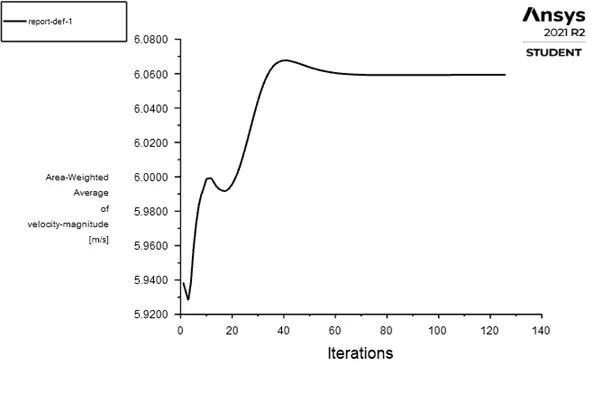
Area weighted Average of velocity Magnitude
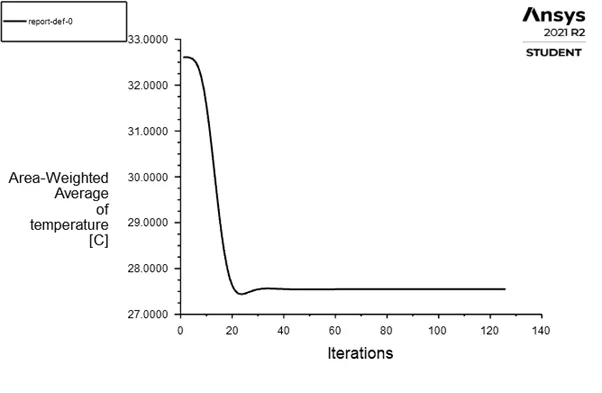
Area Weighted Average of temperature
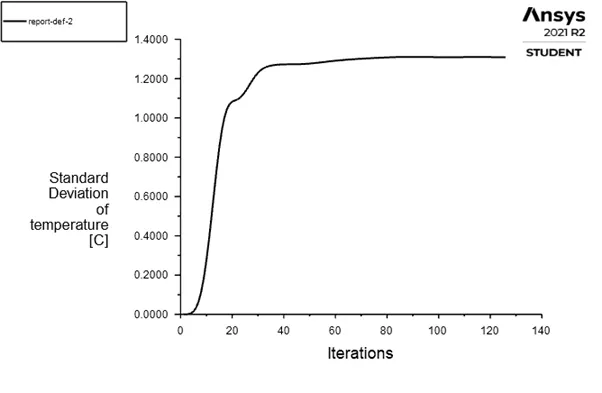
Standard deviation
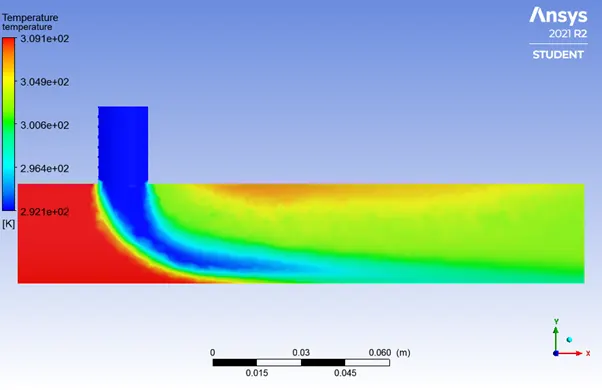
Different temperature contour
Different velocity contour
Temperature chart
Velocity Chart
Case B
B1 long k-omega-SST (momentum ratio=2)
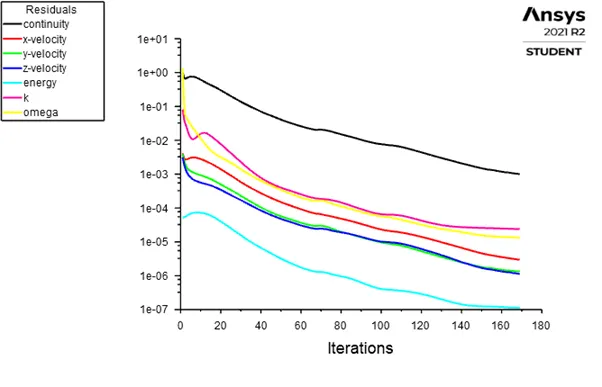
Residual plot
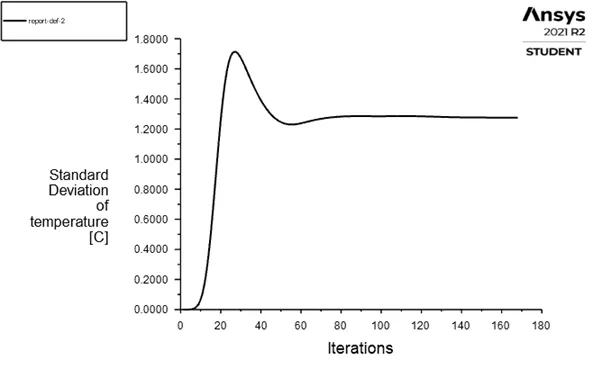
Standard deviation of temperature
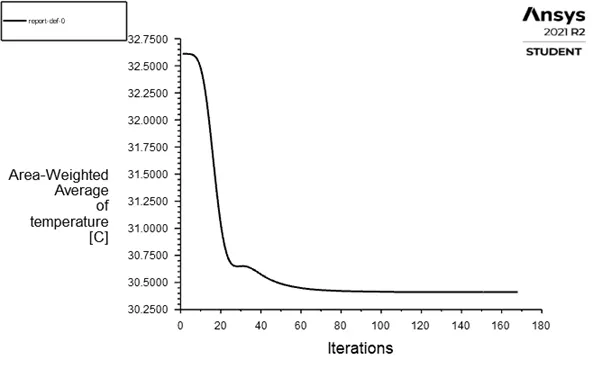
Area weighted Average of temperature
Area weighted Average of velocity magnitude
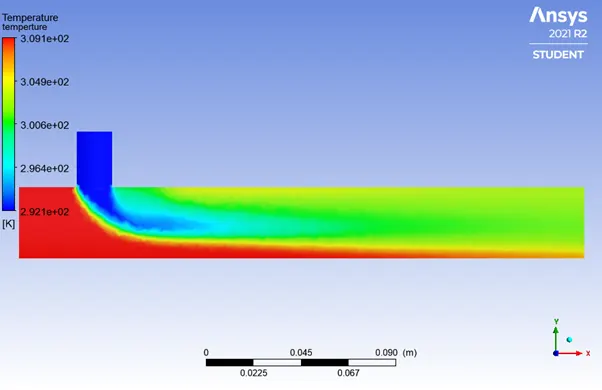
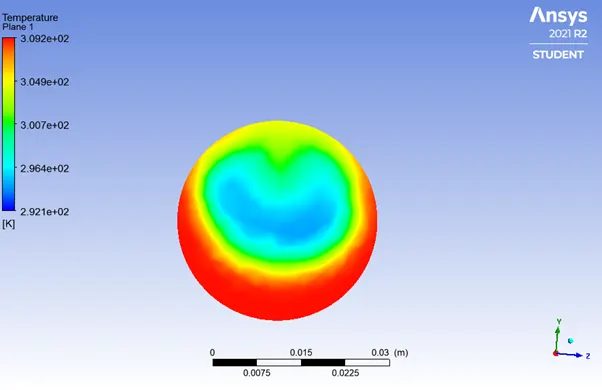
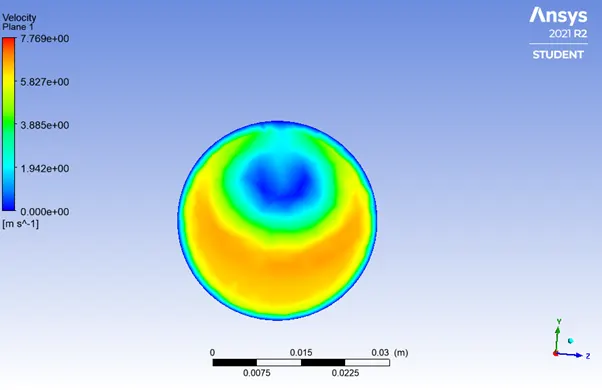
Different temperature contour
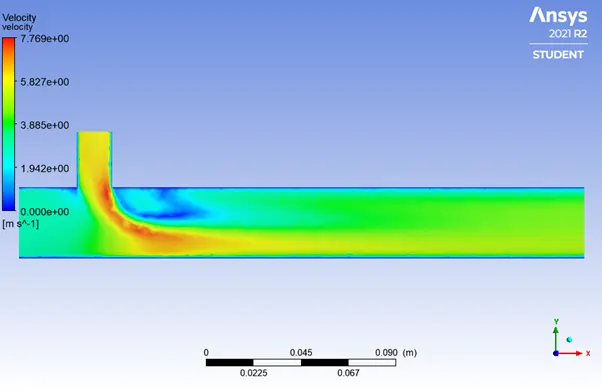
Different velocity Contour
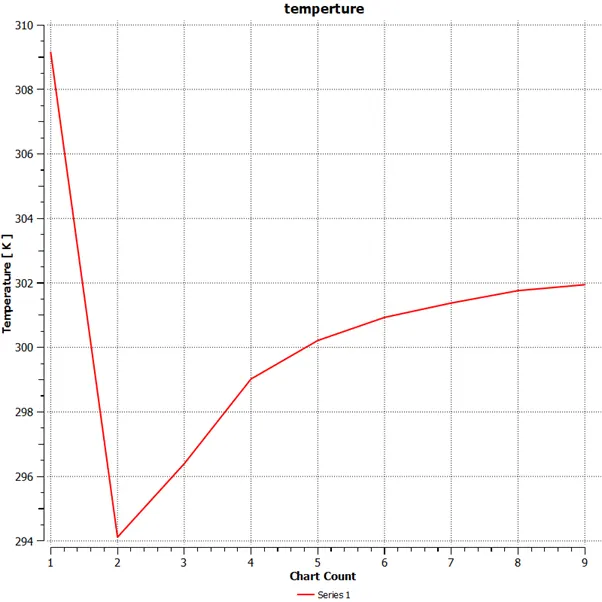
Temperature chart
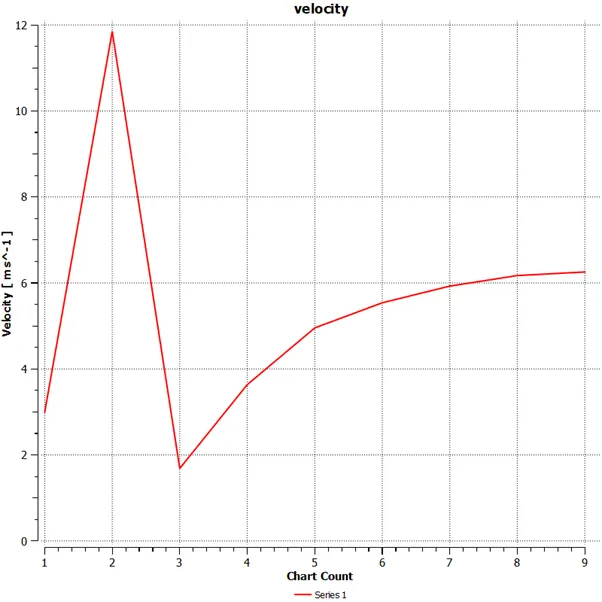
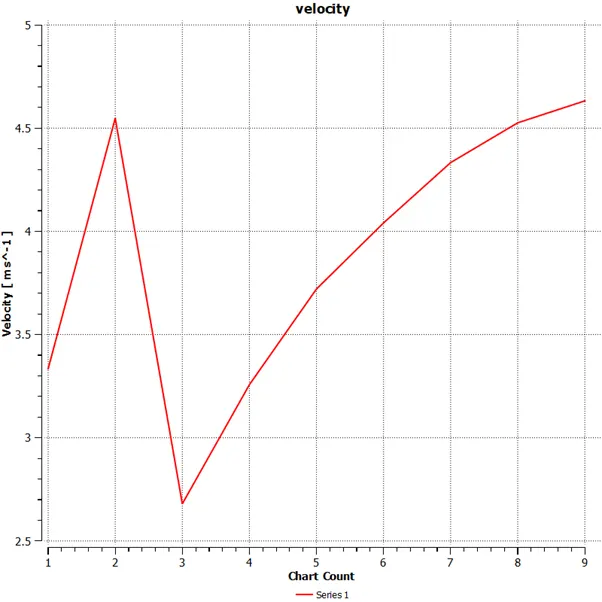
Velocity chart
B2-long k-omega-SST (momentum ratio=4)
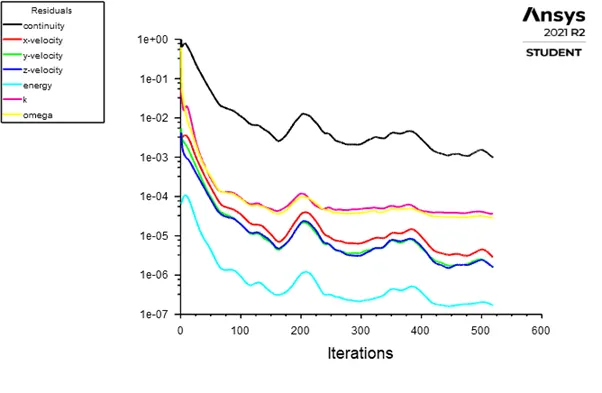
Residual plot
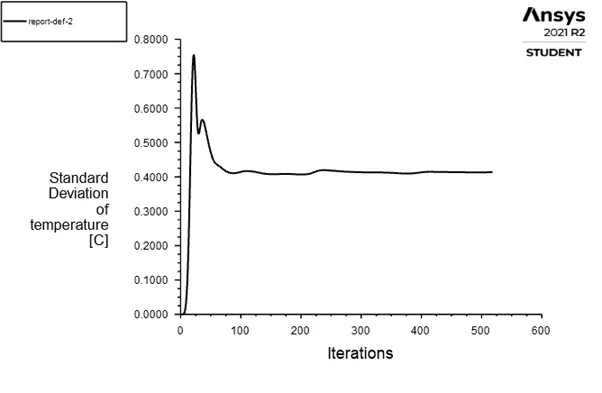
Standard Deviation of temperature
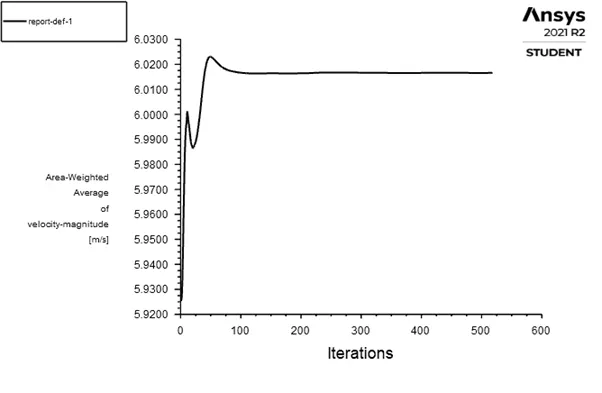
Area-Weighted Average of velocity Magnitude
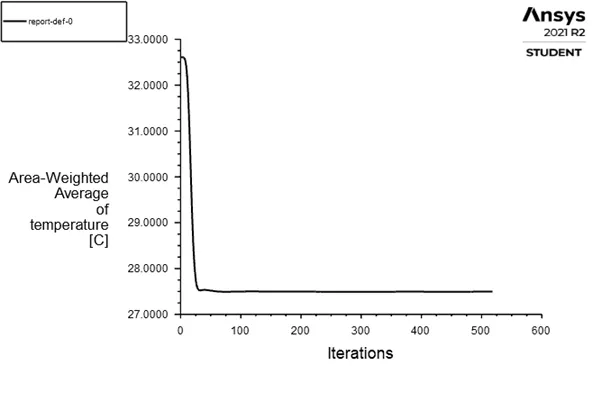
Area-Weighted Average of temperature
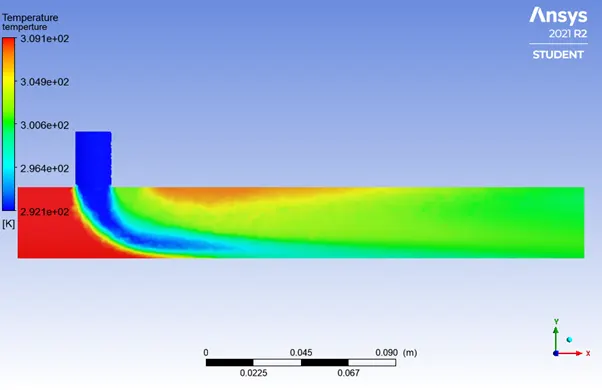
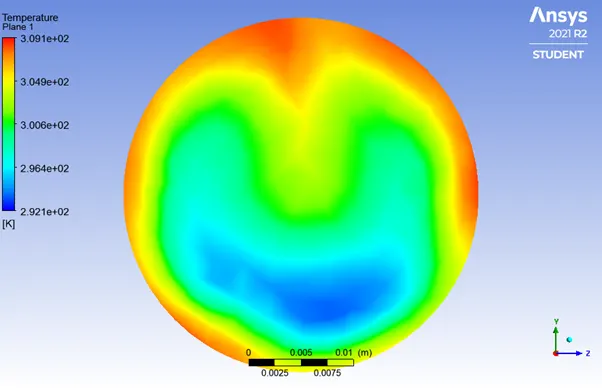
Different temperature contour
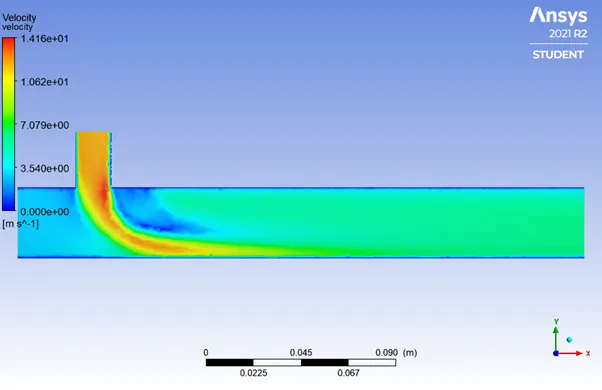
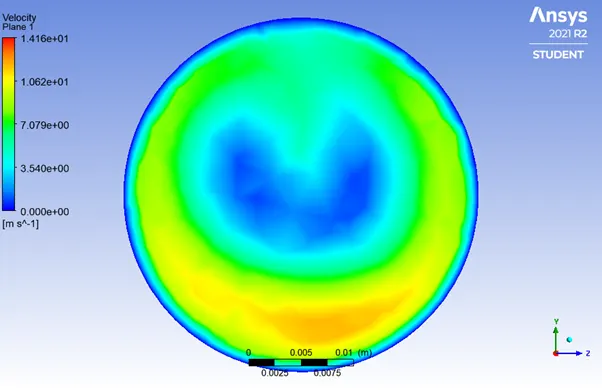
Different velocity counter
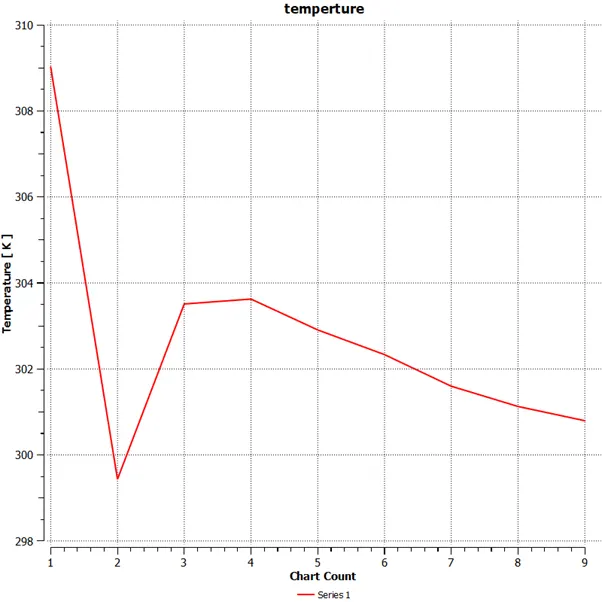
Temperature chart
Velocity chart
Validation study
I do validation study for short mixing tee with momentum ratio 2
We have, formula

Where
mhot=mass flow rate of hot air
mcold= mass flow rate of cold air
Thot=temperature of hot air
Tcold= temperature of cold air
Tmixture=temperature of mixed air
Rho=density of air=1.225kg/m^3
We know that
m=rho*area*velocity
how we find projected surface area
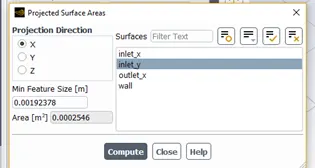
hence,
mhot=1.225*0.009*3=0.0033075kg/s
mcold=1.225*0.002*6=0.00147kg/s
Thot=36 degree Celsius
Tcold =19 degree Celsius
after putting all above value, we get,
Tmix=30.77 degree Celsius
30.37 degree Celsius ((k-omega SST turbulence model))
30.24 degree Celsius (k-epsilon realizable turbulence model)
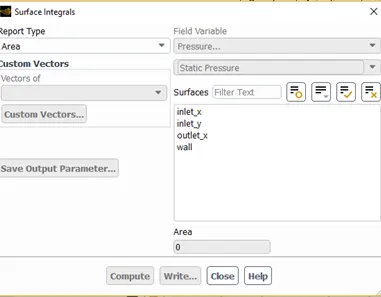
How we find your area weighted Average temperature value and velocity Magnitude
Results and Conclusions-
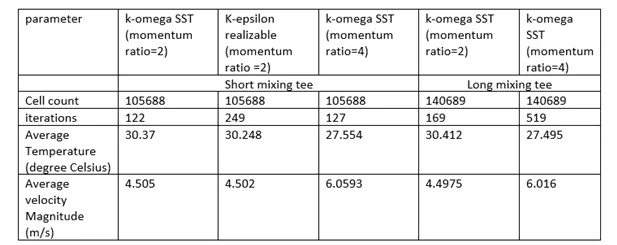
Comparison table
Conclusion
- The temperature at outlet drops significantly due to high velocity of cold air and this is possible to turbulent mixing at the tee between hot air and cold air
- Comparing above table value we say that long mixing tee has less average temperature as well average velocity magnitude respect to short mixing tee
- We have low standard deviation of long mixing tee compare to short mixing tee