Week 1- Mixing Tee
Abstract: In this simulation a mixing tee case is used and a comparison is made with varying the momentum ratios , varying the tee length , varying the turbulence models and also varying the grid size. And it is observed that the kOmegaSST turbulence model gives a better result which is closer to the analytical solution.
Introduction : The mixing tee has many uses, in the present case the mixing tee is connected to cold air of 19 deg C coming from a air conditioning outlet mixed with a hot air or air from the sorrounding which are at typically at 36 deg C , and the final temperature analytically is found by the relation is 27.5 deg C .In this simulation we primarily checked which turbulence models would best suited for our mixing Tee and later , we have later conducted a mesh independent test by comparing a coarse mesh and the fine mesh and observed the finer mesh portrayed the results in a manner where we can observe the turbulence. A longer tee is also used and by varying the momentum ratio from 3 to 4 the results were obtained and compared the same with short tee , these values for all the cases were tabulated below
|
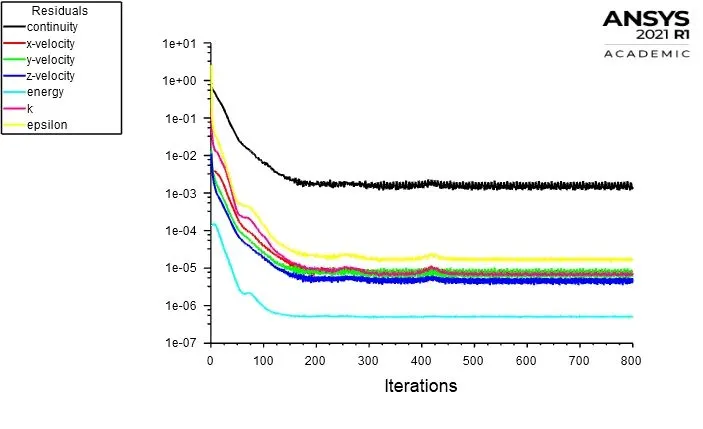
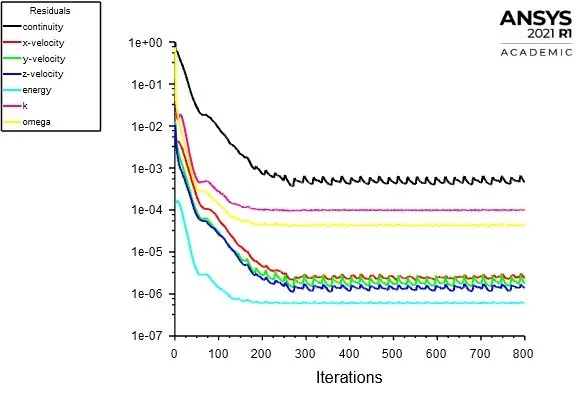
in the above table if we compared the short Tee with turbulence models kOmegaSST with kEpsilon its seen that the last known residual after the same number of iterations , is shorter in the case of SST , and it is also observed that for same number of elements the final outlet temperature is higher than the KomedaSST ,which is closer to the analytical solution, Thus by taking this into consideration and also observing the residual plots we use komegaSST as an ideal turbulence model for this case .
Residuals for Kepsilon for Short-TEE momentum ratio 2 Residuals for KomegaSST for Short-TEE momentum ratio 2
Standard Deviation for Kepsilon for Short-TEE momentum ratio 2 Residuals for KomegaSST for Short-TEE momentum ratio 2
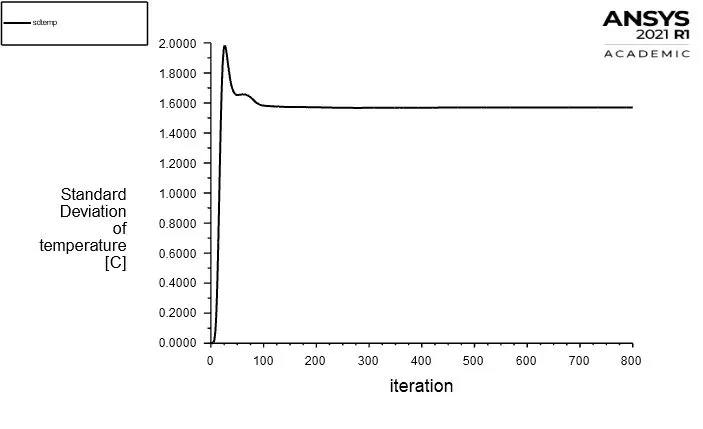
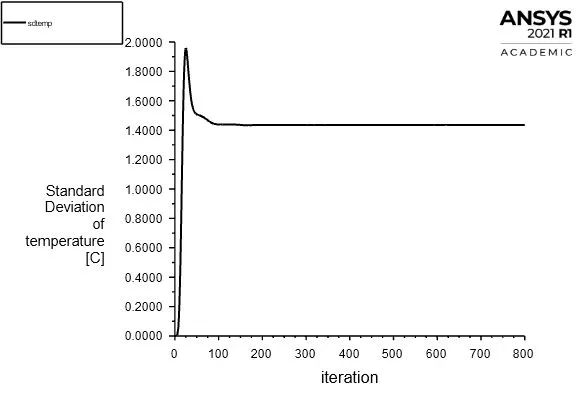
By comparing the above two Standard deviation of the of the outlet it is seen that the lesser Standard deviation is for kOmegaSST hence that would be a suitable model for our case
Outlet Temperature for Kepsilon for Short-TEE momentum ratio 2 Outlet Temperature for KOmegaSST for Short-TEE momentum ratio 2
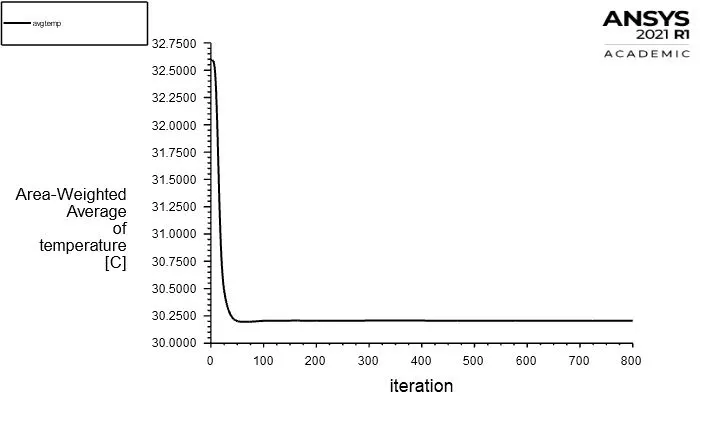
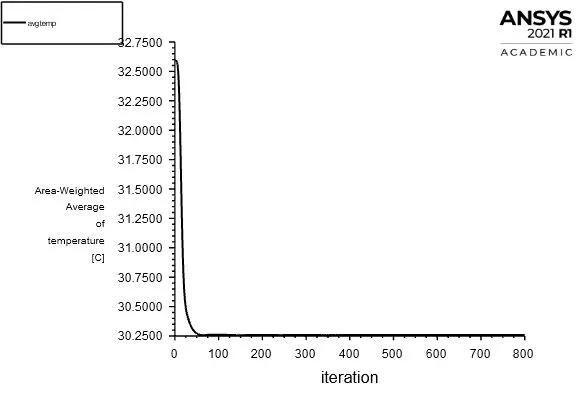
average temperature at the outlet in the case of kepsilon in 30.40 whereas for the kOmegaSST it is 30.25 which is slightly lesser than the latter , hence we can say that the mixing is improved and due to this temperature is dropped
average temperature at the outlet in the case of kepsilon in 30.40 whereas for the kOmegaSST it is 30.25 which is slightly lesser than the latter , hence we can say that the mixing is improved and due to this temperature is dropped.
Comparison of the Temperature contour along the length wise using KomegaSST model with varying momentum ratio and finer mesh
Momentum ratio 2 coarse mesh Momentum ratio 2 finer mesh
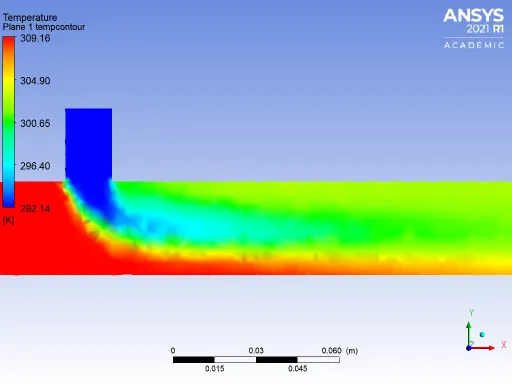
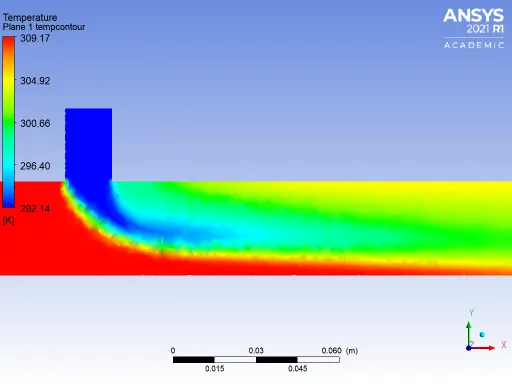
Momentum ratio 4 coarse mesh Momentum ratio 4 finer mesh
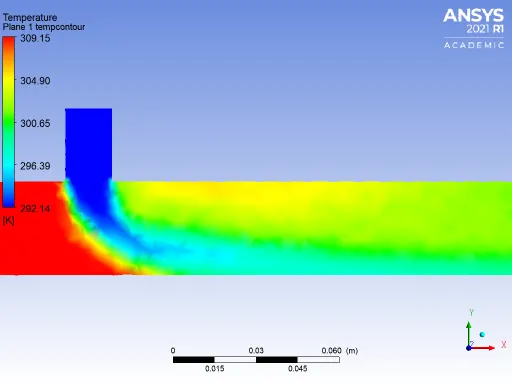
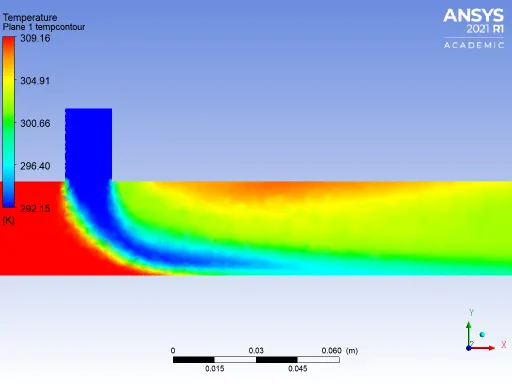
Comparison of the Velocity contour along the length wise using KomegaSST model with varying momentum ratio and finer mesh
Momentum ratio 2 coarse mesh Momentum ratio 2 finer mesh
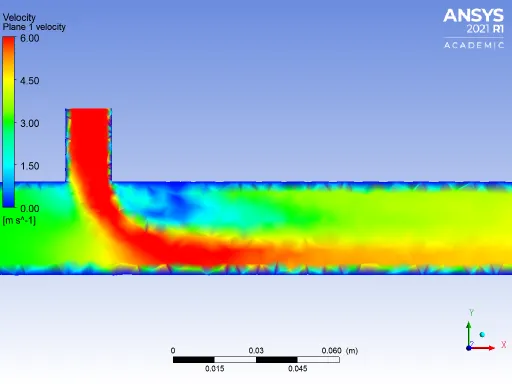
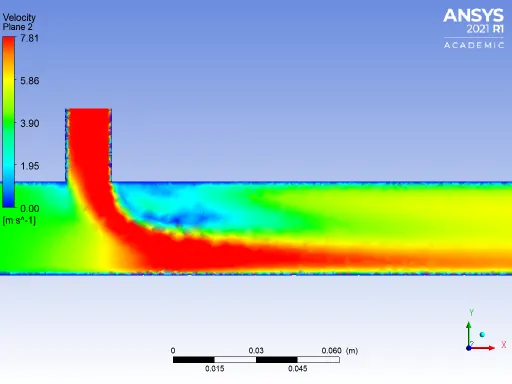
Momentum ratio 4 coarse mesh Momentum ratio 4 finer mesh
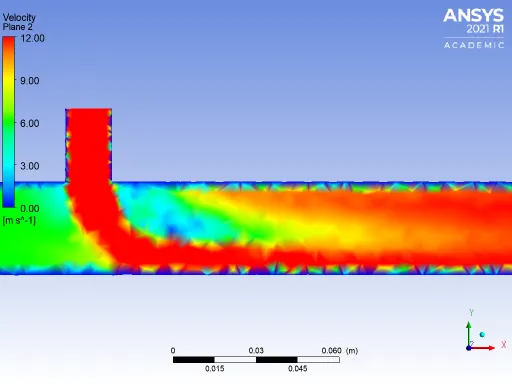
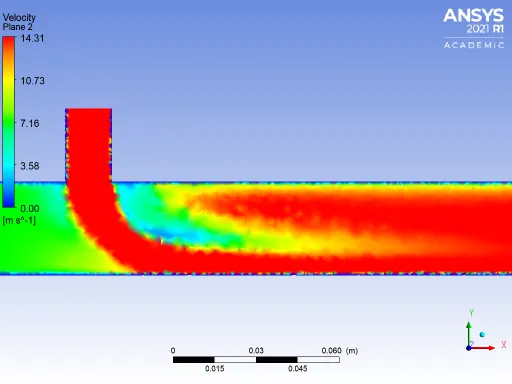
Comparison of the Temperature contour along the cut section using KomegaSST model with varying momentum ratio and finer mesh
Momentum ratio 2 coarse mesh Momentum ratio 2 finer mesh
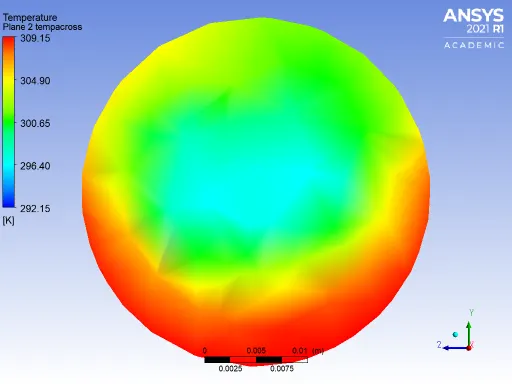
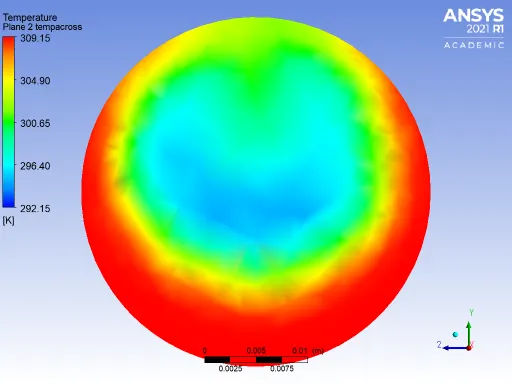
Momentum ratio 4 coarse mesh Momentum ratio 4 finer mesh
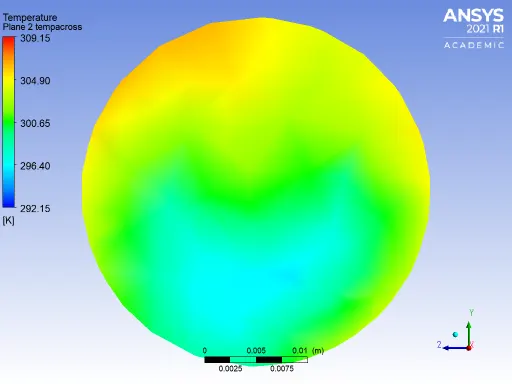
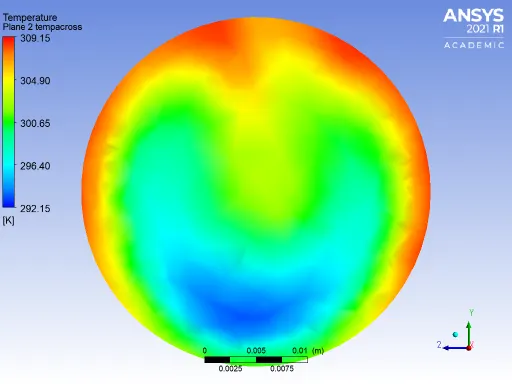
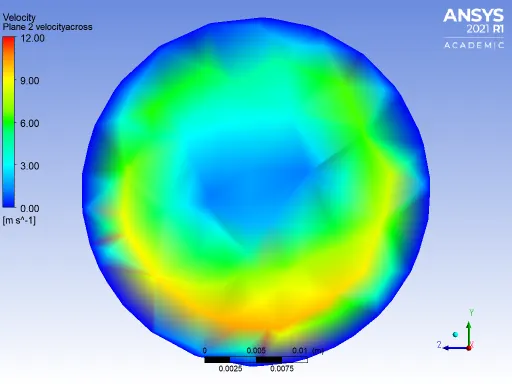
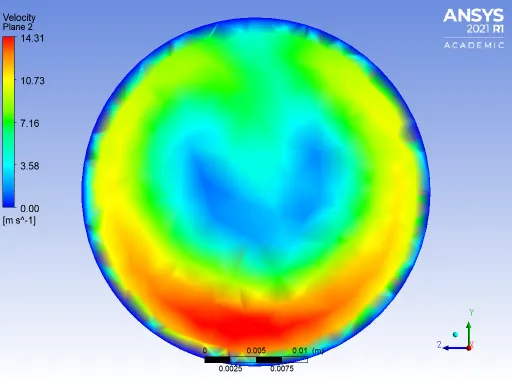
Comparison of the Velocity contour along the length wise using KomegaSST model with varying momentum ratio and finer mesh
Momentum ratio 2 coarse mesh Momentum ratio 2 finer mesh
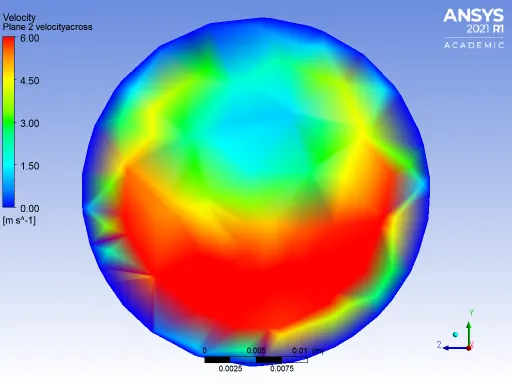
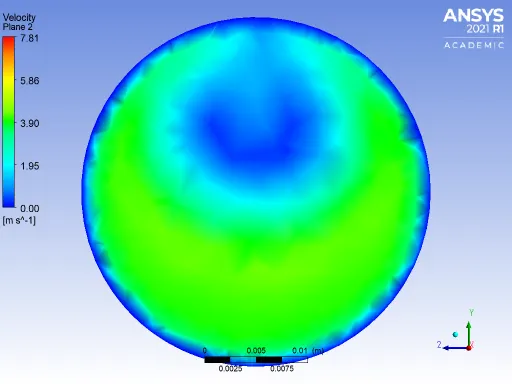
Momentum ratio 4 coarse mesh Momentum ratio 4 finer mesh
Comparison of the Temperature profile along the length wise using KomegaSST model with varying momentum ratio and finer mesh
Momentum ratio 2 coarse mesh Momentum ratio 2 finer mesh
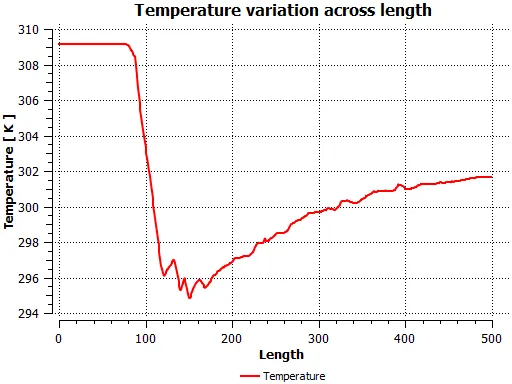
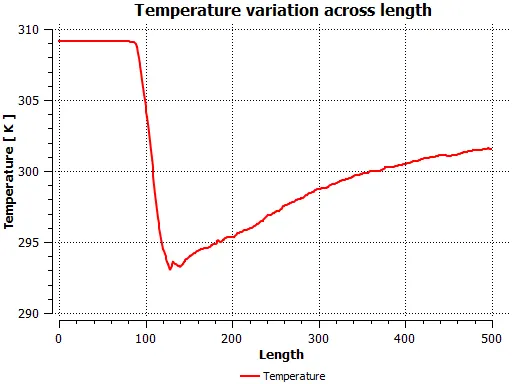
Momentum ratio 4 coarse mesh Momentum ratio 4 finer mesh
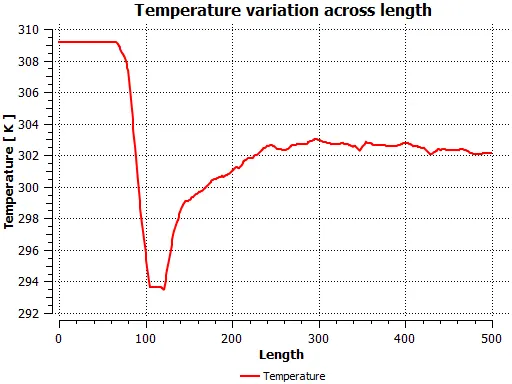
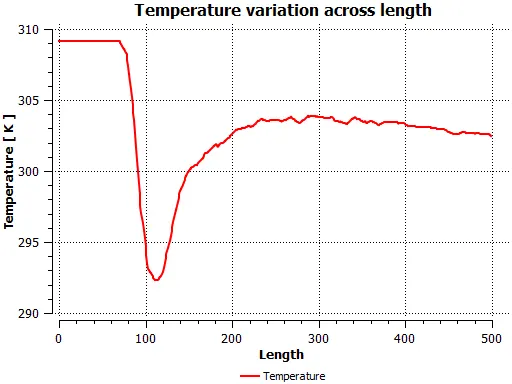
Comparison of the Velocity profile along the length wise using KomegaSST model with varying momentum ratio and finer mesh
Momentum ratio 2 coarse mesh Momentum ratio 2 finer mesh
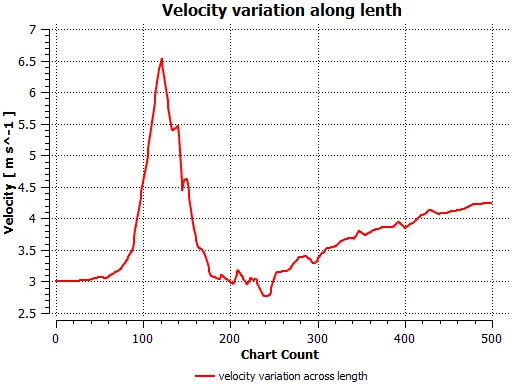
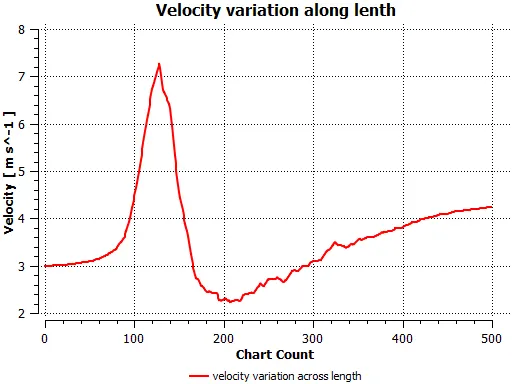
Momentum ratio 4 coarse mesh Momentum ratio 4 finer mesh
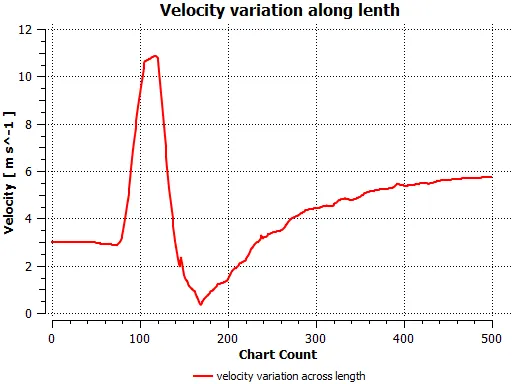
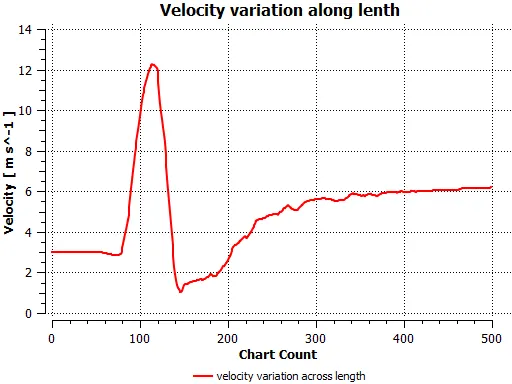
it is observed in the above figures the diffusion effects due to the coarse mesh is reduced by using an finer mesh .
Comparison of a Longer Tee with shorter Tee
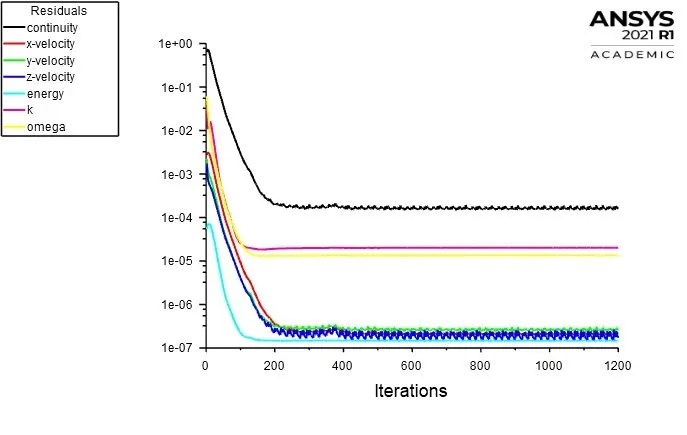
Residuals of Longer Tee with momentum ratio 2
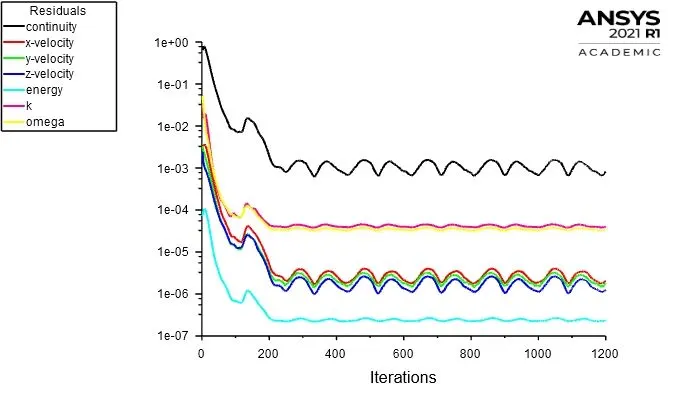
Residuals of Longer Tee with momentum ratio 4
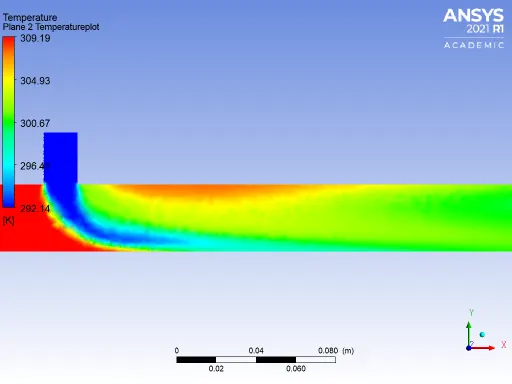
Temperature contour along the length
Longer Tee momentum ratio 2 Shorter Tee momentum ratio 2
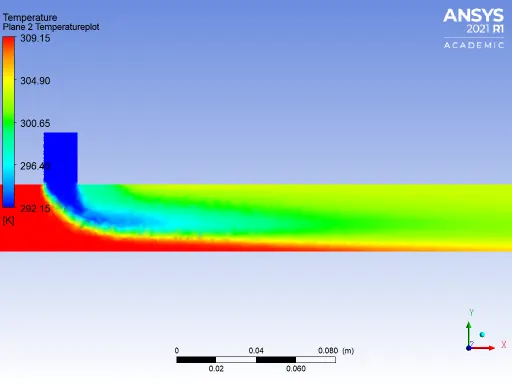
Longer Tee momentum ratio 4 Shorter Tee momentum ratio 4
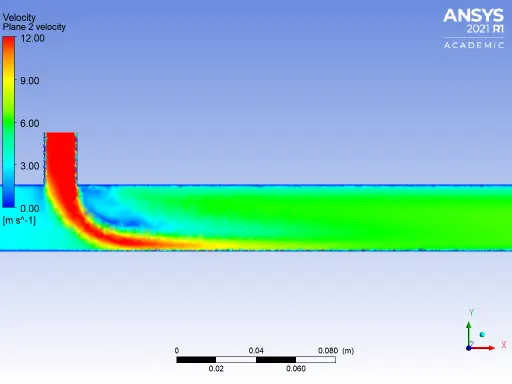
Velocity contour along the length
Longer Tee momentum ratio 2 Shorter Tee momentum ratio 2
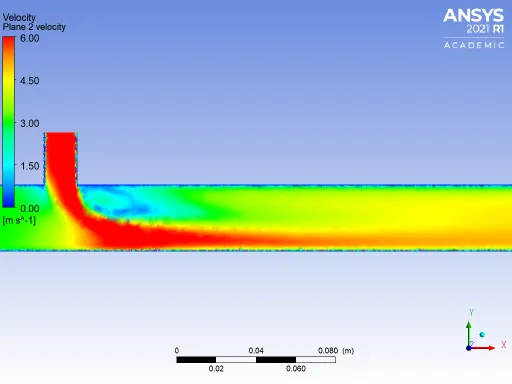
Longer Tee momentum ratio 4 Shorter Tee momentum ratio 4
Velocity contour across the pipe
Longer Tee momentum ratio 2 Shorter Tee momentum ratio 2
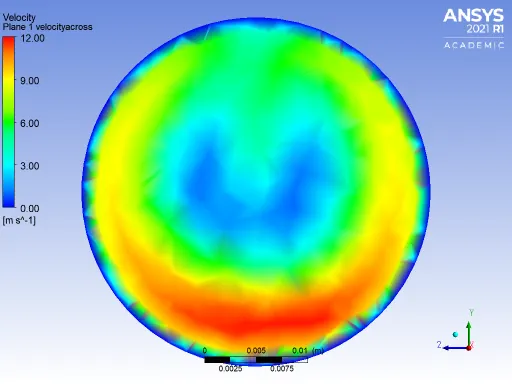
Longer Tee momentum ratio 4 Shorter Tee momentum ratio 4
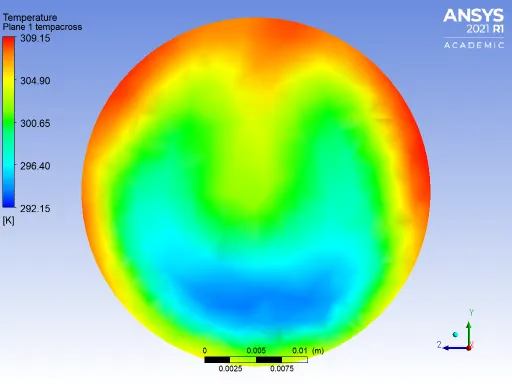
Temperature contour across the pipe
Longer Tee momentum ratio 2 Shorter Tee momentum ratio 2
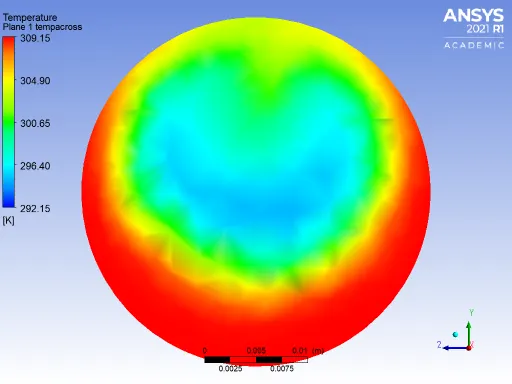
Longer Tee momentum ratio 4 Shorter Tee momentum ratio 4
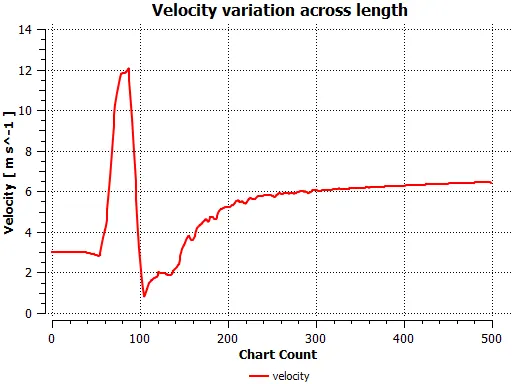
Comparison of the Velocity profile along the length wise using Longer tee with varying momentum ratio
Longer Tee momentum ratio 2 Shorter Tee momentum ratio 2
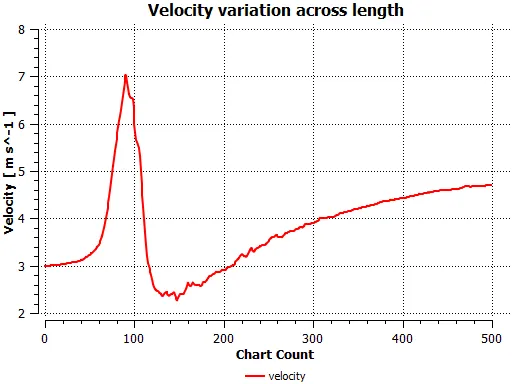
Longer Tee momentum ratio 4 Shorter Tee momentum ratio 4
Comparison of the Temperature profile along the length wise using Longer tee with varying momentum ratio
Longer Tee momentum ratio 2 Shorter Tee momentum ratio 2
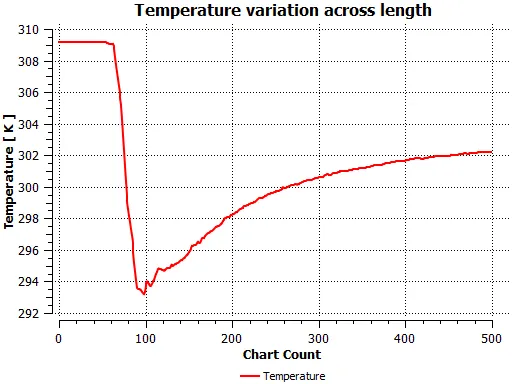
Longer Tee momentum ratio 4 Shorter Tee momentum ratio 4
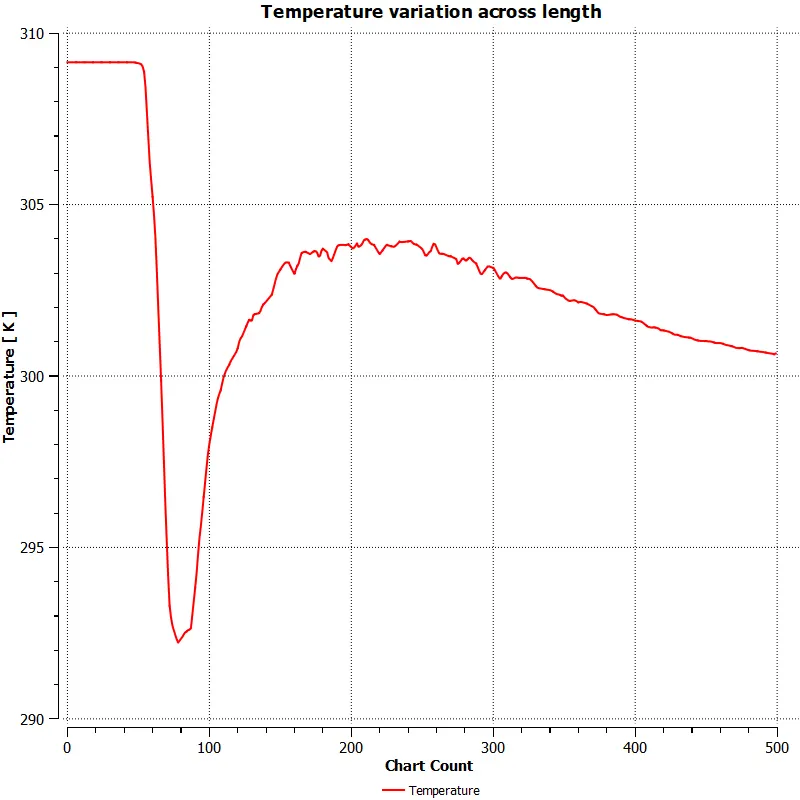
From the above profiles it is observed that the longer tee is not suitable for our case , and shorter tee produced better results and values closer to analytical values