Week 1: Channel flow simulation using CONVERGE CFD
# Channel flow Simulation using Converge CFD
- We need to simulation in 3 different cases and compare with each other, thats are given as follows.
Case 1 (dx = 2e-4m, dy = 2e-4m, dz = 2e-4m).
Case 2 ( dx = 1.5e-4m, dy = 1.5e-4m, dz = 1.5e-4m).
Case 3 ( dx = 1.0e-4m, dy = 1.0e-4m, dz = 1.0e-4m).
Geometry for Cases created in converge.
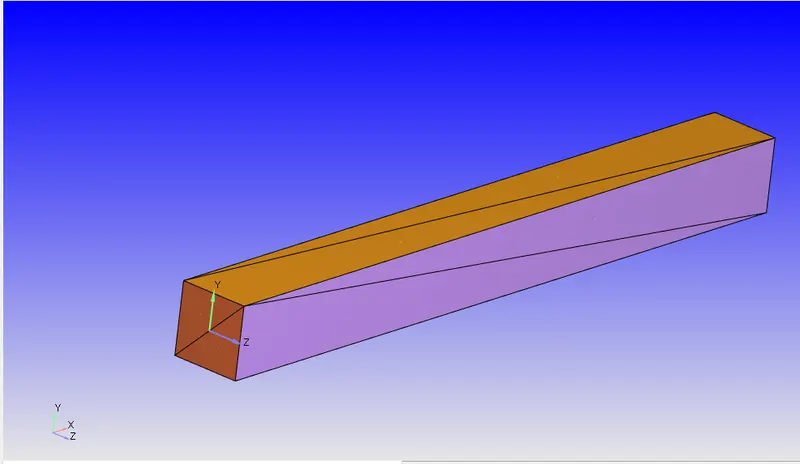
Case Setup in converge for geometry
Application Type
- Time Base flow / General type flow.
Material Type
- Air (Gas Simulation).
Simulation Parameters
- Run Parameters
1 Solver:- steady-state Solver.
2 Simulation Mode:- Fully hydrodynamic.
3 Gas flow solver:- Compressible
- Simulation time parameters
1 Start time = 0 cyc & End time = 15000 cyc
2 Initial time step = 1e-9 sec & final time step = 1e-9 sec
3 Maximum time step = 1 sec
4 Maximum convection CFL limit = 0.5
5 Maximum diffusion CFL limit = 2
- Solver parameters
1 Navior-Stokes solver schemes = PISO
2 Navior-Stokes solver tyape = Density based
Boundary Conditions
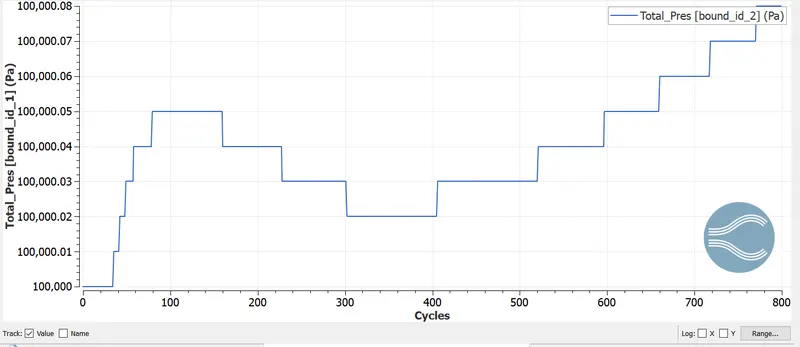
1 Inlet - INFLOW & Pressure -100001 Pa
2 Outlet - OUTFLOW & Pressure - 100000 Pa
3 Top & Bottom -No slip WALL
4 Front & Back - 2D
Initial Conditions & Events
1 Rigion and Initialization
2 Species (Air, O2 = 23%, N2 = 77%)
Boundaries are assigned to volumetric region.
at Temperature is 300K and Pressure is 100001 Pa
Case 1 gride size (dx = 2e-4m, dy = 2e-4m, dz = 2e-4m).
Mesh:
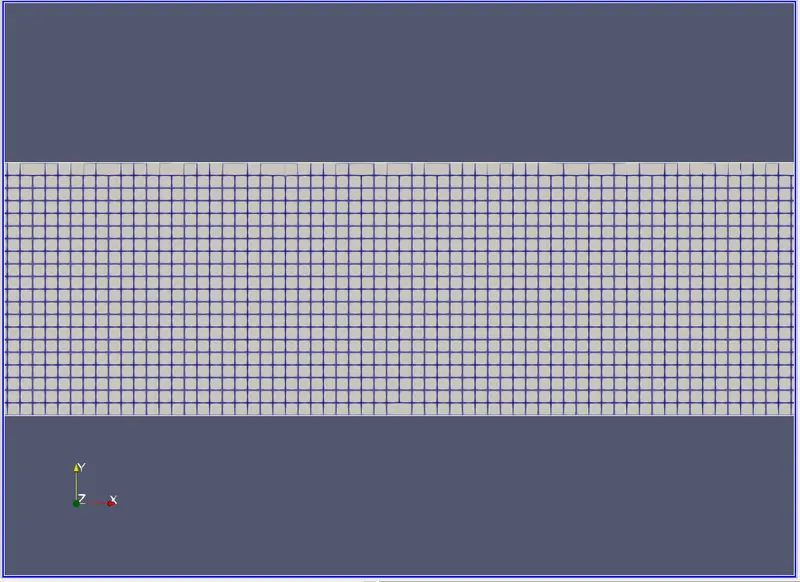
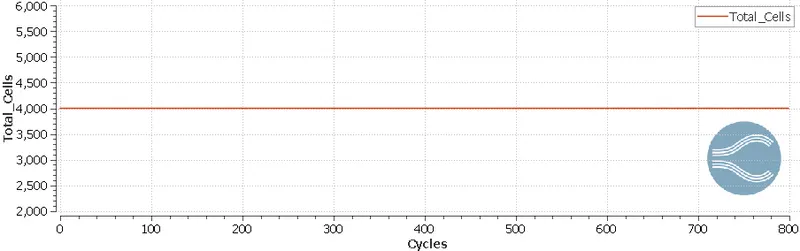
Total Cell Count: 4030
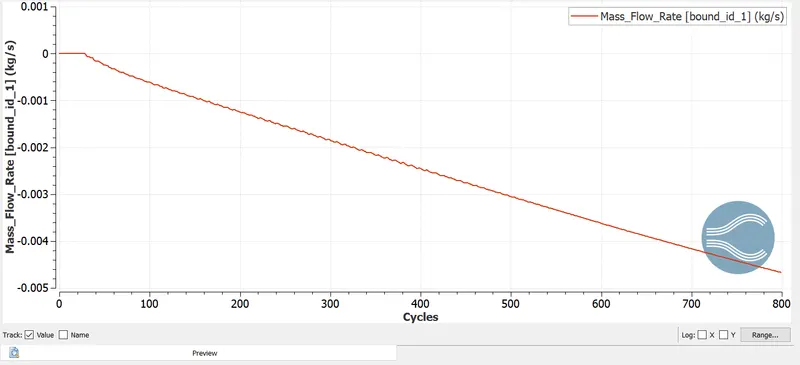
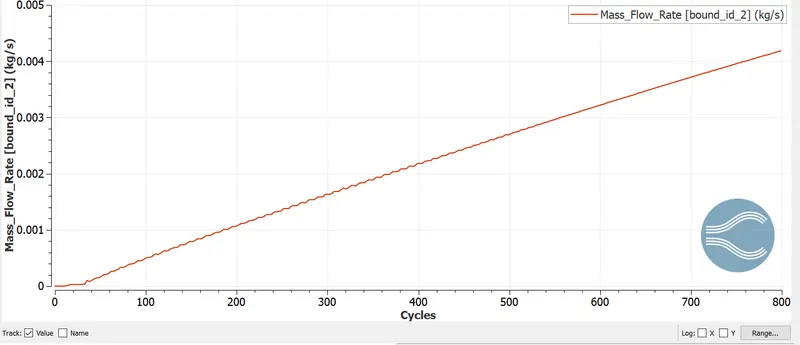
Mass flow rate at inlet:
Mass Flow rate at outlet:
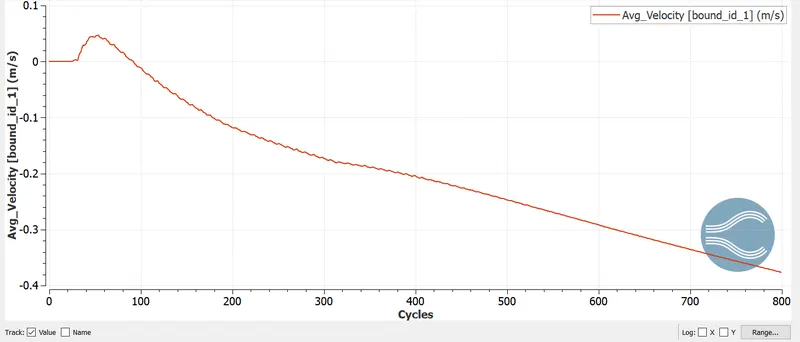
Velocity Plot at inlet:
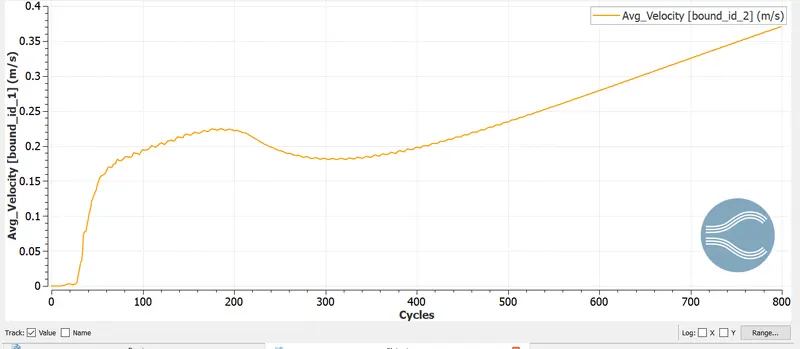
Velocity Plot at outlet:
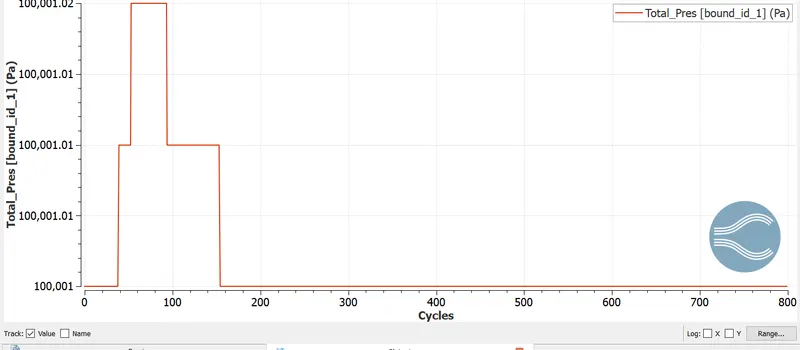
Prssure plot at Inlet:
Pressure plot at outlet:
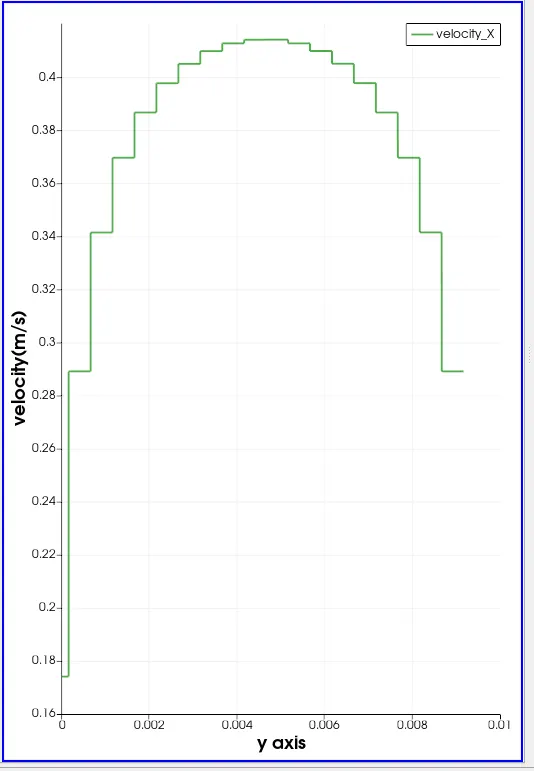
Velocity Profile at 0.5m from inlet
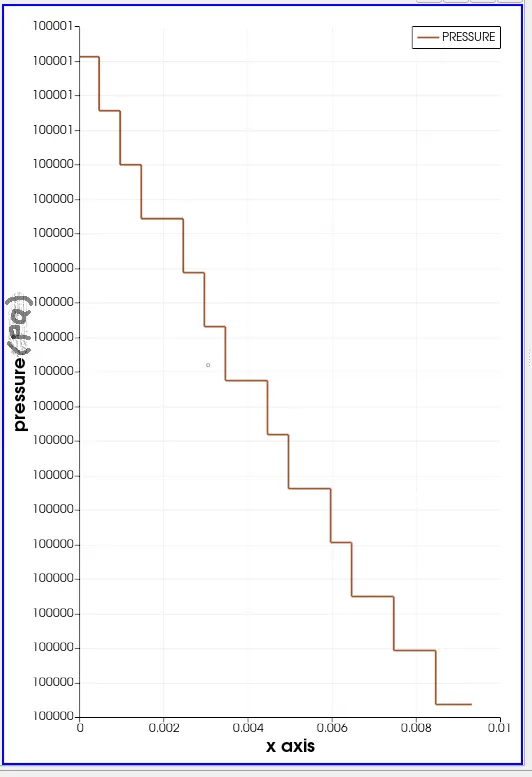
Pressure drop across length:
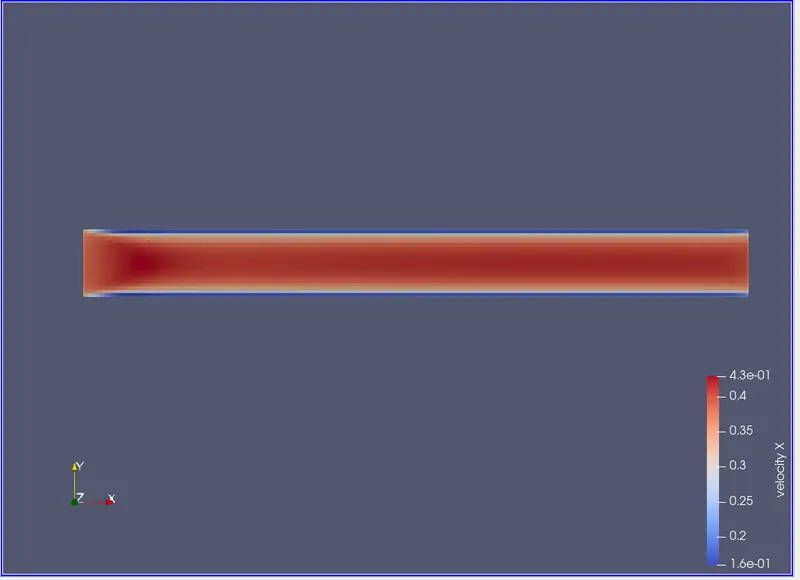
Result of first case in Paraview:
Velocity counter result:
Pressure Result in paraview:
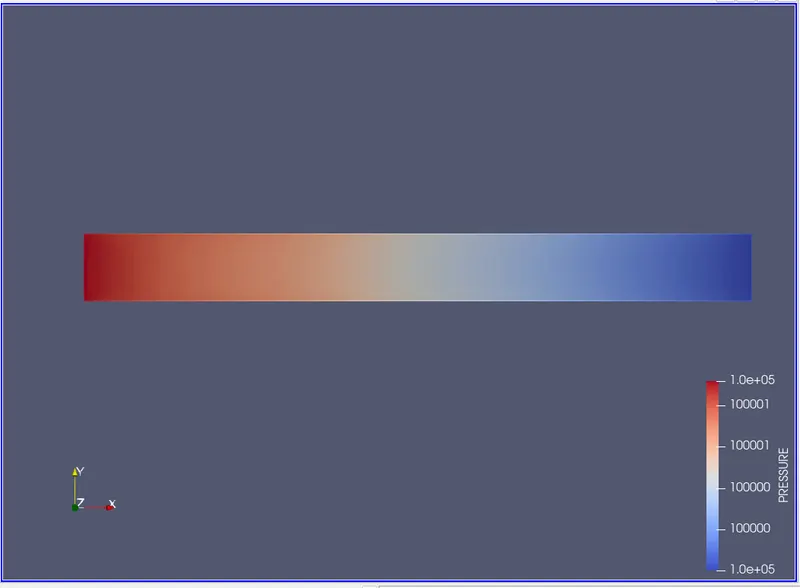
Case 2 Gride size( dx = 1.5e-4m, dy = 1.5e-4m, dz = 1.5e-4m).
Mesh:
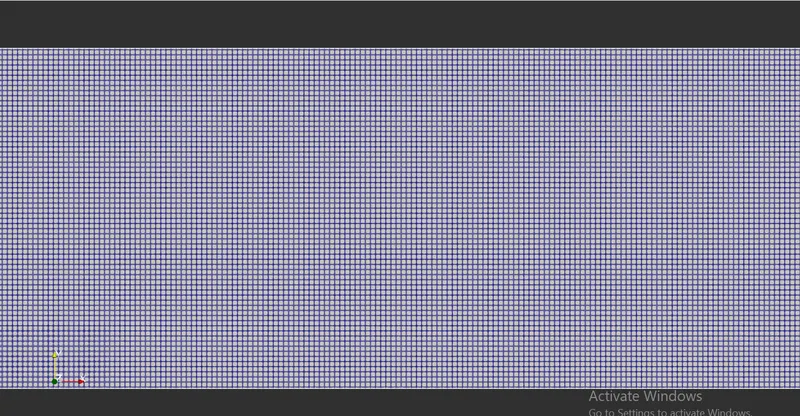
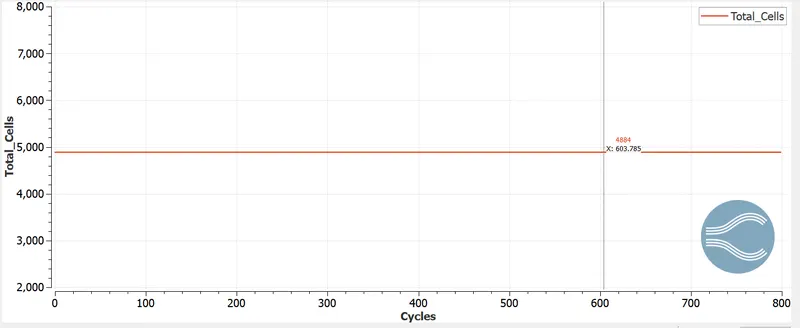
Cell Count: 4884
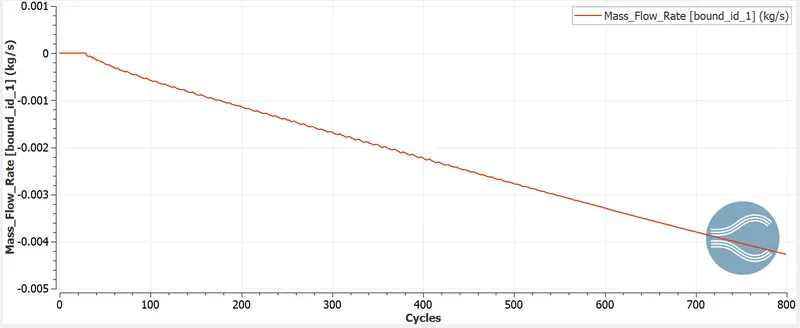
Mass Flow rate at Inlet:
Mass Flow rate at outlet:
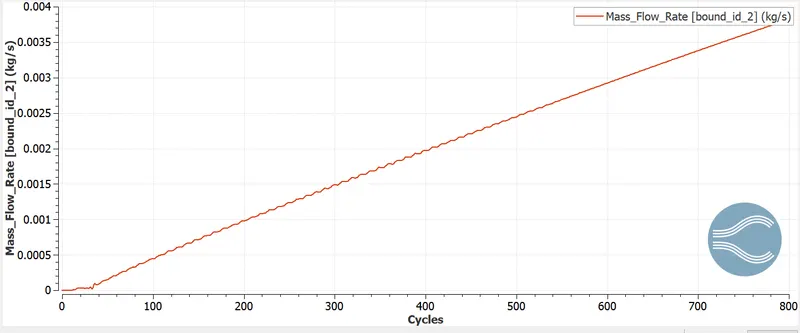
Velocity Plot at Inlet:
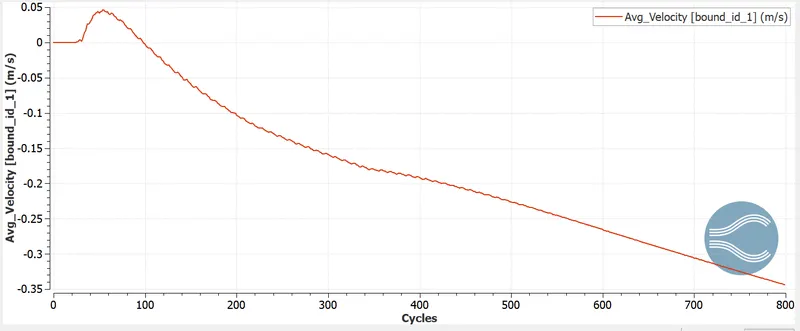
Velocity Plot at Outlet:
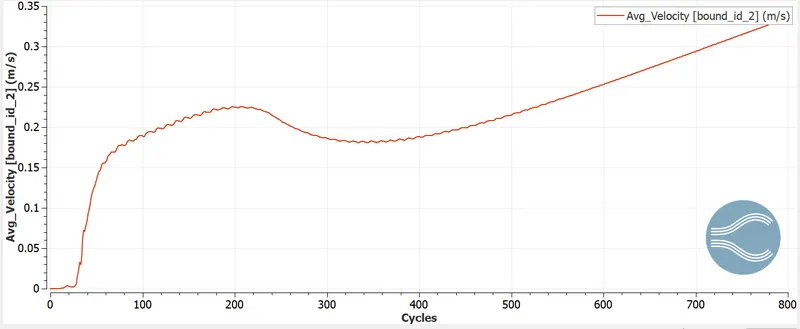
Pressure Plot at inlet:
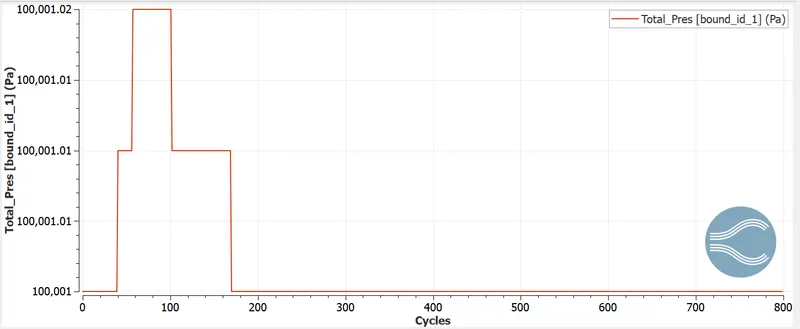
Pressure Plot at Outlet:
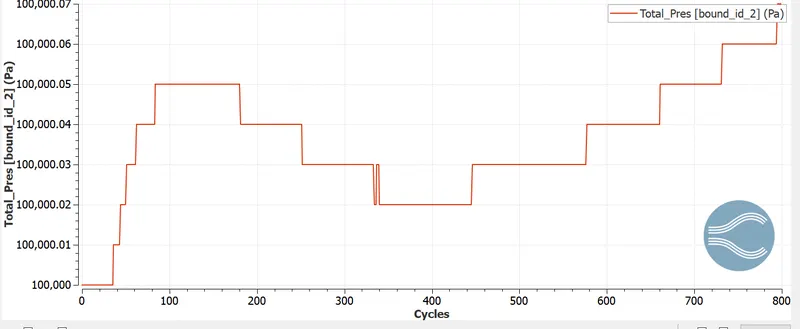
Result:
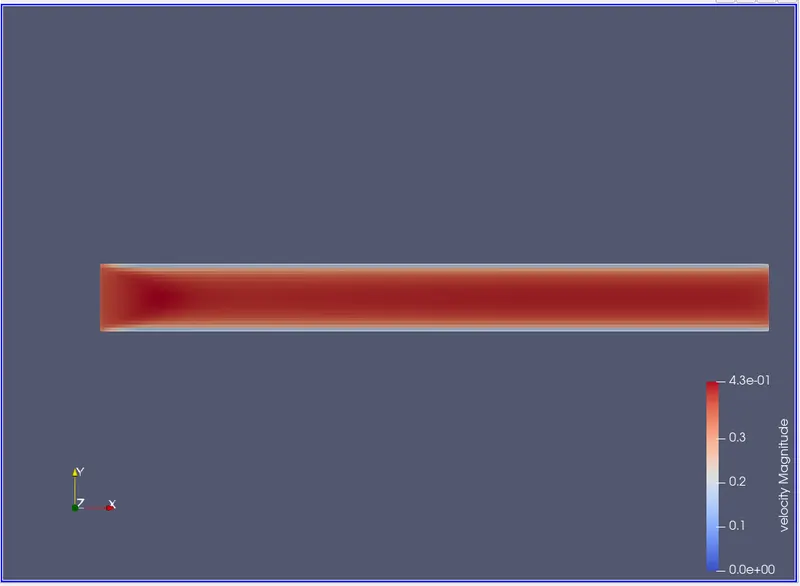
Courant Velocity Profile:
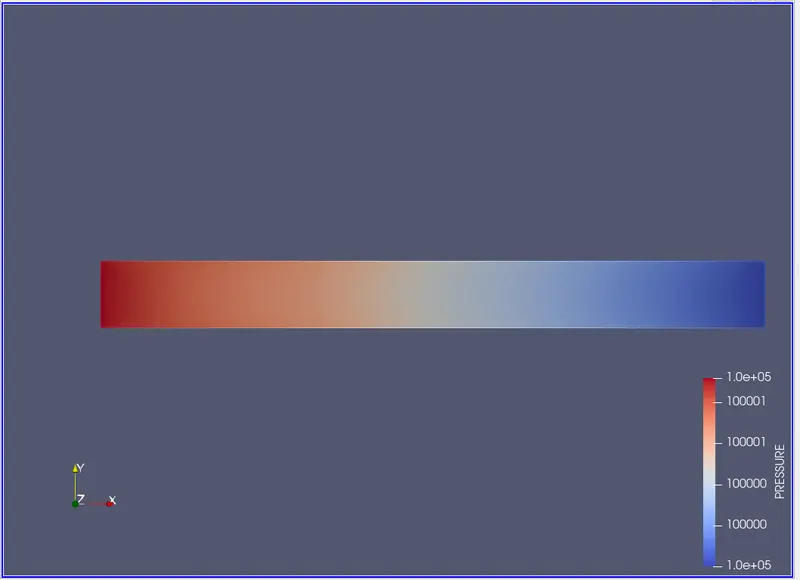
Pressure Courant profile:
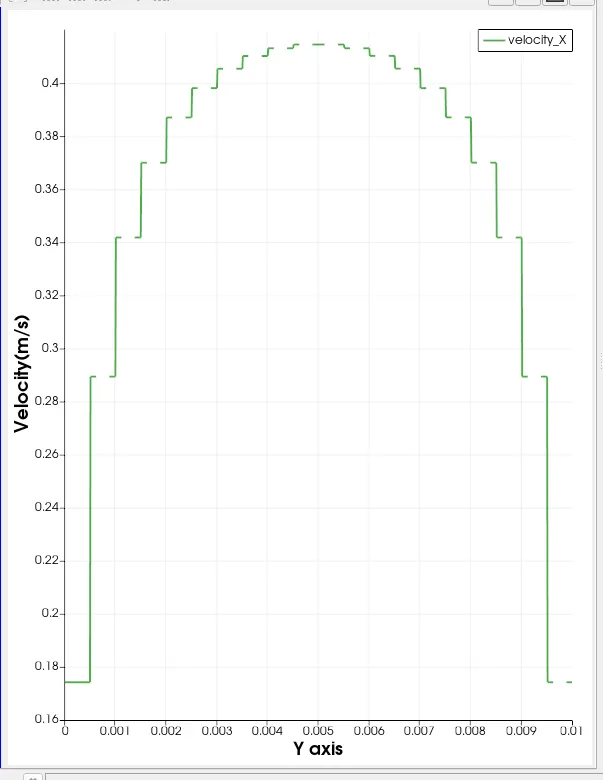
Velocity Profile at 0.05m
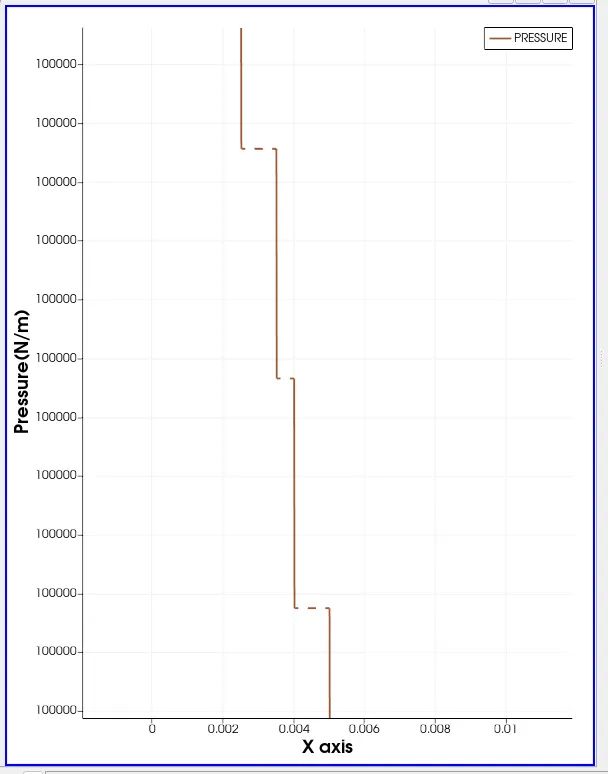
Pressure Drop Profile
Case 3 Grid size ( dx = 1.0e-4m, dy = 1.0e-4m, dz = 1.0e-4m).
Mesh:
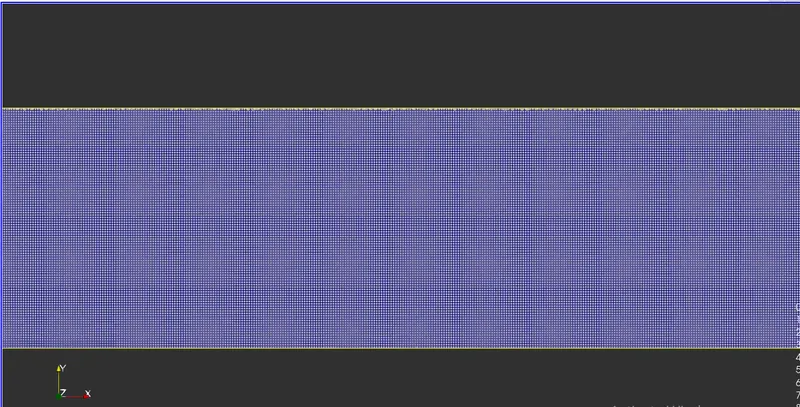
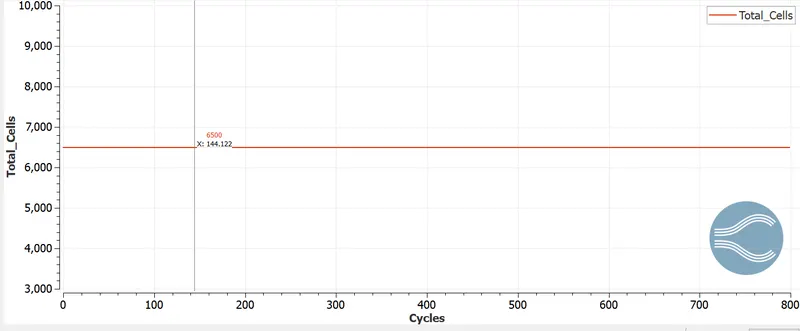
Total Cell Count: 6500
Mass Flow rate at Inlet:
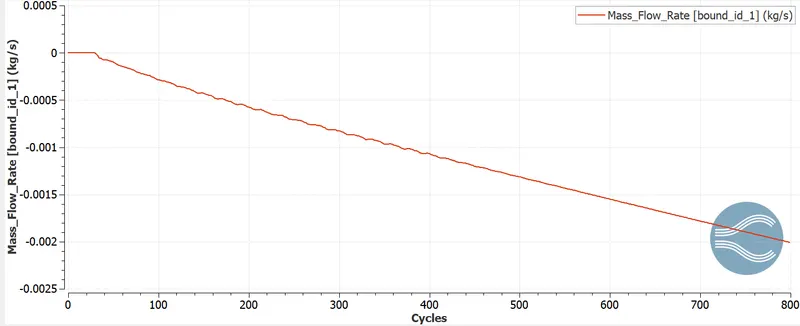
Mass Flow rate at Outlet:
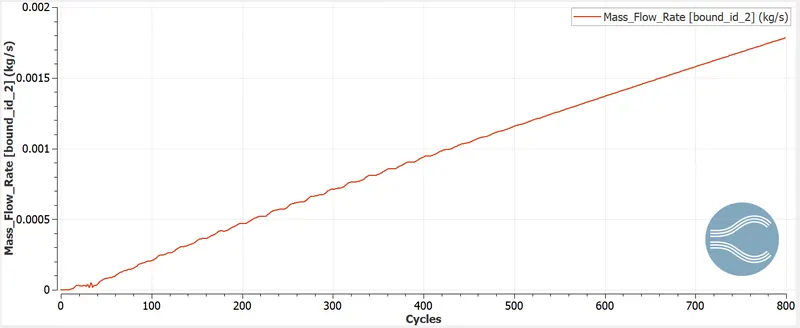
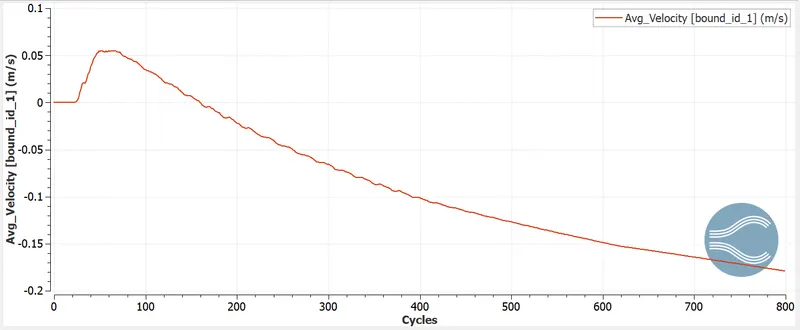
Velocity at Inlet:
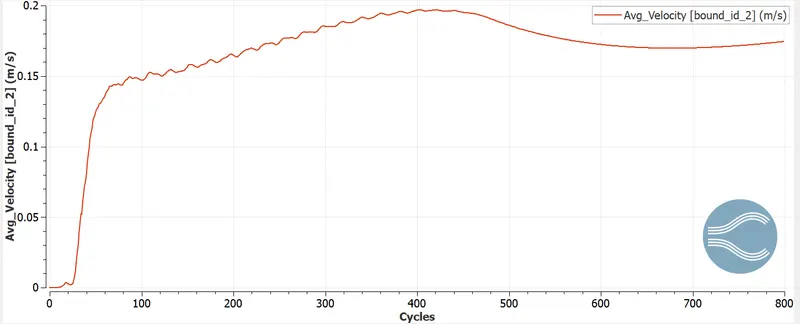
Velocity at Outlet:
Pressure at inlet:
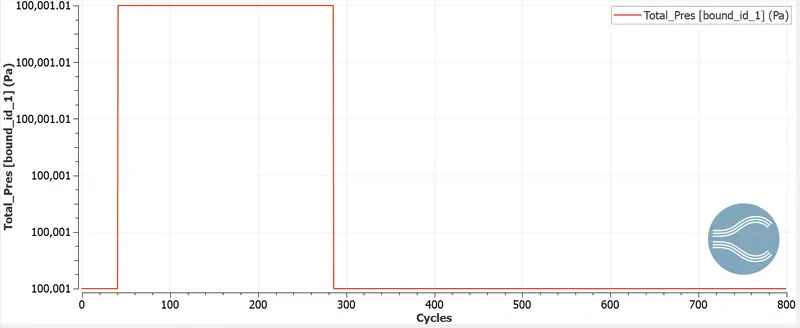
Prssure at Outlet:
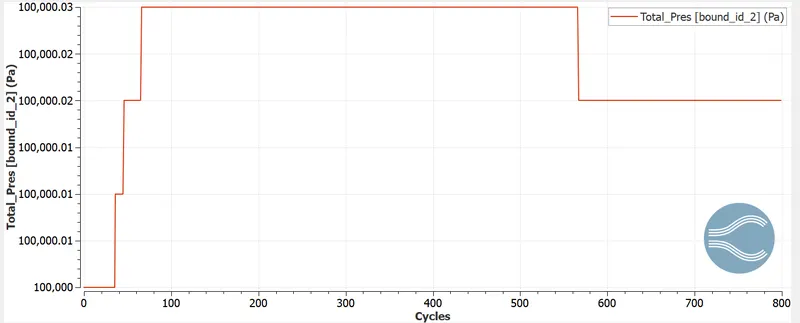
Result:
Counter Velocity Profile:
Counter Pressure:
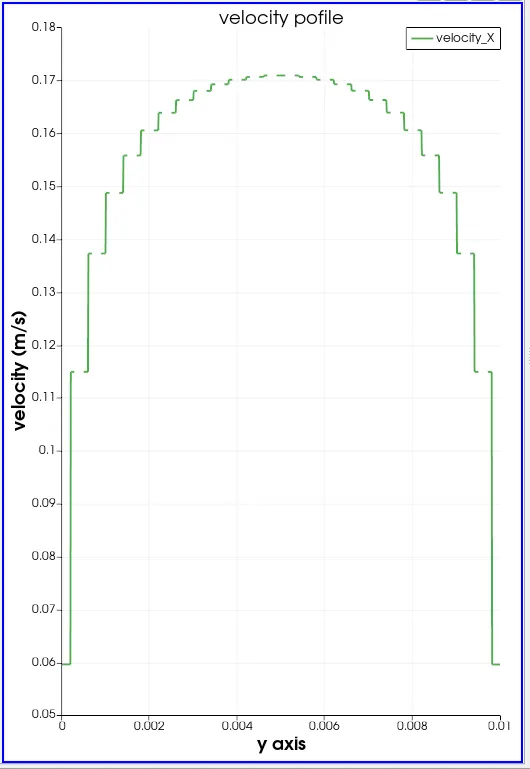
Velocity profile at 0.05m
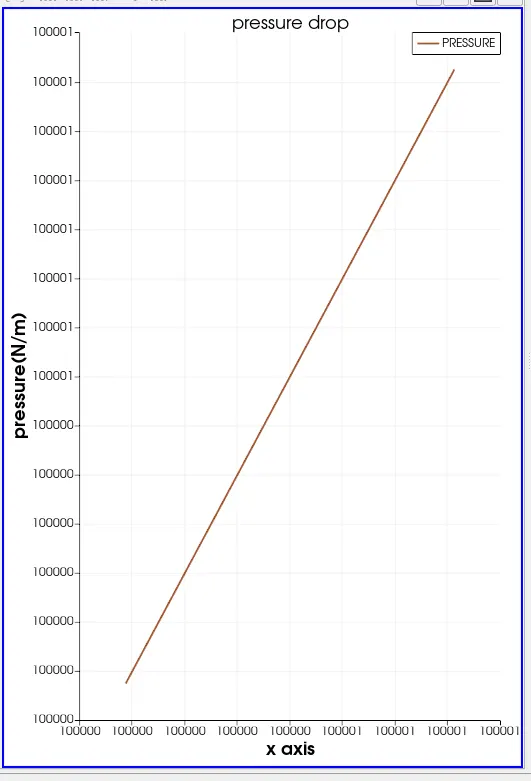
Preesure drop profile:
Animation:
Conclusion:
- The Simulation of flow in three different cases.
- The parabolic profile shows in the flow at inlet to extream outlet.
- As we know the grid is less the velocity profile is smoother.
- As we know the cell increase in the grid size decrease.
- The Shear stress are occurs at the boundary condition.