Week 1: Channel flow simulation using CONVERGE CFD
I. Aim: To perform a steady-state fluid flow in a rectangular channel using converge CFD.
II. Introduction:
In this project flow of a fluid in a rectangular channel is simulated using ConvergeCFD. The case setup is done using ConvergeCFD and simulation is run in the CYGWIN terminal. Further, post-processing is done using ConvergeCFD and ParaView. The main objective of this project is to simulate a simple case of fluid flow in ConvergeCFD.
III Objectives:
1. Perform 2D rectangular Channel flow simulation in ConvergeCFD and CYGWIN terminal for the following mesh cases:
- dx = 2e-4m, dy = 2e-4m, dz = 2e-4m
- dx = 1.5e-4m, dy = 1.5e-4m, dz = 1.5e-4m
- dx = 1.0e-4m, dy = 1.0e-4m, dz = 1.0e-4m
2. Postprocess results in ParaView and ConvergeCFD and report the following:
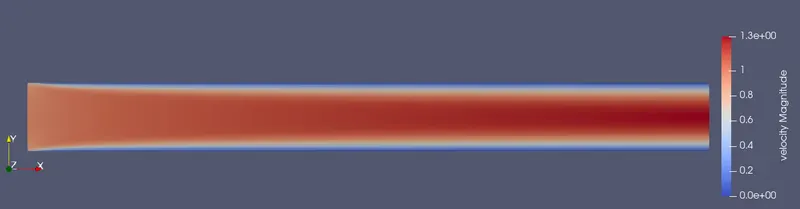
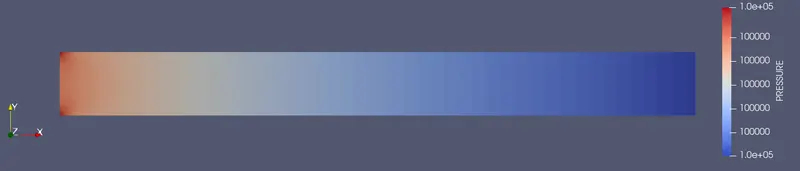
- Velocity and pressure contours for all the 3 base mesh sizes
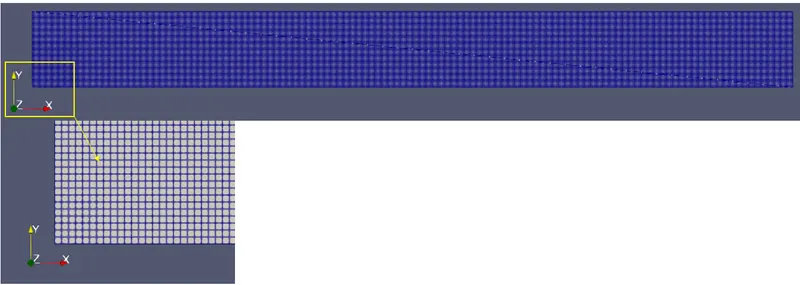
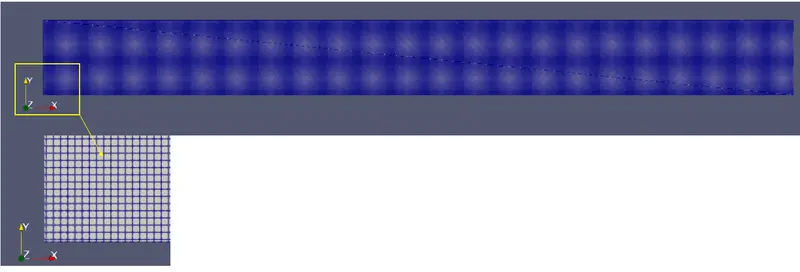
- Show mesh (i.e surface with edges) for the 3 base mesh sizes
- Plots for velocity, pressure, mass flow rate, and total cell count for all 3 base mesh sizes.
IV: Solving & Modelling approach:
2D steady-state CFD analysis of a rectangular channel flow case is set up in ConvergeCFD and then running the solution in CYGWIN terminal. Air is used as the fluid flowing through the channel (77% O2 and 23%N2). Postprocessing is done using ConvergeCFD and ParaView. Three meshes are used to check the effect of cell size on the results.
1. Geometry/Domain:
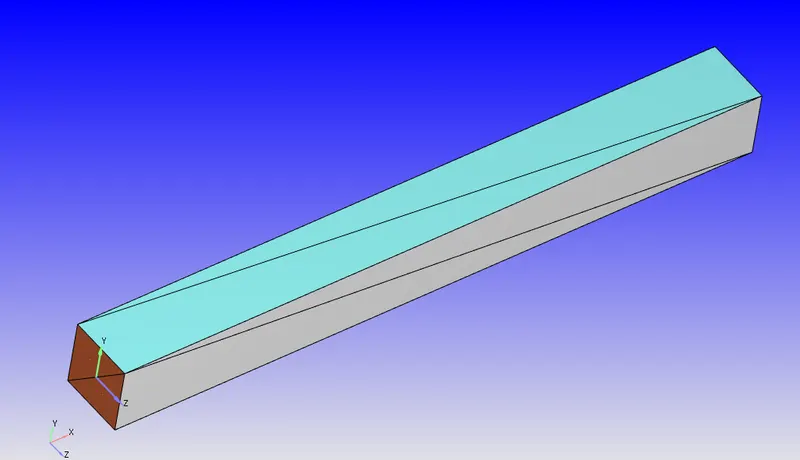
A 3D solid geometry of the typical rectangular channel is created in ConvergeCFD. The following figure shows the created geometry.n ConvergeCFD triangles are the basic building blocks. Hence the rectangular surfaces of the channel are created using a combination of triangles. The dimensions of the channel are as follows:
Length = 0.1 m
Width = 0.01 m
Height = 0.01 m
2. Boundary Flagging:
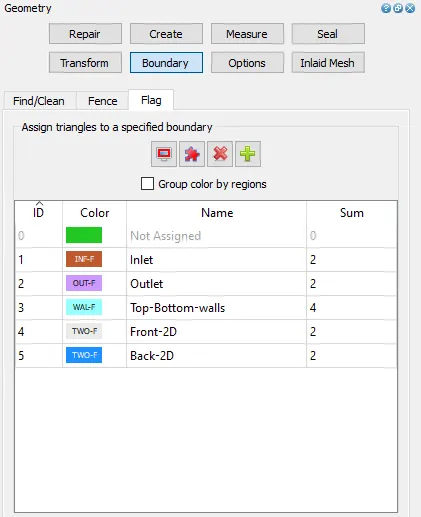
The boundary conditions in ConvergeCFD can be done by flagging boundaries. This can be done by creating boundary flags in the boundary tab as shown below:
3. Case setup:
After assigning boundary zones as mentioned above, the solution case setup is to be done. ConvergeCFD has a dedicated menu to completely set up the solution. Details are as follows:
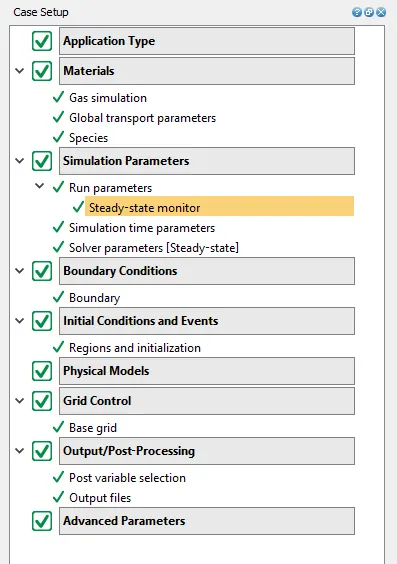
-In the application type option, Time-based is selected.
- The materials option are selected as shown in below images:
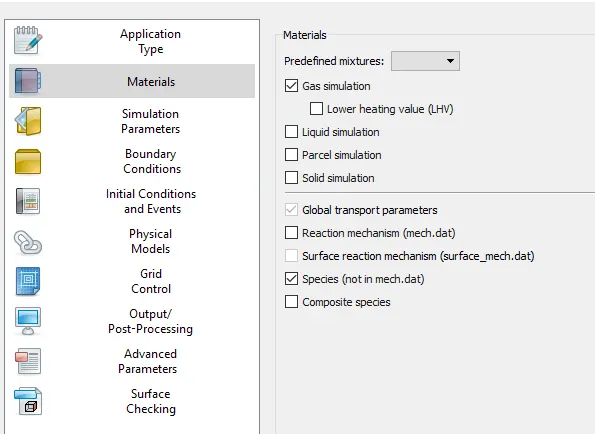
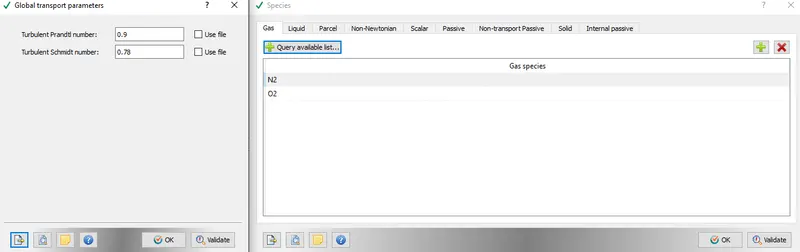
Air is chosen as the working fluid with 77% O2 and 23% N2.
- Simulation Parameters:
The steady-state solver option is selected and respective monitors for various flow variables are selected to monitor during the solution process.
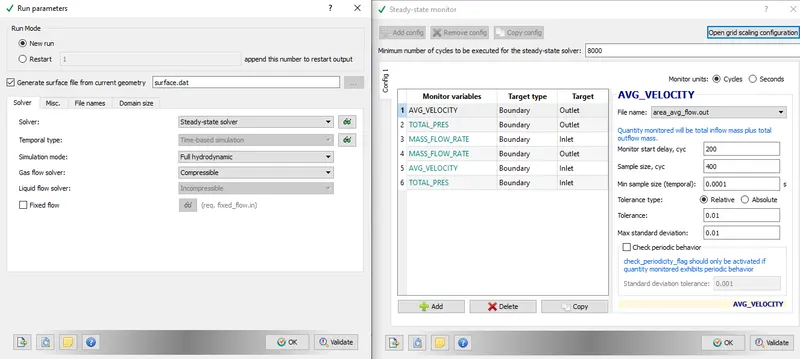
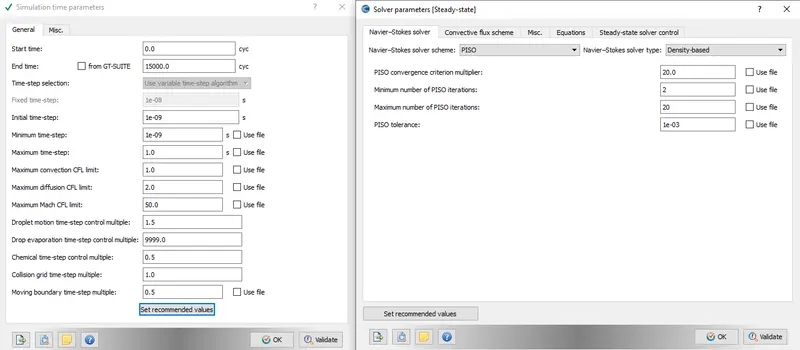
- Boundary Conditions:
The boundary conditions are assigned to the respective boundary zones in this menu. The applied boundary conditions are as follows:
| Boundary Zone | Boundary condition |
| Inlet |
Inflow -Total Pressure = 100001 Pa, -Temperature = 300 K - Species - O2 = 0.77, N2 - 0.23 |
| Outlet |
Outflow - Pressure = 100000 Pa - Temperature backflow = 300 K - Species - O2 = 0.77, N2 - 0.23 |
| Top-Bottom-walls |
Wall - Stationary, no-slip, zero normal gradient temperature. |
| Front-2D | TWO_D |
| Back-2D | TWO_D |
The above boundary conditions can be defined only after defining a region in the Initial conditions and Events section of the case setup as shown below:
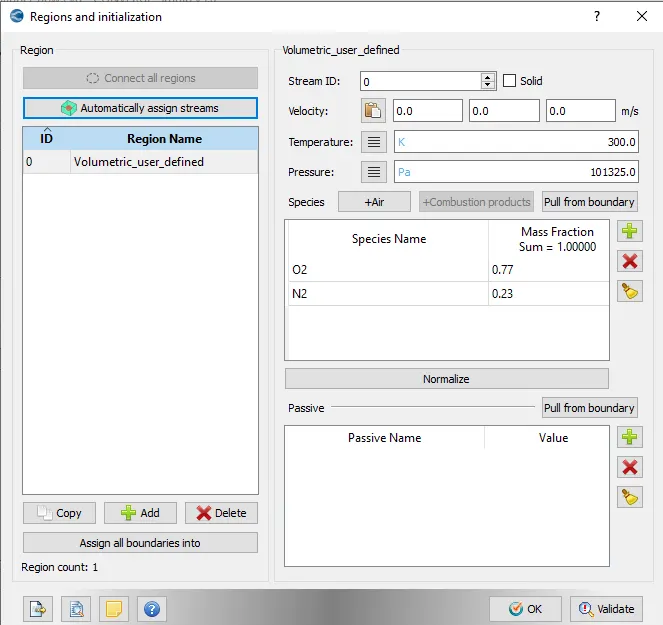
- Grid control:
The mesh size for the domain is defined in this tab as shown below:
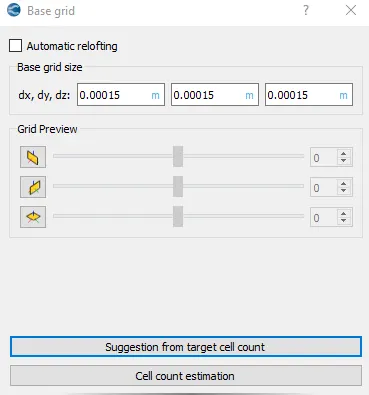
Three mesh sizes are considered in this analysis as below:
- dx = 2e-4m, dy = 2e-4m, dz = 2e-4m
- dx = 1.5e-4m, dy = 1.5e-4m, dz = 1.5e-4m
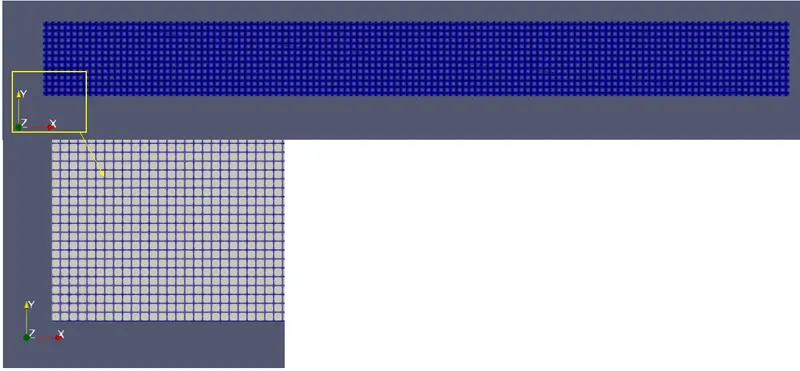
- dx = 1.0e-4m, dy = 1.0e-4m, dz = 1.0e-4m
- Output and post-processing:
The flow variables of interest, which are to be post-processed after the solution are selected in this option ad also at how many intervals these are written to the output file.
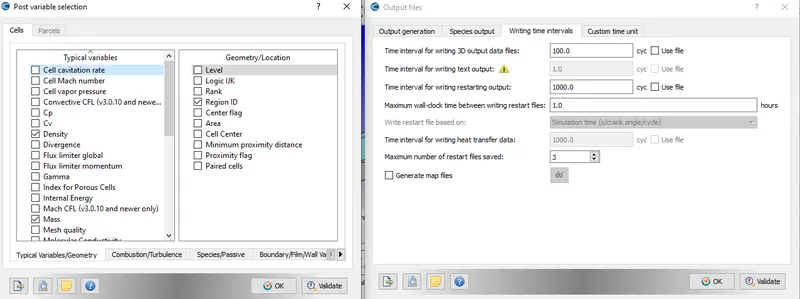
After all the above setup is completed final validation option is selected to check for the case setup is correct. After validation, the case setup files are exported using the export option in the File menu to the working folder. These files will be used by the CGYWIN terminal to run the solution. The above process is repeated for all the mesh sizes and the respective setup files are exported.
Solution in CYGWIN :
The solution is run in the CYGWIN terminal. First, we have to navigate to the respective working folder in the CYGWIN terminal, where case setup files are present. Then by executing the following command, the solution can be run:
Navigating to folder:
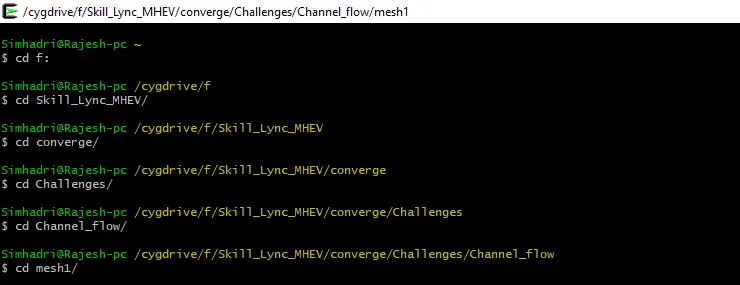
Executing the converge.exe using 4 parallel processors to run the solution:

The solution will run-up to the number of cycles set in the run setup and the output files are saved to the respective folders.
V Post-Processing Results:
After the solution is complete, post-processing of the results is done using CONVERGE CFD and ParaView.
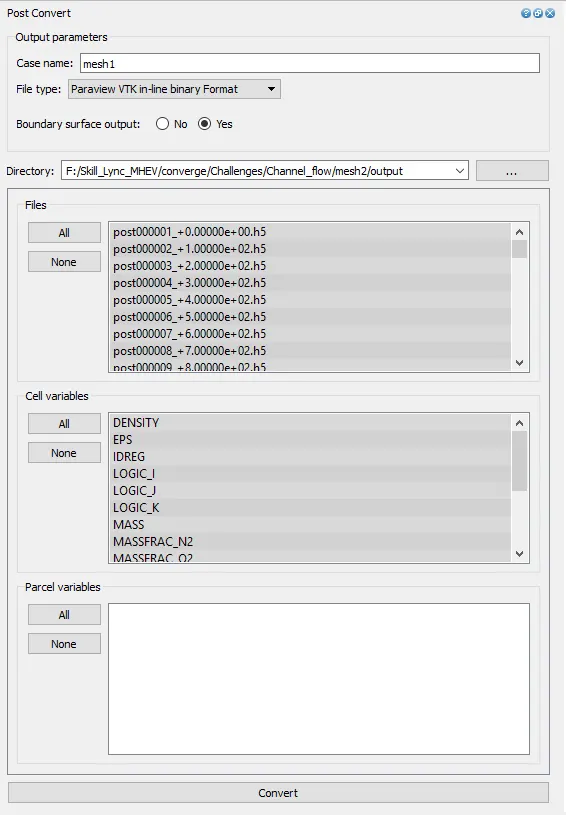
The plots are plotted in CONVERGE CFD, whereas to visualize the flow variables using contour plots the output files need to be converted to ParaView compatible files. This can be done in the CONVERGECFD Post-Processing 3D tab as shown below:
Visualization in ParaView:
The converted ParaView compatible output files are opened in ParaView and the contour plots for Pressure, Velocity and mesh are visualized:
1. Mesh1 (dx = 2e-4m, dy = 2e-4m, dz = 2e-4m):
Grid:
Velocity Contour:
Pressure Contour:
2. Mesh2 (dx = 1.5e-4m, dy = 1.5e-4m, dz =1.5e-4m):
Grid:
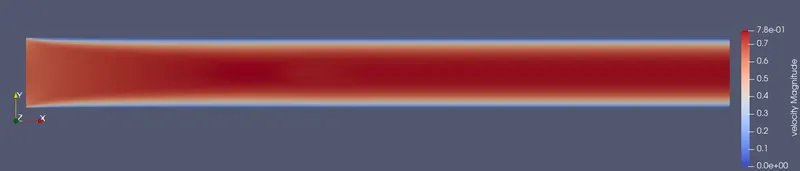
Velocity Contour:
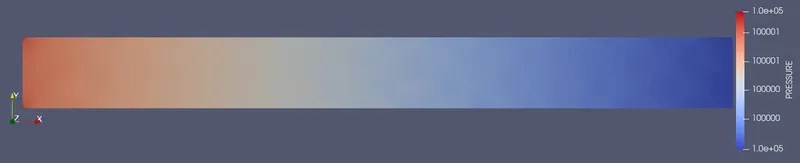
Pressure Contour:
3. Mesh3 (dx = 1e-4m, dy = 1e-4m, dz =1e-4m):
Grid:
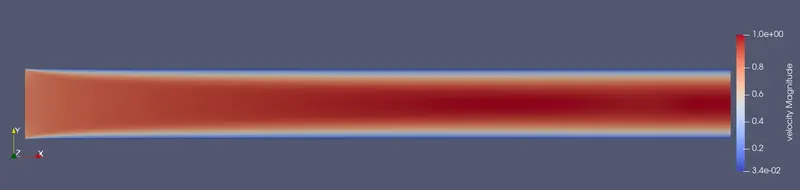
Velocity Contour:
Pressure Contour:
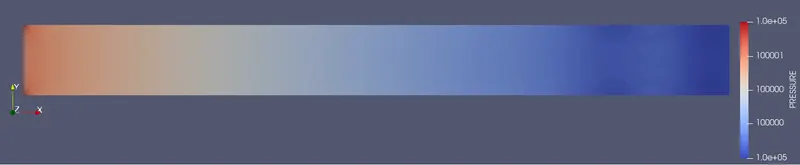
The flow development for all three grid sizes is shown in the below animation:
It can be seen that the flow is initially not stable. As the solution progresses, the flow stabilizes and a hydrodynamic (velocity) boundary layer is formed near the walls and it grows in height from the inlet to the outlet section. The velocity is zero near to the wall due to the no-slip boundary condition and it increases toward the center of the channel. The flow develops from inlet to outlet section and a fully developed flow can be seen towards the outlet section for all the grid sizes.
Graph plots in Converge CFD:
The graphs are plotted for various flow variables using the line plotting tab in Converge CFD:
1. Mesh1 (dx = 2e-4m, dy = 2e-4m, dz = 2e-4m):
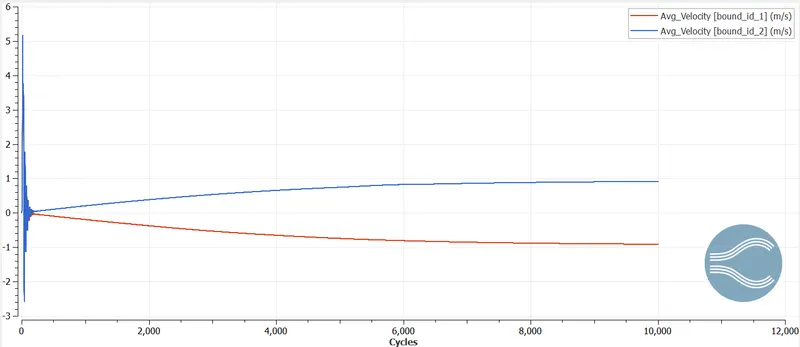
Average Velocity at inlet(bound_id_1) and outlet (bound_id_2) :
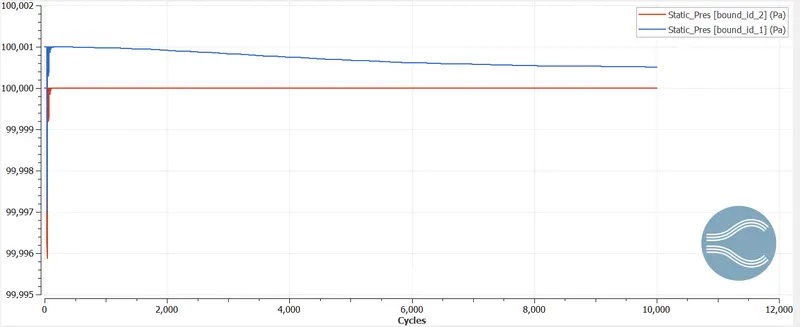
Static Pressure at inlet(bound_id_1) and outlet (bound_id_2) :
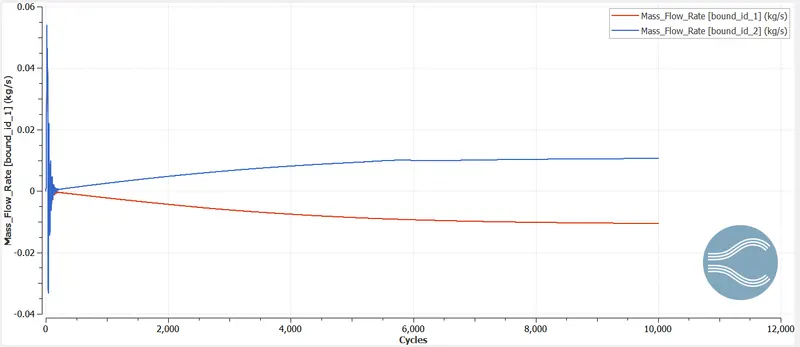
Mass flow rate at inlet(bound_id_1) and outlet (bound_id_2) :
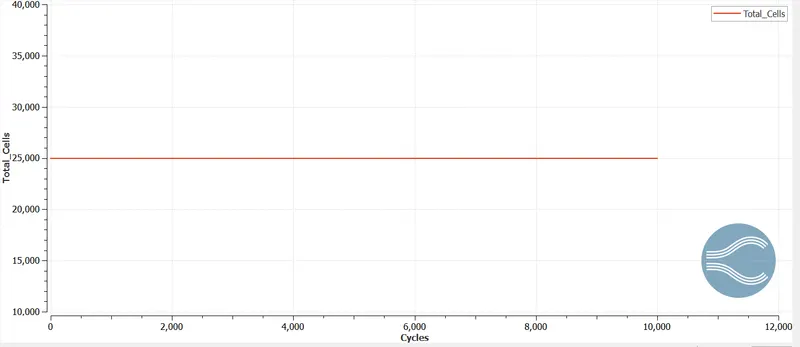
Cell count:
2. Mesh2 (dx = 1.5e-4m, dy = 1.5e-4m, dz =1.5e-4m):
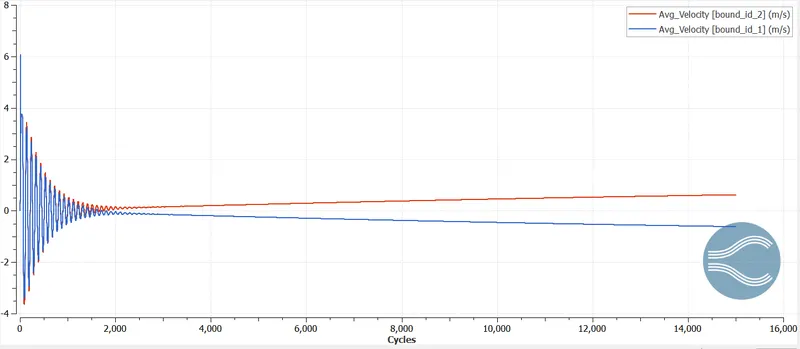
Average Velocity at inlet(bound_id_1) and outlet (bound_id_2) :
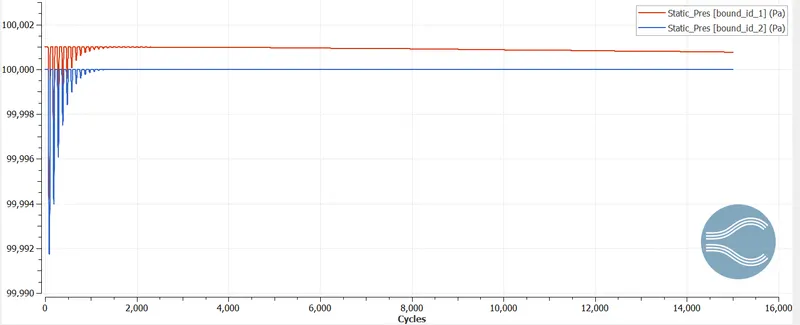
Static Pressure at inlet(bound_id_1) and outlet (bound_id_2) :
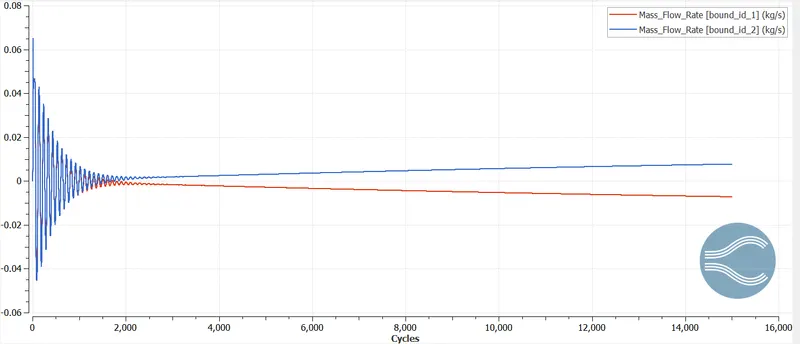
Mass flow rate at inlet(bound_id_1) and outlet (bound_id_2) :
Cell count:
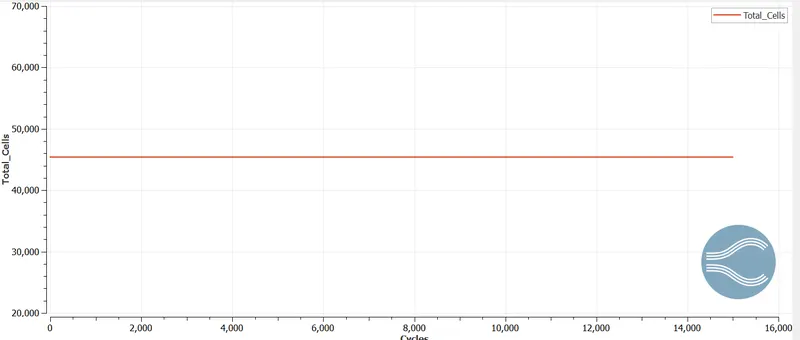
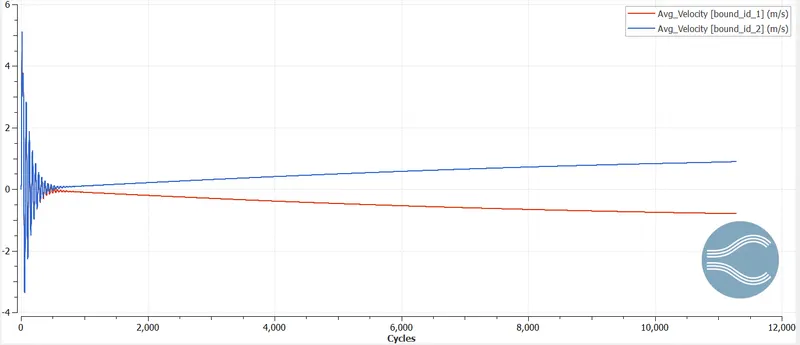
3. Mesh3 (dx = 1e-4m, dy = 1e-4m, dz =1e-4m):
Average Velocity at inlet(bound_id_1) and outlet (bound_id_2) :
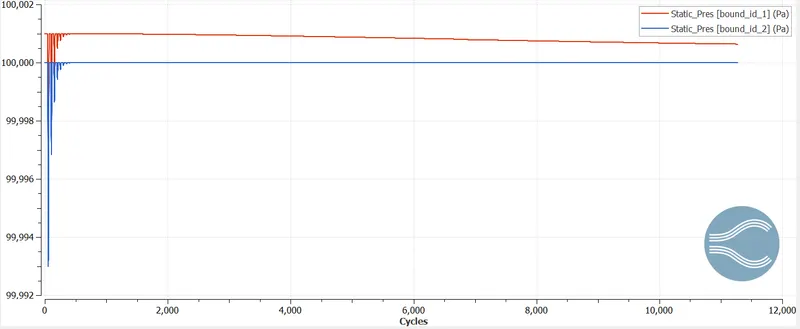
Static Pressure at inlet(bound_id_1) and outlet (bound_id_2) :
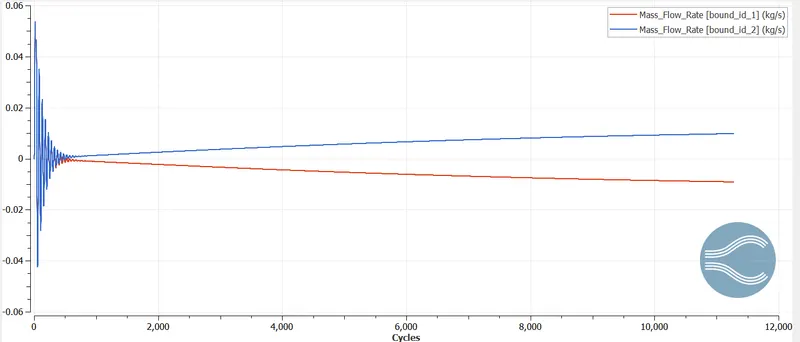
Mass flow rate at inlet(bound_id_1) and outlet (bound_id_2) :
Cell count:
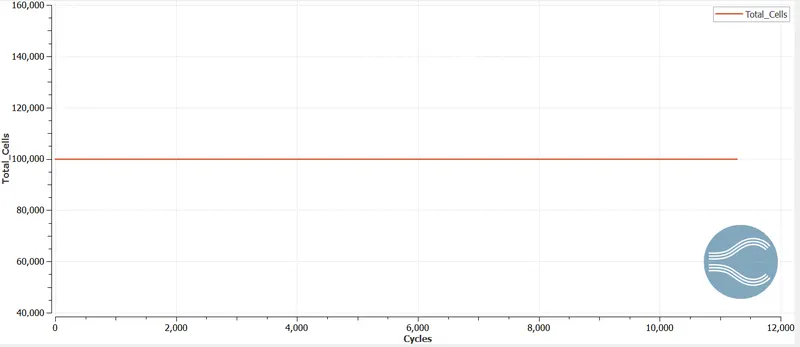
The above contour plots and graph plots show the velocity, pressure, mass flow rate, and cell count for the flow in a rectangular channel for three different mesh sizes.
Conclusion:
In this project, the basic case setup in ConvergeCFD, running the setup in CYGWIN terminal, and post-processing in ParaView, Converge CFD is carried out for flow in a rectangular channel for three different mesh sizes. The various case setup options, post-processing techniques are learnt in this project.