Parsing of NASA thermodynamic data in MATLAB
I. Aim:
The aim of this project is to parsing of a file containing the NASA thermodynamic data for different elements and to find the variation of thermodynamic properties of specific heat, enthalpy and entropy with respect to temperature.
Introduction:
File parsing in the computer world is the process of extracting data from an external file using programming techniques. This may include locating, opening, reading and extracting data from a particular portion of the file. The term ‘Parse’ is used to referring to the syntactic analysis of the input code into its component parts in order to facilitate the writing of compilers and interpreters. The term may also be used to describe a split or separation.
Specific heat (Cp):
It is defined as, the amount of heat per unit mass required to raise the temperature by one degree for a particular substance. It is a property of a substance and its SI unit is J/kg-K. joule. Molar heat capacity is the amount of heat needed to raise the temperature of 1 mole of a substance by 1 Kelvin. The SI unit of molar heat capacity is the joule, so molar heat capacity is expressed in terms of J/mol·K.
Enthalpy (H):
Enthalpy is a property of a thermodynamic system, defined as the sum of the system's internal energy and the product of its pressure and volume, H = U + pV. It’s SI unit is J/kg. The standard molar enthalpy of formation of a compound/substance is defined as the enthalpy of formation of 1.0 mol of the pure compound in its stable state from the pure elements in their stable states at P = 1.0 bar at a constant temperature. The molar units of enthalpy is J/mol.
Entropy (S):
Entropy, the measure of a system's thermal energy per unit temperature that is unavailable for doing useful work. Because work is obtained from ordered molecular motion, the amount of entropy is also a measure of the molecular disorder, or randomness, of a system. Entropy predicts that certain processes are irreversible or impossible, apart from the requirement of not violating the conservation of energy (first law of thermodynamics). Entropy is based on the second law of thermodynamics, which states that the entropy of isolated systems left to spontaneous evolution cannot decrease with time, as they always arrive at a state of thermodynamic equilibrium, where the entropy is highest. It is a property of a system and its SI unit is J/K. The molar entropy of a pure substance is the entropy of a substance in its standard state at 1 atm pressure. Its SI unit is J/mol-K.
NASA has developed polynomials functions, that can be used to evaluate thermodynamic properties such as Cp, H and S for various substances. They have also documented the coefficients that are required to evaluate these polynomials for 1000+ species.
The polynomial functions for the specific heat, enthalpy, entropy for the high-temperature range is given below:
`(Cp)/R = a1+a2×T+a3×T^2+a4×T^3+a5×T^4;`
`H/(RT) = a1+(a2×T)/2+(a3×T^2)/3+(a4×T^3)/4+(a5×T^4)/5+(a6)/T;`
`S/R = (a1×logT)+(a2×T)+(a3×T^2)/2+(a4×T^3)/3+(a5×T^4)/4+a7;`
The polynomial functions for the specific heat, enthalpy, entropy for the low-temperature range is given below:
`(Cp)/R = a8+a9×T+a10×T^2+a11×T^3+a12×T^4;`
`H/(RT) = a8+(a9×T)/2+(a10×T^2)/3+(a11×T^3)/4+(a12×T^4)/5+(a13)/T;`
`S/R = (a8×logT)+(a9×T)+(a10×T^2)/2+(a11×T^3)/3+(a12×T^4)/4+a14;`
Where, the coefficients a1, a2, a3, a4, a5, a6, a7 are HIGH-temperature coefficients and the coefficients a8, a9, a10, a11, a12, a13, a14 are LOW-temperature coefficients. R is the universal gas constant (8.314 J/mol-K).
Molecular Weight:
It is the average mass of a molecule of a compound compared to ¹/₁₂ the mass of carbon 12 and calculated as the sum of the atomic weights of the constituent atoms. Its SI unit is g/mol or amu (atomic mass units).
The formula weight of a substance is the sum of the atomic weights of each atom in its chemical formula. For example, water (H2O) has a formula weight of:
2× (1.0079 amu) +1×(15.9994amu) =18.01528 amu.
If a substance exists as discrete molecules (as with atoms that are chemically bonded together) then the chemical formula is the molecular formula, and the formula weight is the molecular weight. For example, carbon, hydrogen and oxygen can chemically bond to form a molecule of sugar glucose with the chemical and molecular formula of C6H12O6. The formula weight and the molecular weight of glucose is thus:
6×(12amu) +12×(1.00794amu) +6×(15.9994amu) =180.0amu
II . Objectives:
- Write a program in MATLAB for parsing the NASA thermodynamic data file.
- Write a function that extracts the 14 coefficients and calculates the enthalpy, entropy and specific heats for all the species in the data file.
- Calculate the molecular weight of each species and display it in the command window.
- Plot the Cp, Enthalpy and Entropy for the local temperature range (low temperature: high temperature) specific for each species.
- Save the plots as images with appropriate names and dump them in separate folders for each species with a suitable name programmatically.
III. Program:
The main code for parsing the NASA thermodynamic data file is given below:
clear all
close all
clc


%Inputs for calculations
R = 8.314;       %universal gas constant in J/mol-K

%% header content

%opening the NASA thermodynamic data file

n1 = fopen('THERMO.dat','r')                            %opening the THERMO.dat using fopen command and reading the content and storing in variable n1
Title = fgetl(n1)                                       %reading the first line of n1 using fgetl command assigning it to variable Title
global_temp_line = fgetl(n1)
global_temp_line = strsplit(global_temp_line,' ');      %splitting the global temp line array into individual elements using delimiter ' '
global_low_temp  = str2num(global_temp_line{2});         %extracting global low temperature in number format
global_mid_temp  = str2num(global_temp_line{3});            %extracting global mid temperature in number format
global_high_temp  = str2num(global_temp_line{4});           %extracting global high temperature in number format

%%content to be skipped
%reading and ignoring comment lines
for k = 3:5
   m = fgets(n1)
end

%%extracting coefficients of all the species
for j =1:53                                 %looping over all the species
species_line = fgetl(n1)                       %reading species name line
species_line= strsplit(species_line,'  ')  %splitting the string into individual elements using delimiter ' '.
species_name = (species_line{1});            %exctracting species name

Tl = str2num(species_line{length(species_line)-3})    %extracting local low temperature of species in number format
Tm = str2num(species_line{length(species_line)-1})     %extracting local mid temperature of species in number format
Th = str2num(species_line{length(species_line)-2})      %extracting local high temperature of species in number format
coeff_line1 = fgetl(n1)                                %reading first coefficient line
coeff_line2 = fgetl(n1)                                %reading second coefficient line
coeff_line3 = fgetl(n1)                                 %reading third coefficient line
coeffc1 = findstr(coeff_line1,'E')                     %finding the element number of character 'E' in a string

%Extracting the 14 coefficients
a1 = str2num(coeff_line1(1:coeffc1(1)+3));
a2 = str2num(coeff_line1(coeffc1(1)+4:coeffc1(2)+3))
a3 = str2num(coeff_line1(coeffc1(2)+4:coeffc1(3)+3))
a4 = str2num(coeff_line1(coeffc1(3)+4:coeffc1(4)+3))
a5 = str2num(coeff_line1(coeffc1(4)+4:coeffc1(5)+3))

coeffc2 = findstr(coeff_line2,'E')
a6 = str2num(coeff_line2(1:coeffc2(1)+3));
a7 = str2num(coeff_line2(coeffc2(1)+4:coeffc2(2)+3))
a8 = str2num(coeff_line2(coeffc2(2)+4:coeffc2(3)+3))
a9 = str2num(coeff_line2(coeffc2(3)+4:coeffc2(4)+3))
a10 = str2num(coeff_line2(coeffc2(4)+4:coeffc2(5)+3))

coeffc3 = findstr(coeff_line3,'E')
a11 = str2num(coeff_line3(1:coeffc3(1)+3))
a12 = str2num(coeff_line3(coeffc3(1)+4:coeffc3(2)+3))
a13 = str2num(coeff_line3(coeffc3(2)+4:coeffc3(3)+3))
a14 = str2num(coeff_line3(coeffc3(3)+4:coeffc3(4)+3))

T = (Tl:100:Tm:100:Th);  %local temp ranges

%calculation of Cp, H and S
Cp = specific_heat(R,T,Tl,Tm,Th,a1,a2,a3,a4,a5,a6,a7,a8,a9,a10,a11,a12,a13,a14);  %cp calculation using specific_heat function
H = Enthalpy(R,T,Tl,Tm,Th,a1,a2,a3,a4,a5,a6,a7,a8,a9,a10,a11,a12,a13,a14);          %H calculation using enthalpy function
S = Entropy(R,T,Tl,Tm,Th,a1,a2,a3,a4,a5,a6,a7,a8,a9,a10,a11,a12,a13,a14);           %S calculation using entropy function

%MOlecular weight calculation

MW = molecular_weight(species_name) %MW calculation using molecular_weight function


mkdir(species_name) %to create new directory for each species

%plotting Cp,H,S in three separate plots

figure(j*1)             %first figure of jth iteration
plot(T,Cp,'b-o', 'linewidth',2,'MarkerFacecolor','b')
xlim([0 Th])
xlabel('Temperature [K]')
ylabel('Specific heat (Cp) [J/(K-mol)]','color','blue')
legend('Specific heat')
title(sprintf('Variation of Cp with respect to temperaturen for %s',species_name))
image = fullfile(species_name, 'Specific heat')   %creating a file by name 'Specific heat' in the folder of each species and storing in variable image
saveas(gcf,image,'png');         %saving the plot from current figure into the variable image in png format

figure(j*2)                   %second figure of jth iteration
plot(T,H,'r-o','linewidth',2,'MarkerFacecolor','r')
xlim([0 Th])
xlabel('Temperature [K]')
ylabel('Enthalpy (H) [J/mol]','color','red')
legend('Enthalpy')
title(sprintf('Variation of Enthalpy with respect to temperaturen for %s',species_name))
image = fullfile(species_name, 'Enthalpy')   %creating a file by name 'Enthalpy' in the folder of each species and storing in variable image
saveas(gcf,image,'png');         %saving the plot from current figure into the variable image in png format

figure(j*3)               %third figure of jth iteration
plot(T,S,'g-o','linewidth',2,'MarkerFacecolor','g')
xlim([0 Th])
xlabel('Temperature [K]')
ylabel('Entropy (S) [J/mol-K]','color','green')
legend('Entropy')
title(sprintf('Variation of Entropy with respect to temperaturen for %s',species_name))
image = fullfile(species_name, 'Entropy')   %creating a file by name 'Entropy' in the folder of each species and storing in variable image
saveas(gcf,image,'png');         %saving the plot from current figure into the variable image in png format


end
Code Explanation:
Step1: clear all – command to clear the workspace.
Step 2: close all – command to close all opened previous plots.
Step 3: clc – command to clear the command window.
Step4: creating input variable R, the universal gas constant
Step6: Parsing of THERMO.dat file using ‘fopen’ command to open and read the file. The command ‘fgetl’ is used to read the lines in the file. Header content is read and the global temperatures are extracted and stored as individual variables.
strsplit - command used to split a string at delimiter present in it.
species_line= strsplit(species_line,' ')
here species_line is the string to be split and stored in a variable species_line with delimiter ' '.
str2num - This MATLAB function converts a character array or string scalar to a numeric matrix.
Step 7: reading and ignoring the comment lines 3 to 5 using a for loop.
Step 8: A for loop is executed to extract species name, respective local low, mid and high temperatures, coefficients of all 53 species required for calculating Cp, H, S and molecular weight.
Step 9: The local temperature limits are assigned to a variable ‘T’
Step 10: In the same for loop mentioned above the Cp, H, S and molecular weight (MW) for each species are calculated by calling the functions ‘specific_heat’, ‘Enthalpy’, ‘Entropy’ and ‘molecular_weight’ respectively.
The function codes are given below:
Specific Heat Function:
function [Cp] = specific_heat(R,T,Tl,Tm,Th,a1,a2,a3,a4,a5,a6,a7,a8,a9,a10,a11,a12,a13,a14)
if   Tl>=T<=Tm
     Cp = R.*(a8+(a9.*T)+(a10.*T.^2)+(a11.*T.^3)+(a12.*T.^4)) ;
else if T > Tm
    Cp = R.*(a1+(a2.*T)+(a3.*T.^2)+(a4.*T.^3)+(a5.*T.^4));
end
end
Enthalpy Function:
function [H] = Enthalpy(R,T,Tl,Tm,Th,a1,a2,a3,a4,a5,a6,a7,a8,a9,a10,a11,a12,a13,a14)
if    Tl>=T<=Tm
     H = R.*T.*(a8+(a9.*T/2)+(a10.*T.^2/3)+(a11.*T.^3/4)+(a12.*T.^4/5)+(a13./T)) ;
else if T > Tm
    H= R.*T.*(a1+(a2.*T/2)+(a3.*T.^2/3)+(a4.*T.^3/4)+(a5.*T.^4/5)+(a6./T));
end
end
Entropy Function:
function [S] = Entropy(R,T,Tl,Tm,Th,a1,a2,a3,a4,a5,a6,a7,a8,a9,a10,a11,a12,a13,a14)
if  Tl>=T<=Tm
     S = R.*((a8.*log(T))+(a9.*T)+(a10.*T.^2/2)+(a11.*T.^3/3)+(a12.*T.^4/4)+a14) ;
else if T > Tm
    S= R.*((a1.*log(T))+(a2.*T)+(a3.*T.^2/2)+(a4.*T.^3/3)+(a5.*T.^4/4)+a7);
end
end
The functions specific_heat, Enthalpy, Entropy has if-else condition statements to compute Cp, H, and S in terms of temperature. The input arguments for these are R, local temperature limits, and the 14 coefficients. The coefficients used for computing them changes for local low to high-temperature ranges.
Molecular Weight Function:
function [MW] = molecular_weight(species_name)
atomic_name = ['H','C','N','O','Ar'];        %array containing elements
atomic_weight = [1.008,12.011,14.007,15.999,39.95]; %array containing element atomic weights

MW = 0; %initial range of MW

for i = 1:length(species_name)  %looping over all species
    for j = 1:length(atomic_name) %looping over the length of atomic name elements
        if strcmp(species_name(i),atomic_name(j)) %compares the two strings
            MW = MW+atomic_weight(j);
            f  = j;                     %holding the position
        end
    end
    k = str2num(species_name(i));

    if k>1
        MW =MW+atomic_weight(f)*(k-1);
    end
end

fprintf('Molecular weight of %s = %f g/mol',species_name,MW);


end
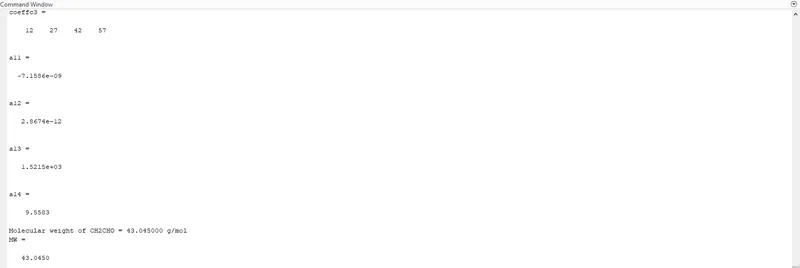
The code for the molecular weight calculation is shown in the above function code. The molecular_weight function takes species_name as the input argument and compares it to the atomic_name array elements in computing the molecular weight. It consists of a nested for loop for looping over all the species and individual elements of each species to compare and compute atomic weight. The code for the molecular weight calculation is shown in the above function code. ‘fprintf’ command is used to print the molecular weight value of each species in the command window.
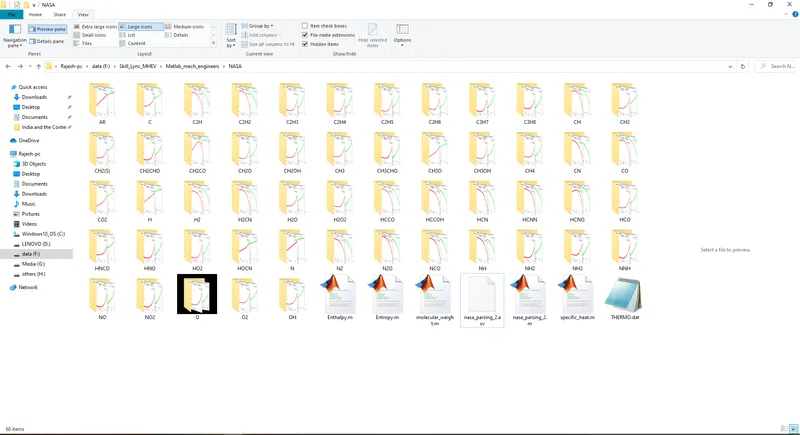
Step 11: creates a new directory by ‘species_name’ in the current working directory using ‘mkdir’ command. This command creates separate folders for each species in the name of species while the for loop is executed over the 53 species.
Step 12: plotting of Cp, H, S graphs separately and saving them as images in png format in respective species folders.
syntax: image = fullfile(species_name, 'Enthalpy')
fullfile - command that returns a character vector containing the full path to the file 'Enthaply' in the folder 'species_name'. The path information is stored in 'image' variable.
saveas(gcf,image,'png');
save as- command used to save the plot from the current figure(gcf) in png format into the 'image' variable.
Steps 8-12 are executed in a for loop to calculate Cp, H, S, and MW and saving the plots for all the 53 species elements in the ‘THERMO.dat’ data file.
IV. Errors:
The following are the errors encountered while executing the program:
The following are the errors encountered while executing the program:
1. Error using str2num
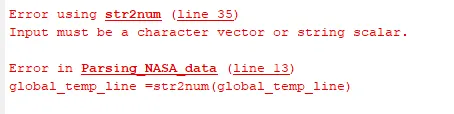
The error is due to the syntax error of converting a string to a number using the str2num command. It is due to not indexing the element to be converted to a number from string format from a cell array. The error is rectified by indexing the element number in the cell array before using str2num command. The corrected syntax is
global_low_temp = str2num(global_temp_line{2});
2. Unrecognized fy=unction or variable ‘lenghth’.
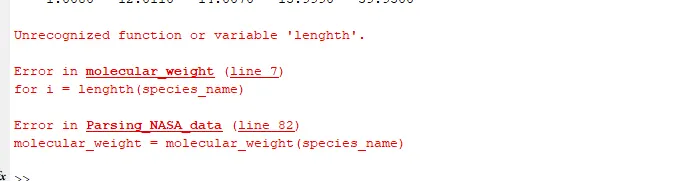
The error is due to typo error of ‘lenghth’ as shown below:
for i = 1:lenghth(species_name)
It is corrected using the syntax:
for i = 1:length(species_name)
V. Output:
The main objective of this project is to parse the content in the NASA thermodynamic data and calculate Cp, H, E and MW of each species. The calculated Cp, H, E are plotted against the temperature ranges separately for each species and saved into separate folders automatically. The folders for all the species with plots of Cp, H, and E saved separately are shown in the below figure:
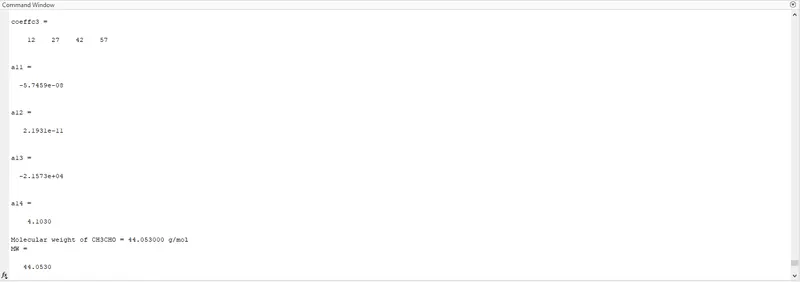
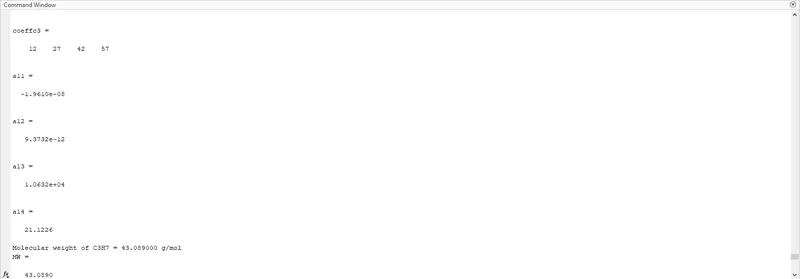
Molecular weight for each species is calculated and displayed in the command window. As an example, The molecular weight displayed in the command window for CH2CHO, CH3CHO and C3H7 are shown in the below images:
The variation of Cp, H, E with respect to local temperature ranges (low: high) for O2, CO2 and N2 calculated and plotted using the functions are shown in the below figures:
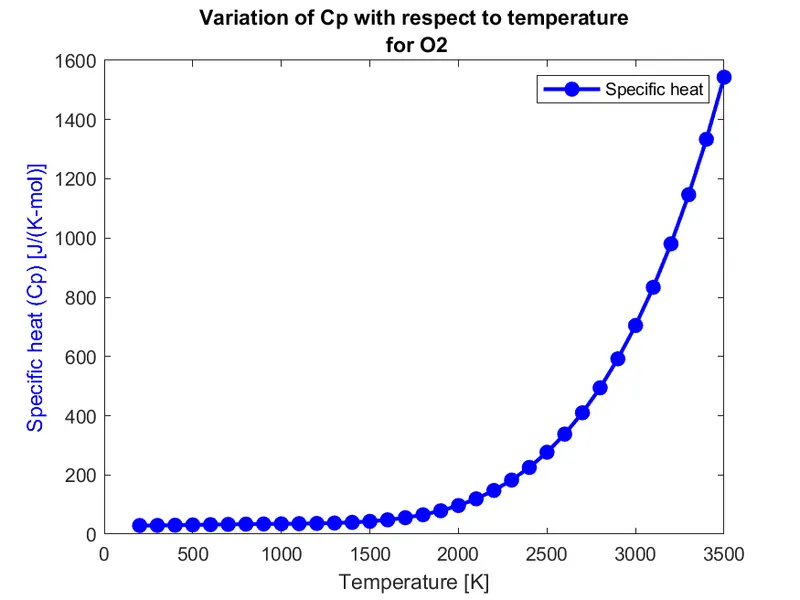
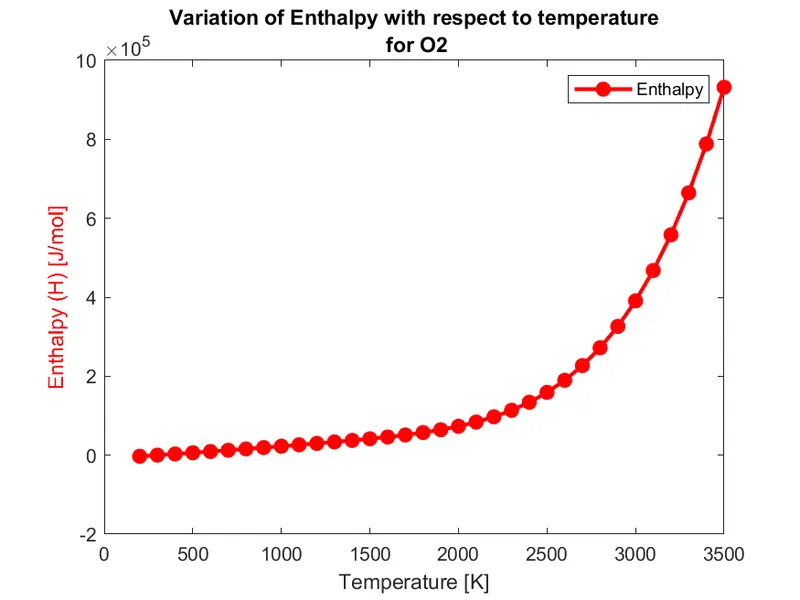
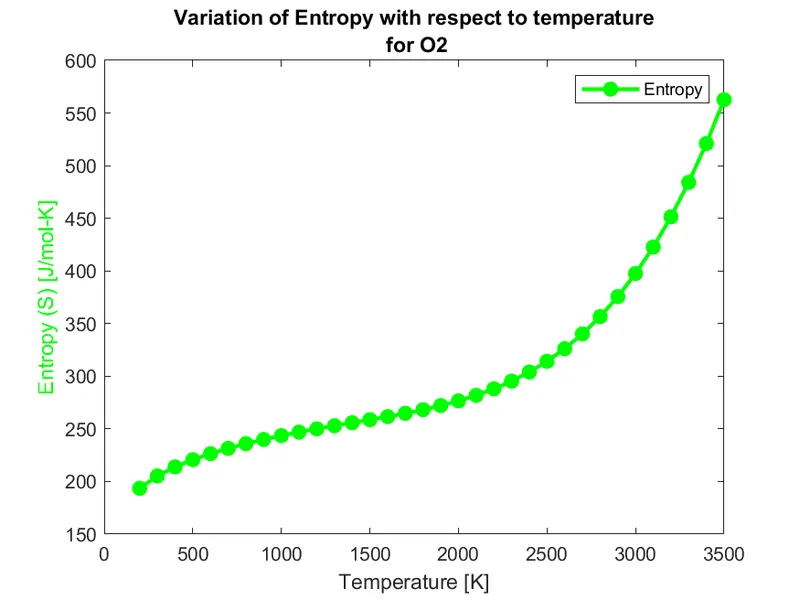
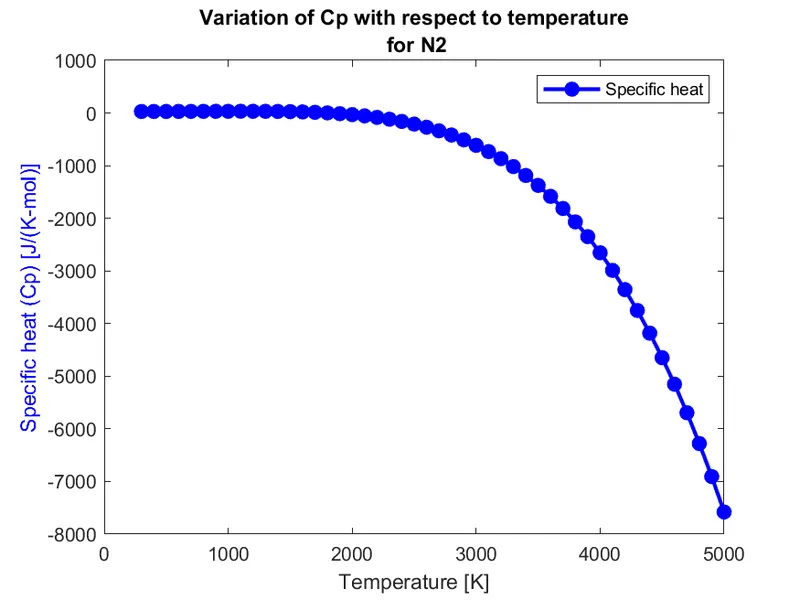
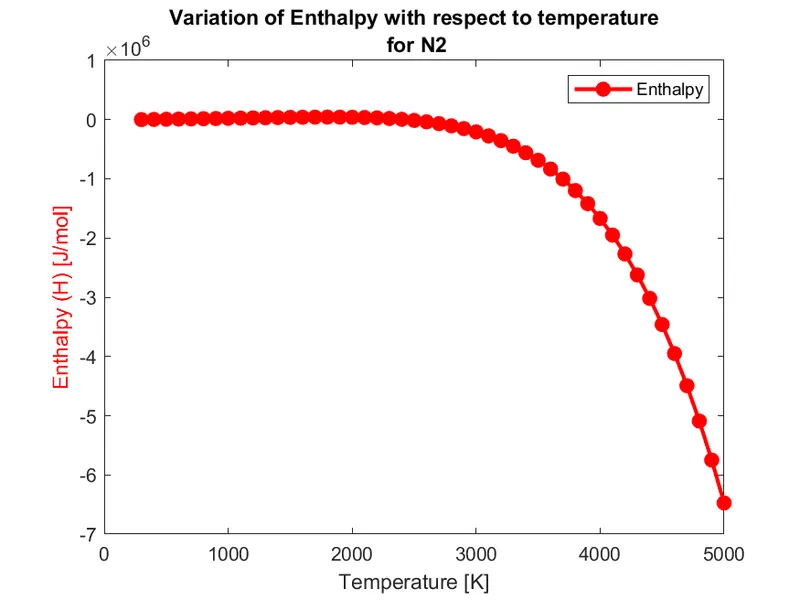
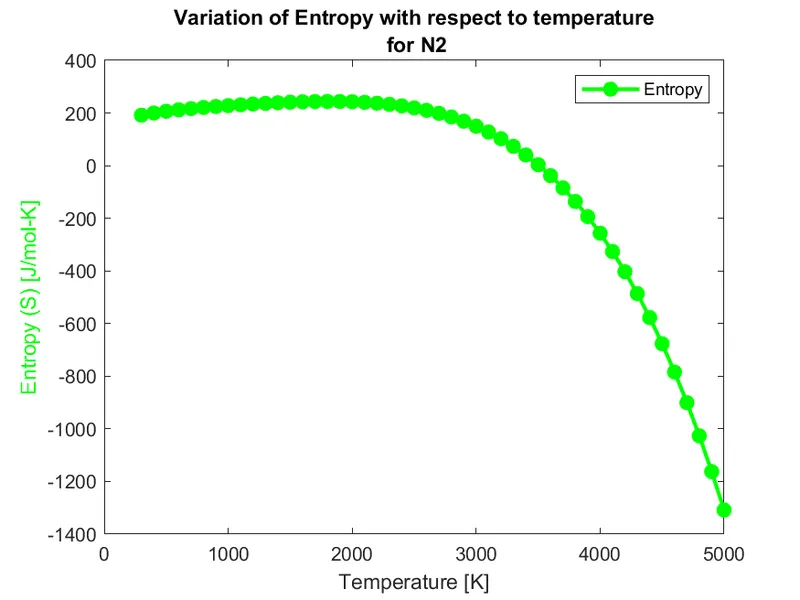
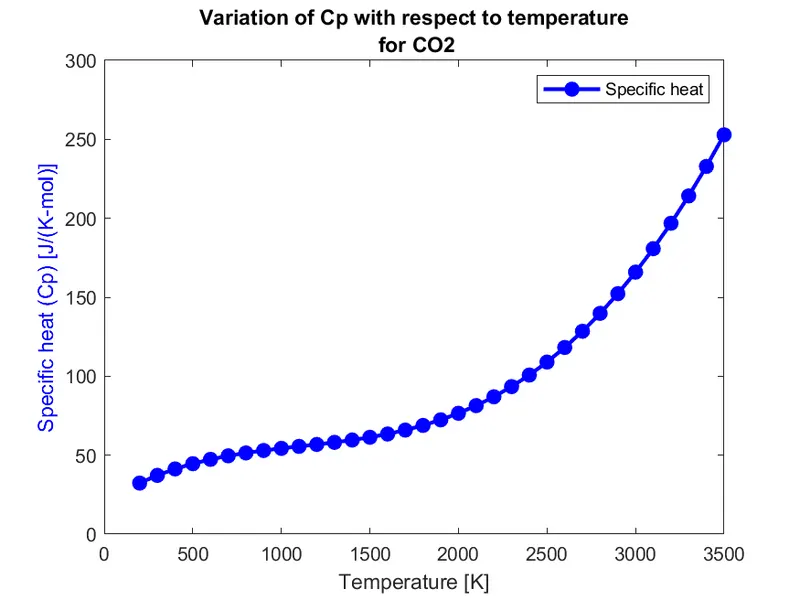
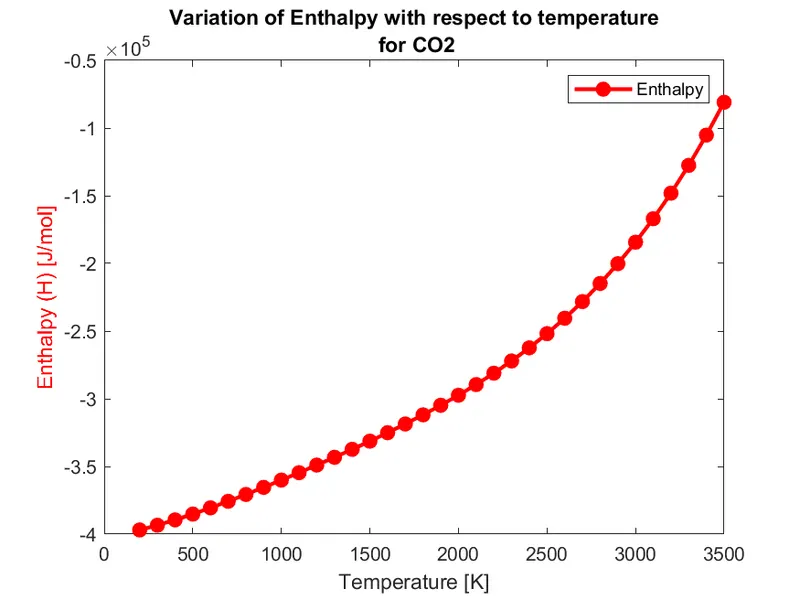
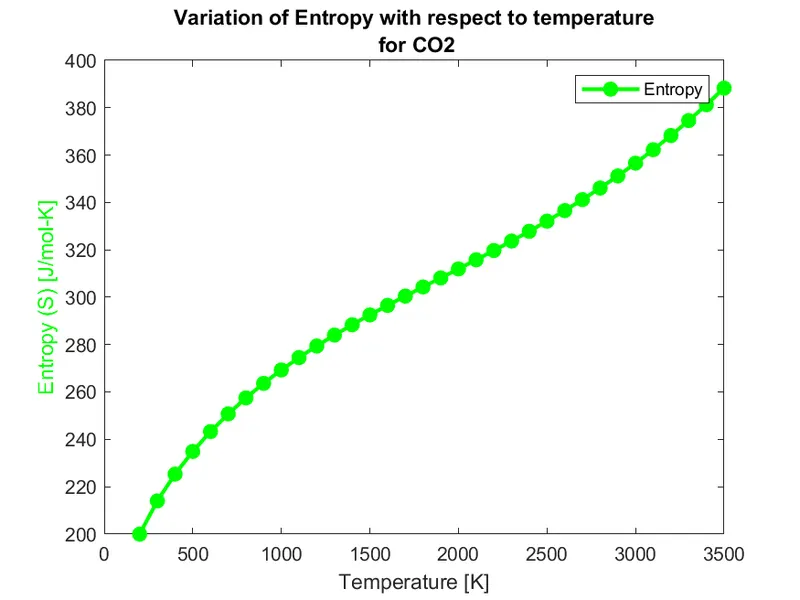
It can be seen from the above figures that the Cp, H and E increase with respect to temperature in the given temperature limits(low: high) for O2 and CO2, whereas they decrease with respect to temperature in the given temperature limits(low: high) for N2. Because the coefficients for each species are having different values.
VI. Conclusion:
File parsing is a method of extracting the content in a file using programming techniques. In this project, a MATLAB program with function codes is executed to parse out the NASA thermodynamic data file and calculating Cp, H, E and MW of each of the species element from the coefficients and temperature data in the file.
References:
1. https://in.mathworks.com/help/matlab/ref/fgetl.html
2. https://en.wikipedia.org/wiki/Parsing
4. Thermodynamics, An engineering approach, Yunus A. Cengel, Michael A. Boles, Mehmet Kanoglu