Week 1: Channel flow simulation using CONVERGE CFD
Aim: To set up the channel flow simulation in converge.
Objective: Run the simulation for the following mesh grid size.
| dx(m) | dy(m) | dz(m) | |
| case-1 | 2e-4 | 2e-4 | 2e-4 |
|
case-2 |
1.5e-4 | 1.5e-4 | 1.5e-4 |
| case-3 | 1e-4 | 1e-4 | 1e-4 |
Channel flow
Flow in conduits or channels are of two types.
Open channel flow: River, tidal currents, irrigation canals or sheet of water running across the ground surface after rain.
Closed channel flow: pipe flow, flow of air through the duct, closed rectangular channel.
There are the following steps to be taken during this project:
- creating geometry.
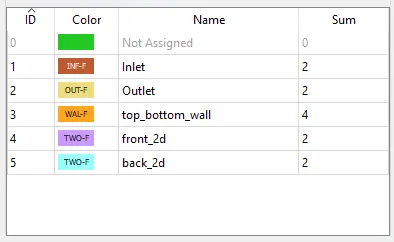
- Assigning triangles to a specified boundary.
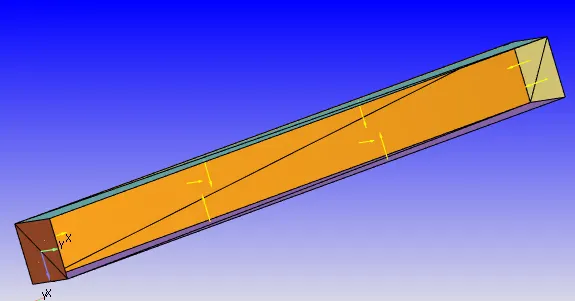
- transform Normals.
- begin case setup.
- export input files.
- run simulation.
- post process the result.
Case setup
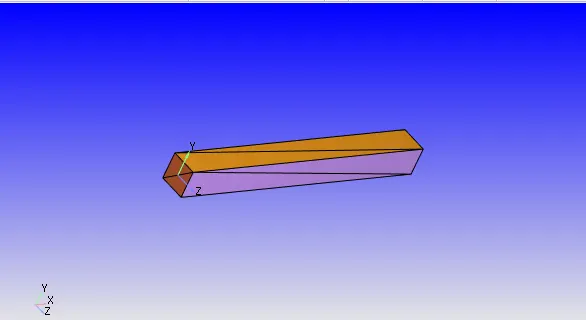
- Create geometry
- Assign triangles to boundary
- Transform Normals to Inword direction.
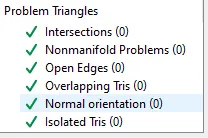
- Run diagnosis.
- begin case setup.
- Application type: Time base
- materials: select gas simulation
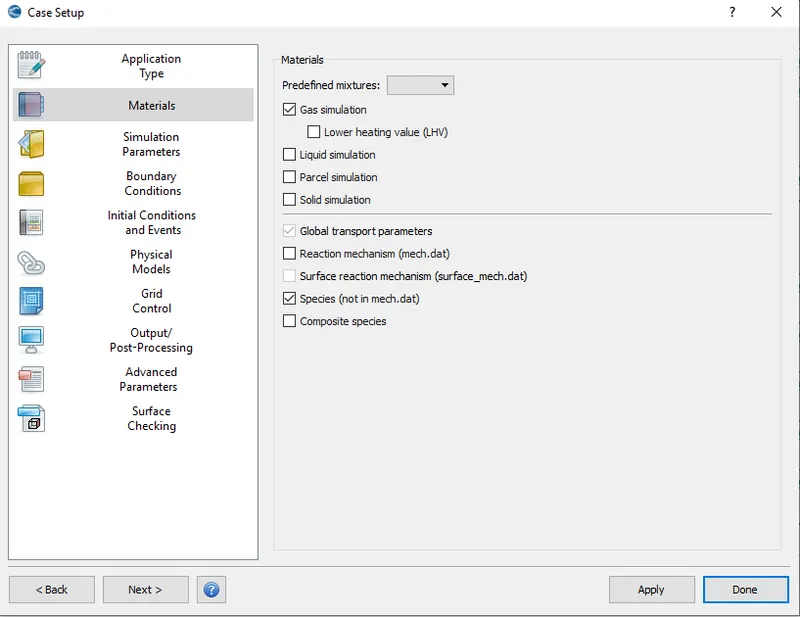
- Gas transport parameter
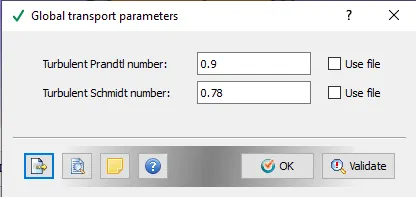
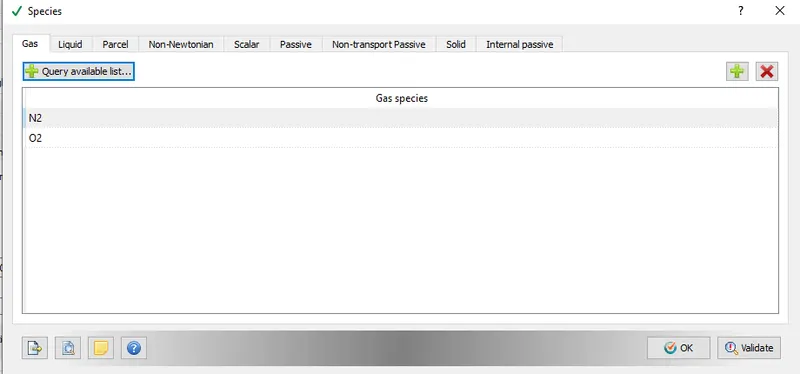
- Species
- Run parameters
- solver: steady state
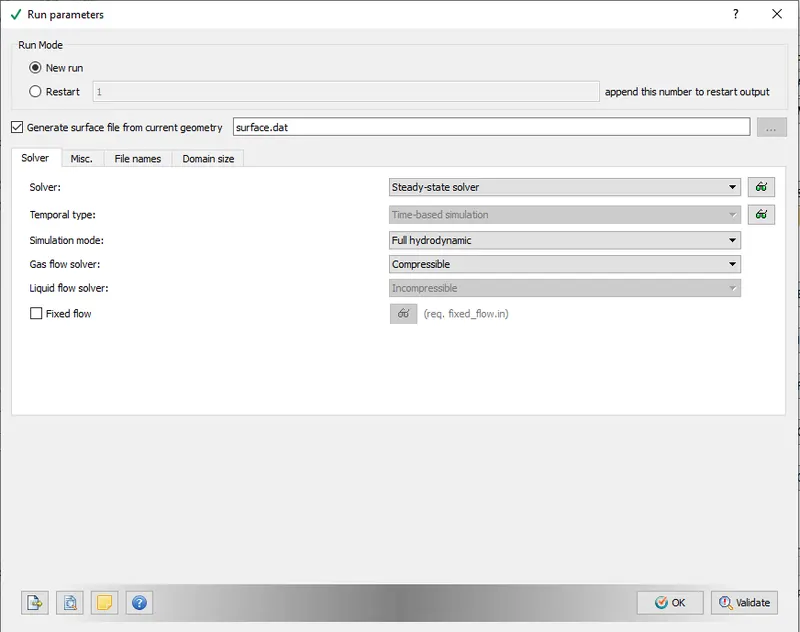
- solver: steady state
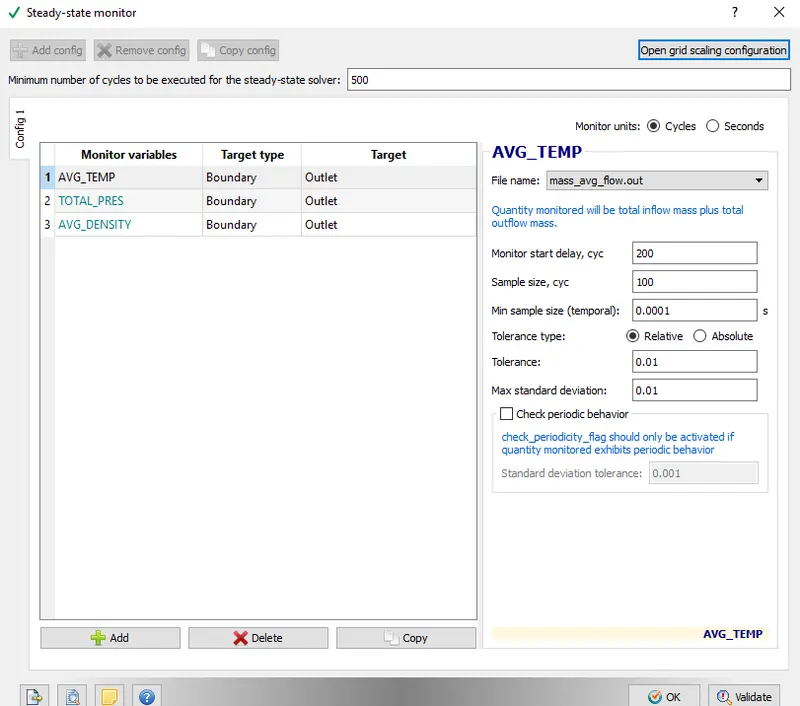
- Steady state monitor
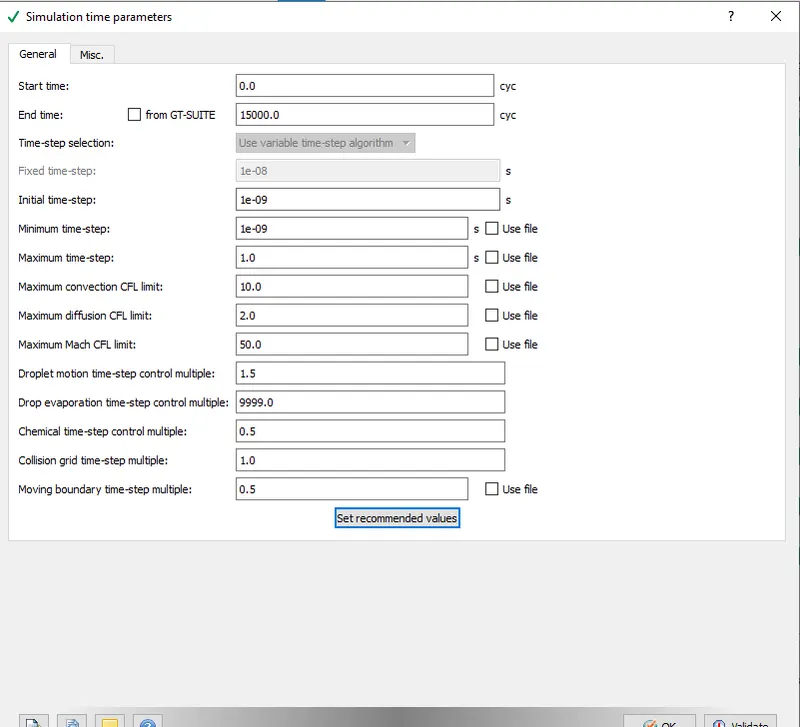
- Simulation time parameter
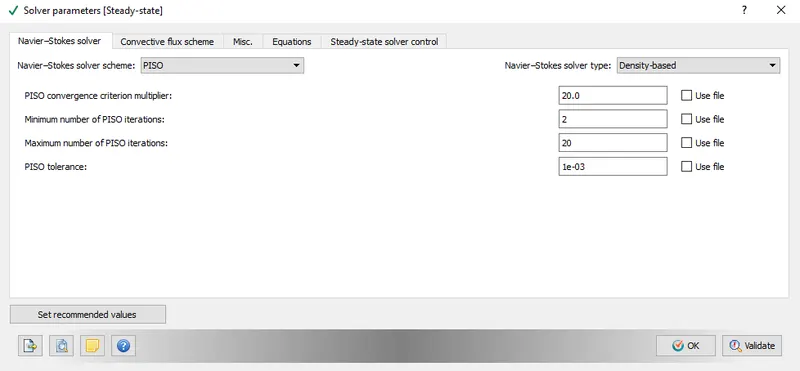
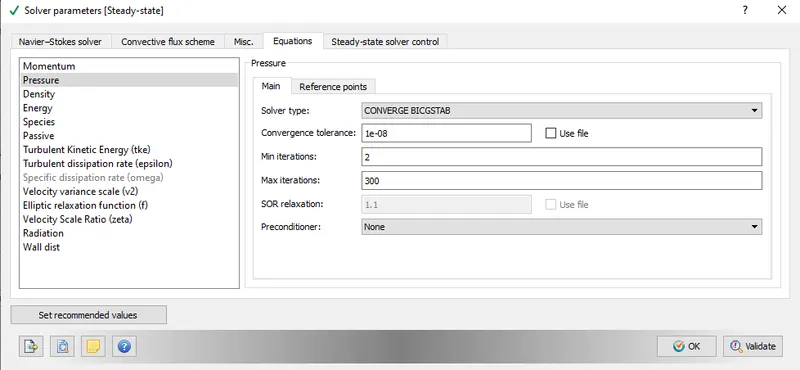
- Solver parameter
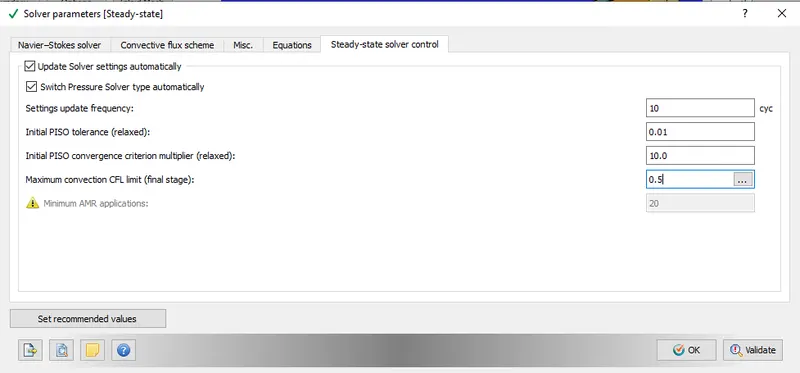
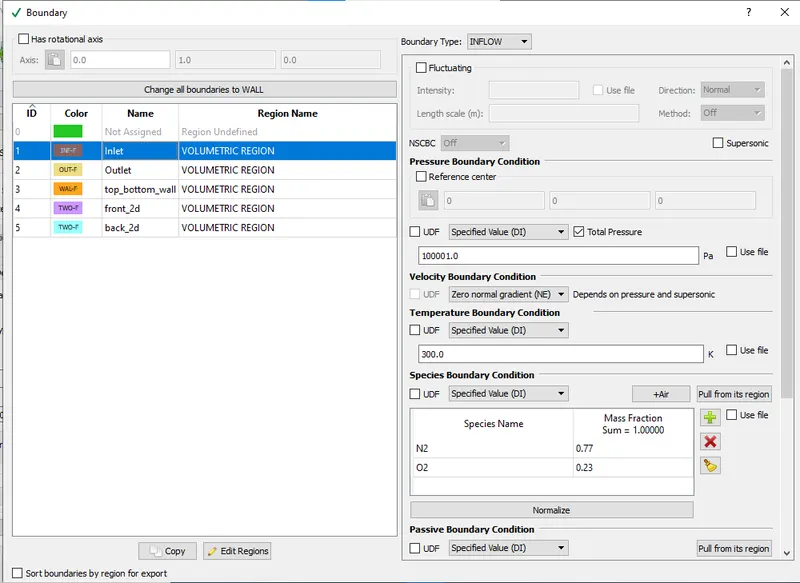
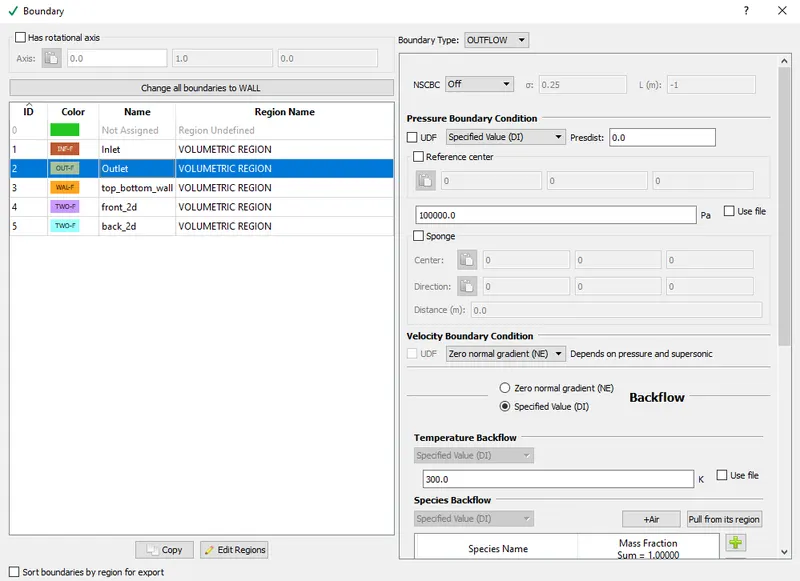
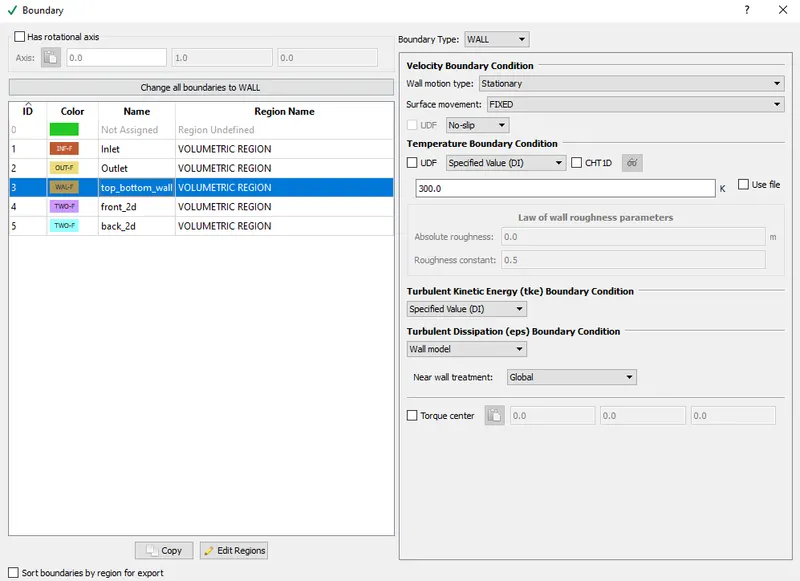
- Boundary conditions
- Inlet
- Outlet
- Top and bottom surface
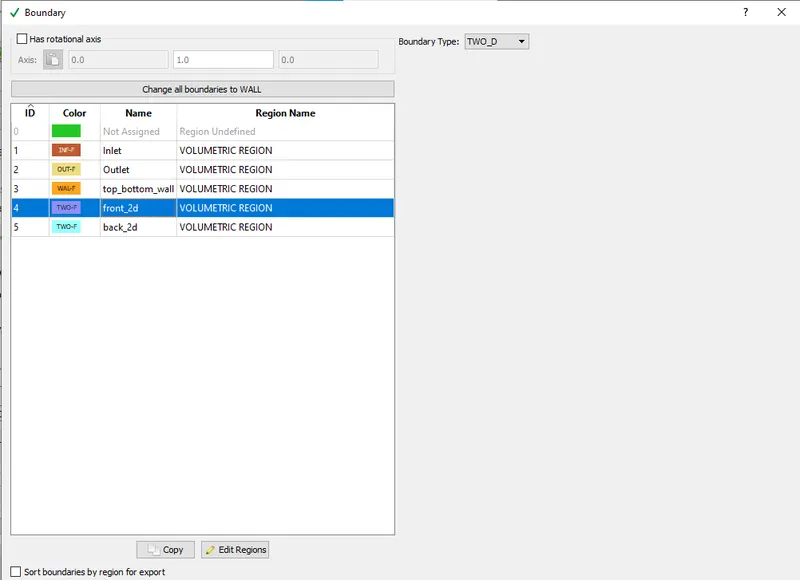
- Front 2D
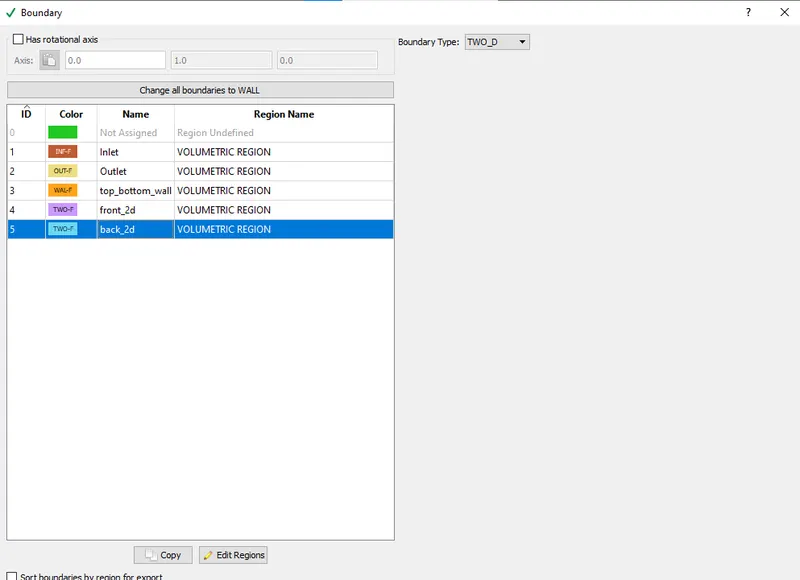
- Back 2D
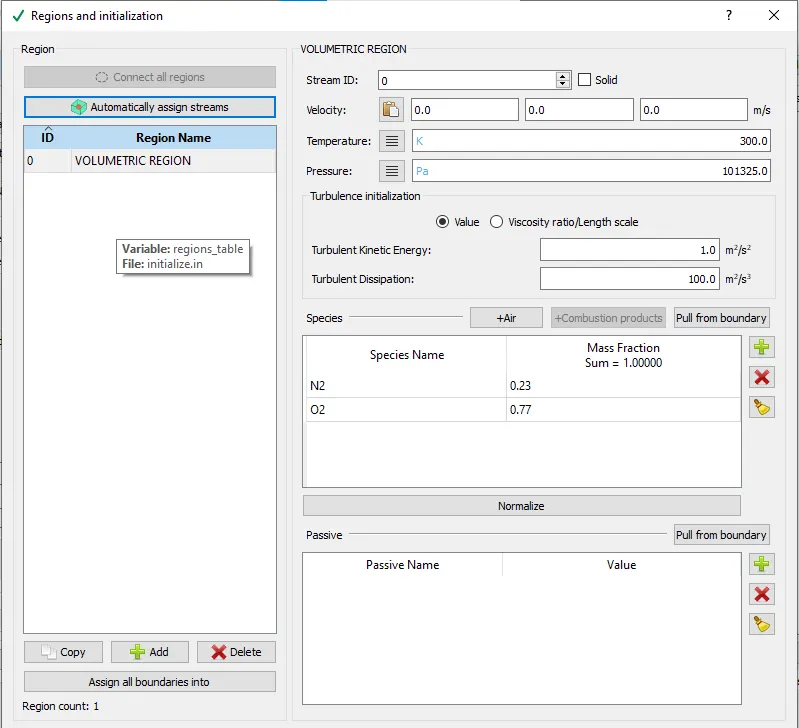
- Region and initialization
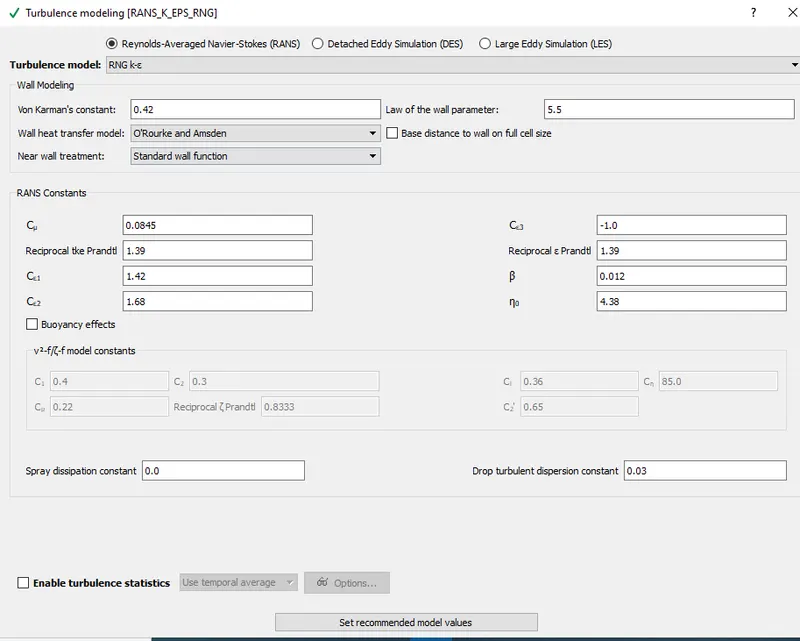
- Turbulence modeling
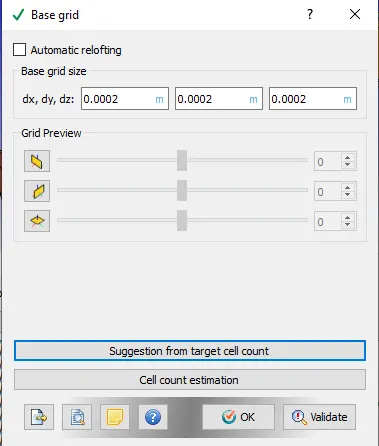
- Base grid (it is changed for different cases)
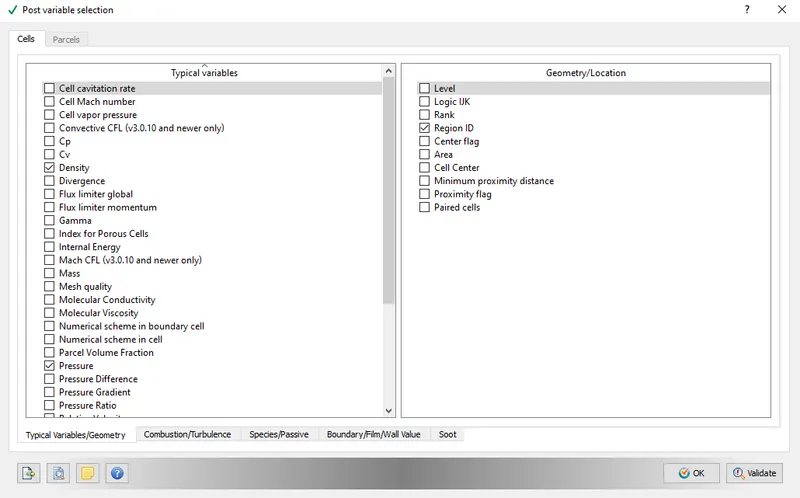
- Post variable selection
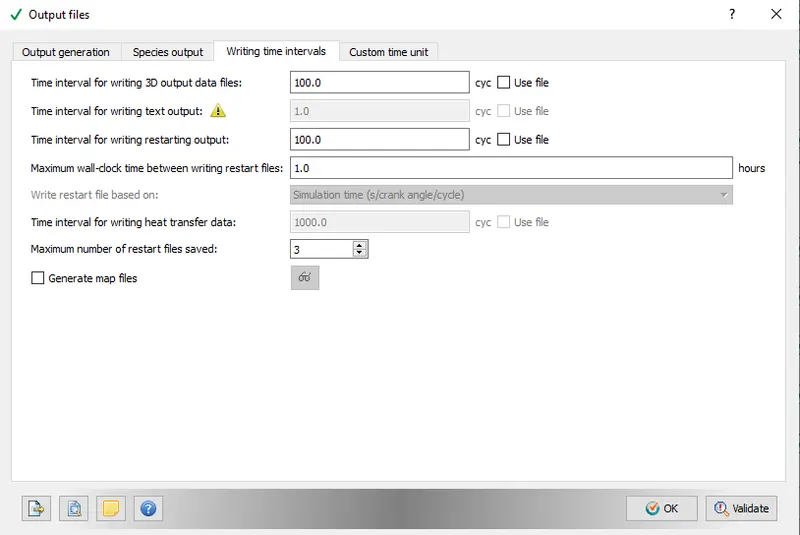
- Output files
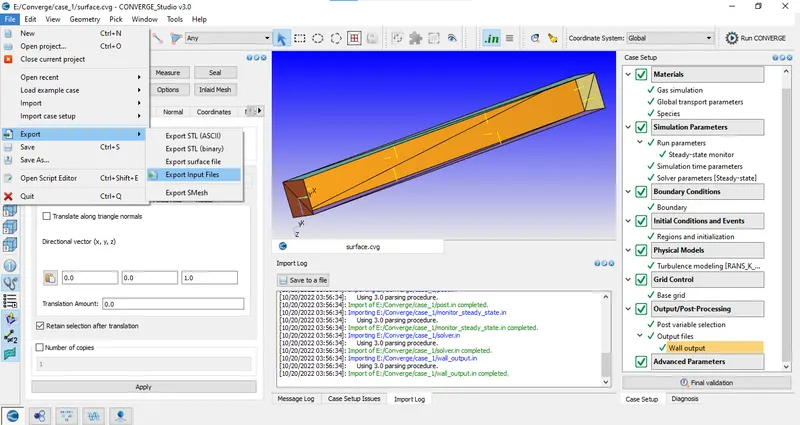
- Export input files to directory
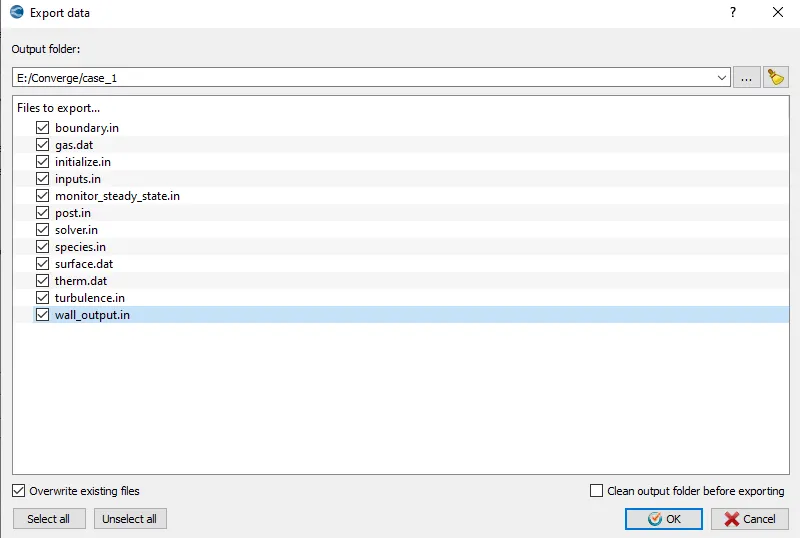
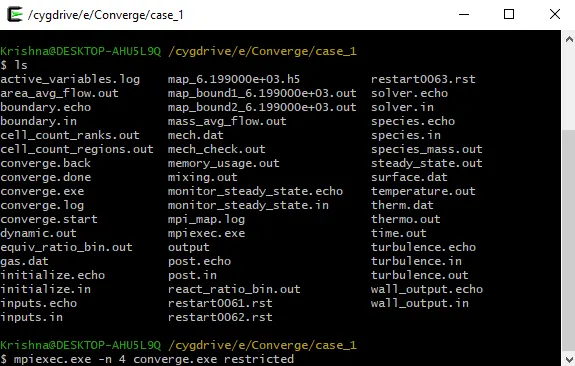
- Run simulation in Cygwin
- Post process the result in ParaView
- Inlet
Output for all cases
case 1
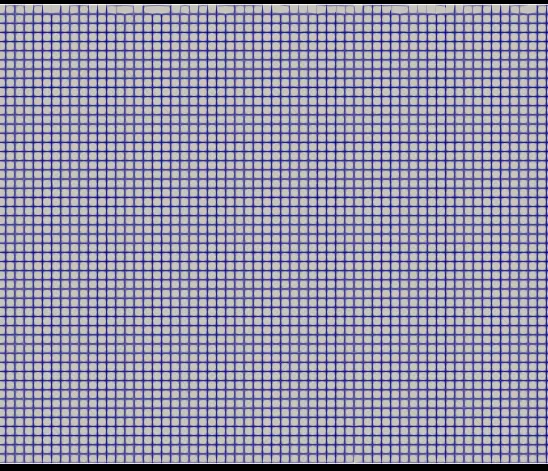
mesh size 2e-4
velocity contour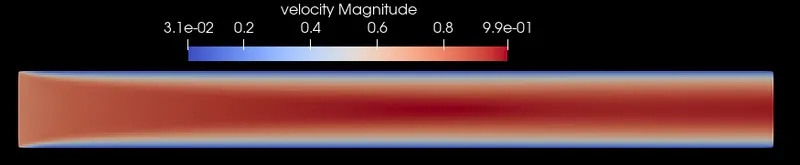
pressure contour

velocity plot
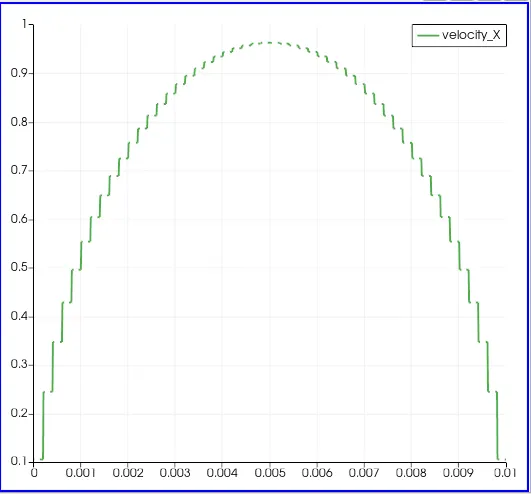
We can see that velocity profile is creating a parabolic shape.
Mass flow rate
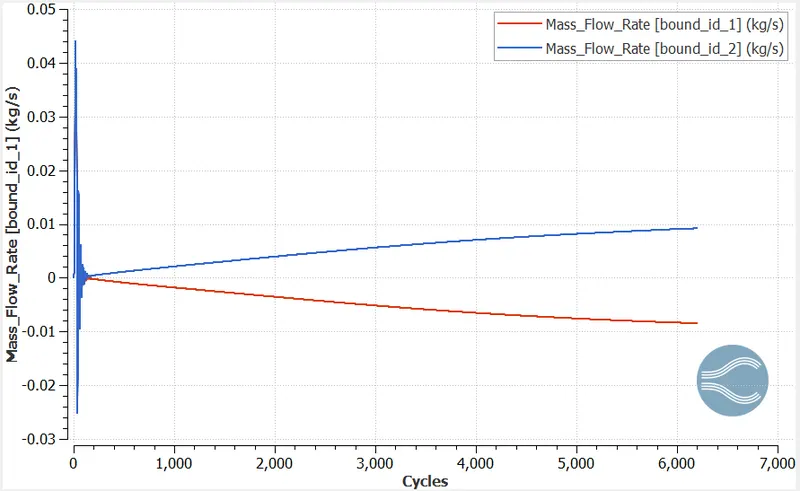
At inflow mass flow rate is heading negative but in outflow mass flow rate is positive.
Total cell plot
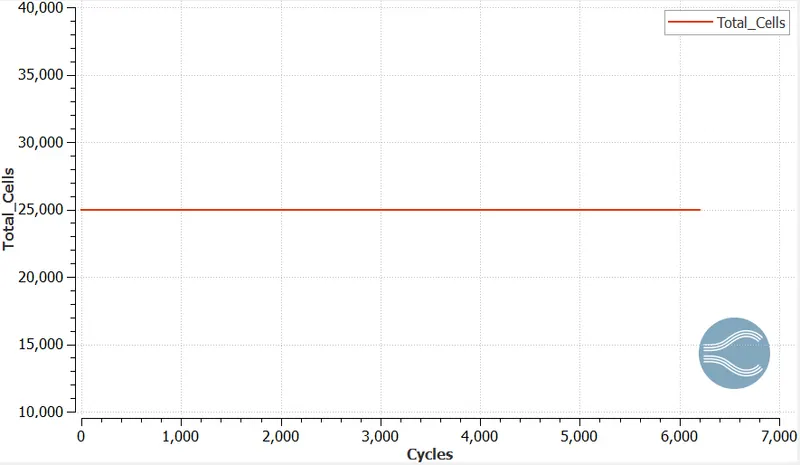
No. of cells in the first case is 25000.
pressure plot
Static
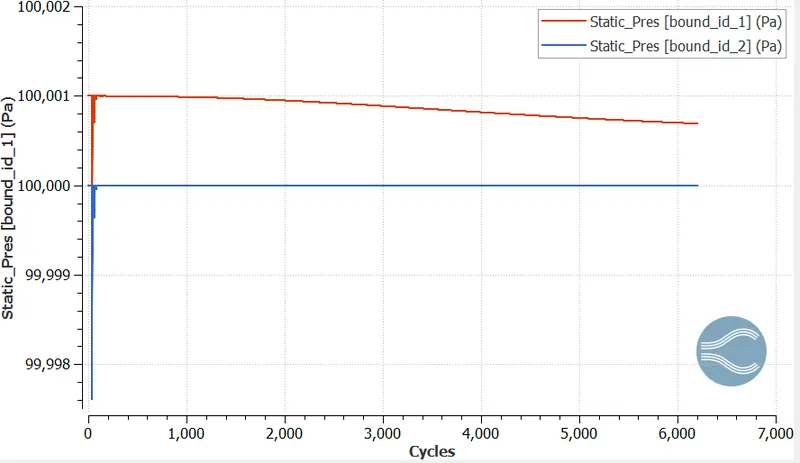
The static pressure at the inlet is 100001 and at outlet 100000 pascal. but at inlet it is slightly decreasing with increase in no. of cycles.
Total pressure
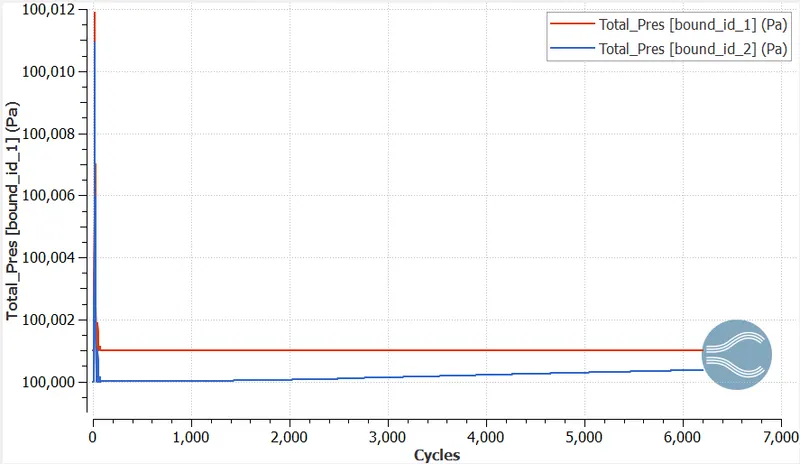
Total pressure at the inlet is 100001 throughout the simulation but at outlet pressure is increasing slowly.
Case 2
mesh size 1.5e-4

Velocity contour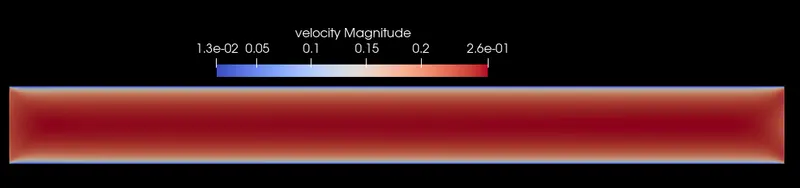
Pressure contour
Velocity profile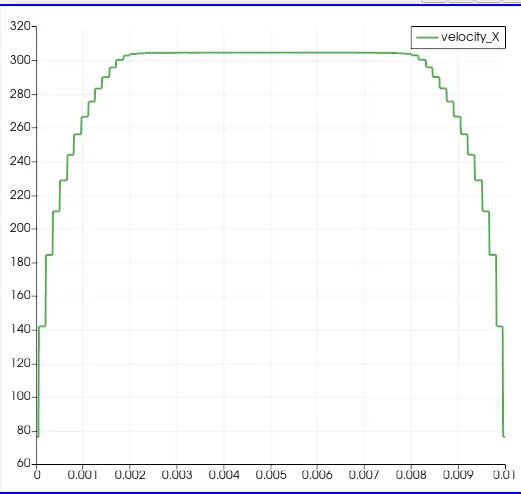
Mass flow ate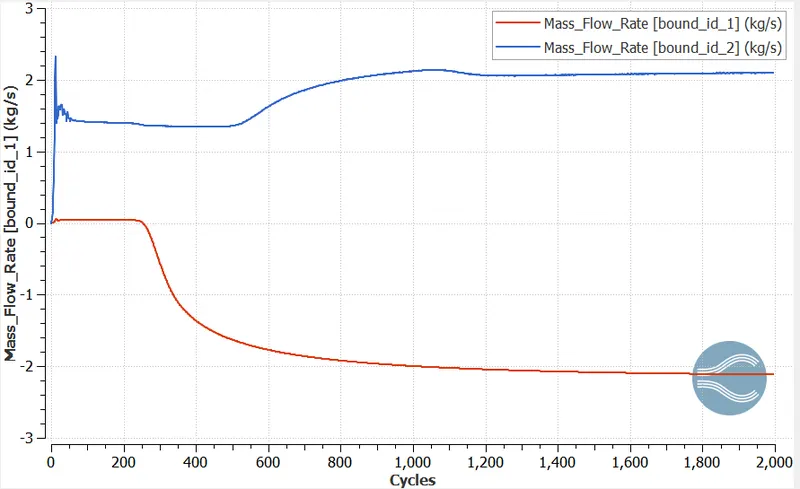
Total pressure 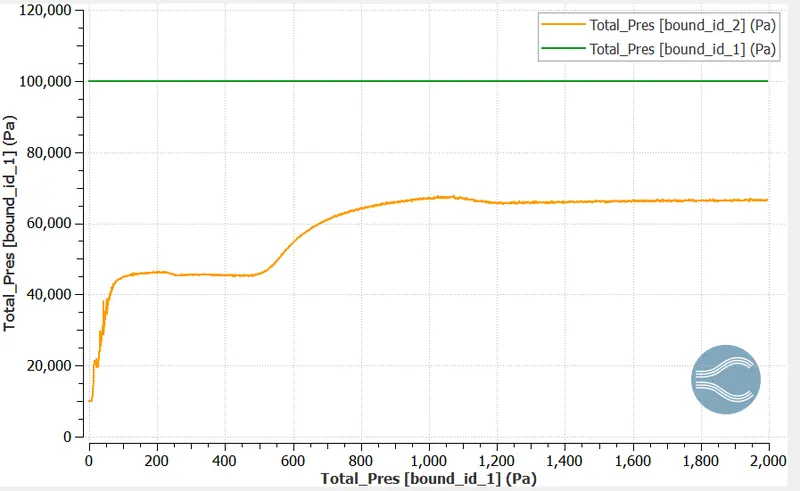
Static pressure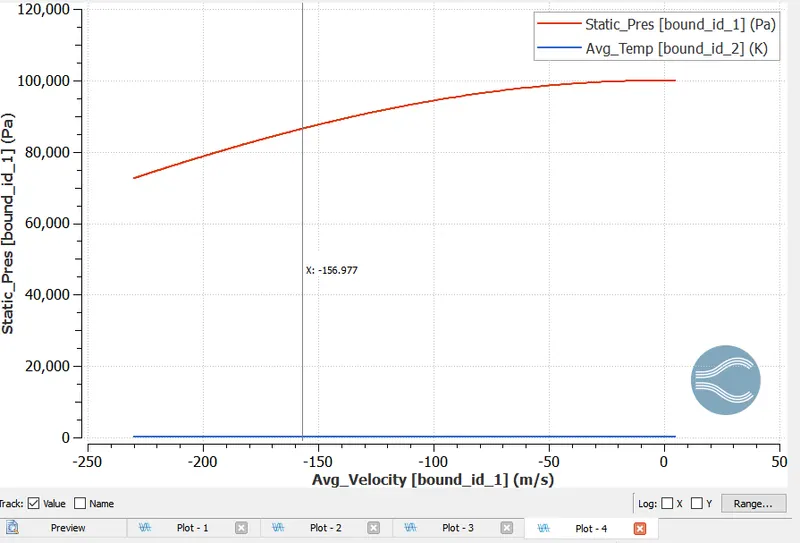
Total cell count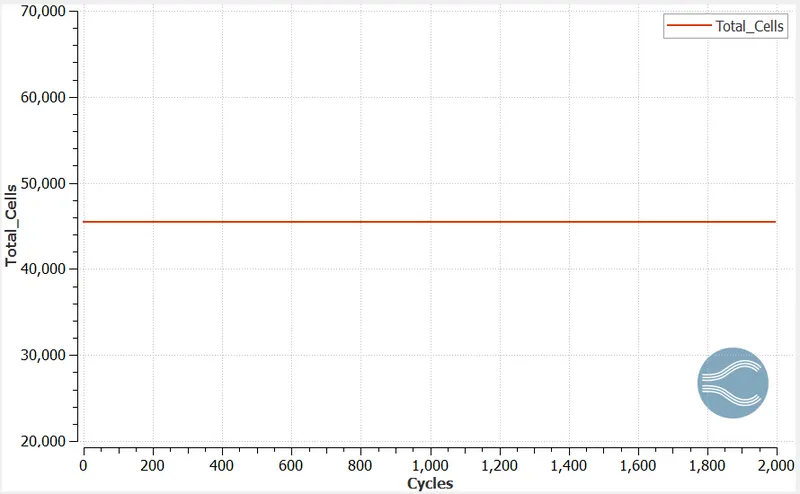
Case 3
mesh size 1e-4

velocity contour
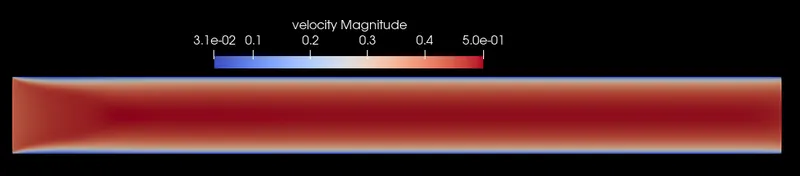
Pressure contour

Velocity plot
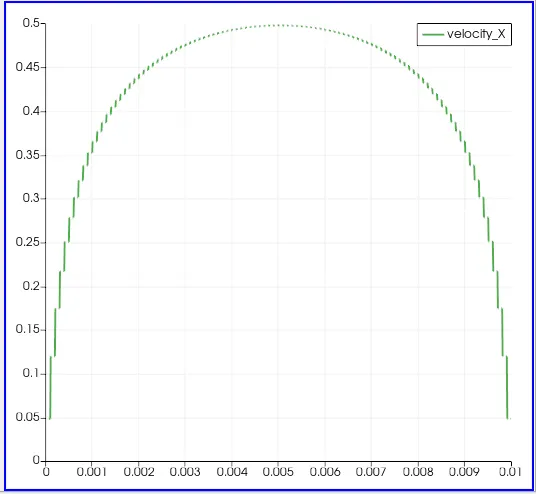
We can see that velocity profile is creating a parabolic shape.
mass flow rate plot
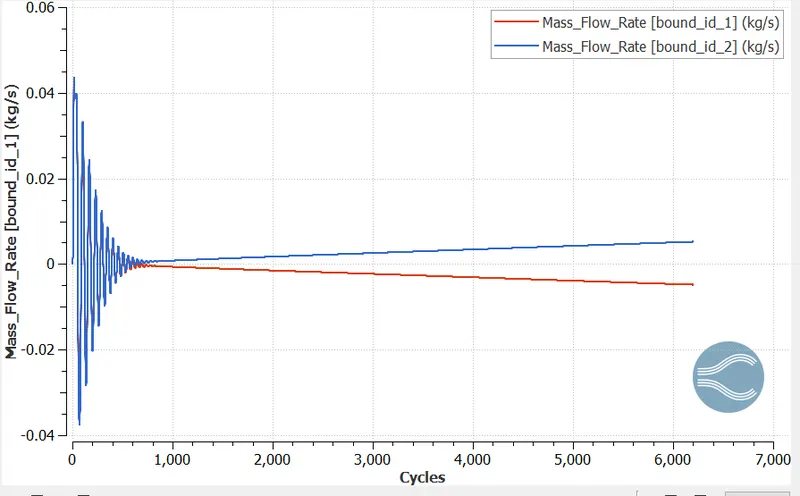
At inflow mass flow rate is heading negative but in outflow mass flow rate is positive.
total cell count plot
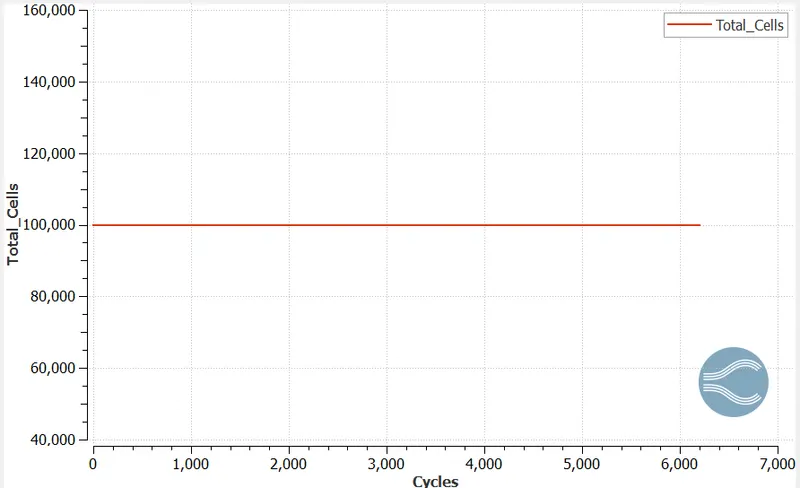
no. of cells in case 3 is 100000.
Pressure plot
Static pressure
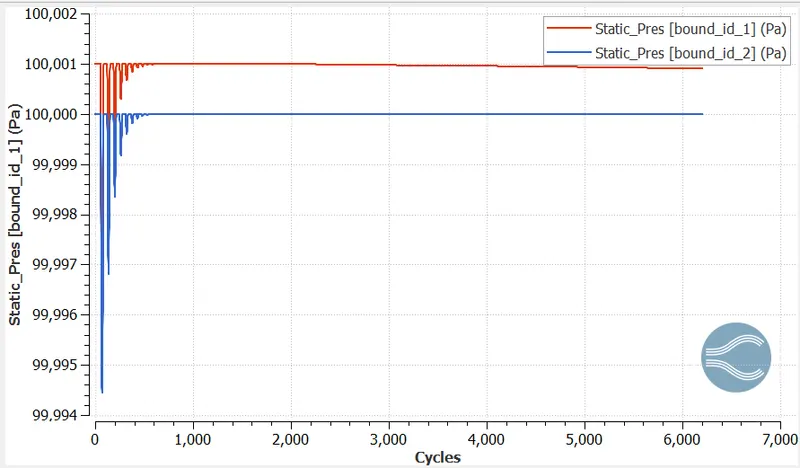
The static pressure at the inlet is 100001 and at outlet 100000 pascal. but at inlet it is slightly decreasing with increase in no. of cycles.
Total pressure
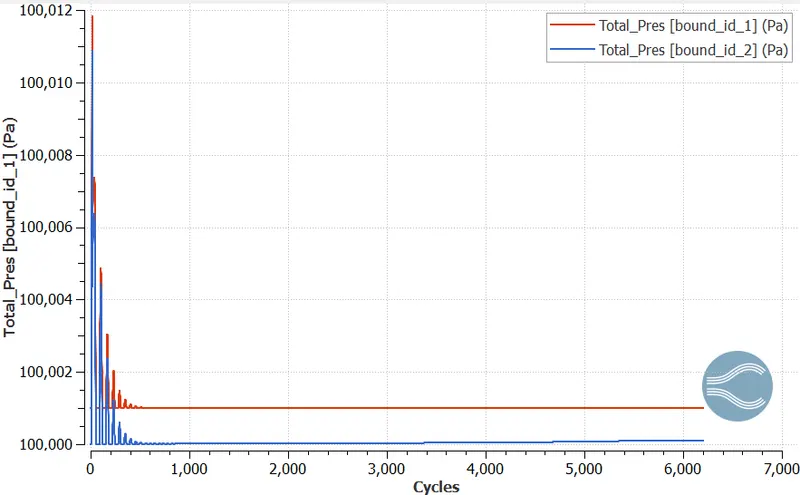
Total pressure at the inlet is 100001 throughout the simulation but at outlet pressure is increasing slightly.