Supervised Learning - Prediction Week 3 Challenge
1. Perform Gradient Descent in Python with any loss function?
A. Attached a Python Notebook.
2. Difference between L1 & L2 Gradient descent method
A. L1 Gradient Descent: In this , we are trying to minimize the Mean Absolute error. We are tryinng to find a point where slope value is infinity, because the curve shape is 'V'. It is sum of absolute values of weights and multiple solutions are possible.
L2 Gradient descent : In this, we are trying to minimize the Mean Square error. We are tryinng to find a point where slope value is zero., because the ccurve shape is 'U'. It is Sum of square of weights and only one solution is possible.
3. What are the different loss functions for regression
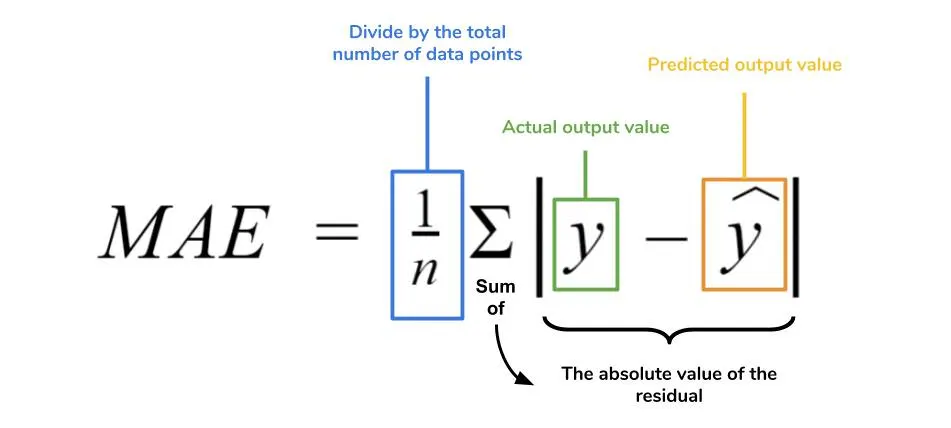
A. 1. Mean Absolute Error : MAE is the simplest error function, it is defined as the absolute difference between the actual and predicted values and takes it’s mean.
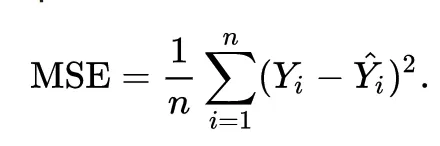
2. Mean Square Error : is defined as Mean or Average of the square of the difference between actual and estimated values.
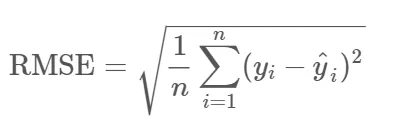
3. Root Mean Square Error : It is just the square root of MSE, which means, it is again, a linear scoring method, but still better than MAE as it gives comparatively more weightage to larger errors.
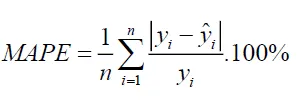
4. Mean Absolute Percentage Error: It is Similar to the Mean absolute error, but it calculates the value in Percentage instead of values.
4. What is the importance of learning rate
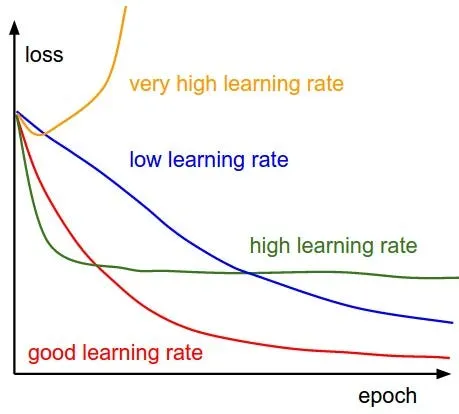
A. This parameter determines how fast or slow we will move towards the optimal weights. If the learning rate is very large we will skip the optimal solution. If it is too small we will need too many iterations to converge to the best values. So using a good learning rate is crucial.
5. How to evaluate linear regression
A. There are 3 main metrics for model evaluation in regression:
- R Square/Adjusted R Square.
- Mean Square Error(MSE)/Root Mean Square Error(RMSE)
- Mean Absolute Error(MAE)
1. R Square / Adjusted R Square: It measures how much variability in dependent variable can be explained by the model. It is the square of the Correlation Coefficient(R) and that is why it is called R Square.

R Square is a good measure to determine how well the model fits the dependent variables. However, it does not take into consideration of overfitting problem.
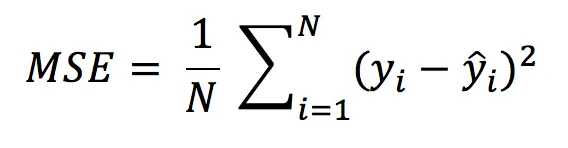
2. Mean Square Error(MSE)/Root Mean Square Error(RMSE) : MSE is calculated by the sum of square of prediction error which is real output minus predicted output and then divide by the number of data points. It gives you an absolute number on how much your predicted results deviate from the actual number.
3. Mean Absolute Error(MAE) : It is similar to Mean Square Error(MSE). However, instead of the sum of square of error in MSE, MAE is taking the sum of the absolute value of error. Compare to MSE or RMSE, MAE is a more direct representation of sum of error terms.
6. What is the difference between multiple and adjusted coefficient of determination
A. R squared (R2) : It is a statistical measure that represents the proportion of the variance for a dependent variable that's explained by an independent variable or variables in a regression model. R-squared explains to what extent the variance of one variable explains the variance of the second variable. So, if the R2 of a model is 0.50, then approximately half of the observed variation can be explained by the model's inputs.
Adjusted R2 error:
R2 shows how well terms (data points) fit a curve or line. Adjusted R2 also indicates how well terms fit a curve or line, but adjusts for the number of terms in a model. If you add more and more useless variables to a model, adjusted r-squared will decrease. If you add more useful variables, adjusted r-squared will increase.