Project 1 - Parsing NASA thermodynamic data
AIM: To Write a program to file parsing the NASA thermodynamic data and calculate the Cp,H,S values.
OBJECTIVE:
- Write a function that extracts the 14 co-efficients and calculates the enthalpy, entropy and specific heats for all the species in the data file.
-
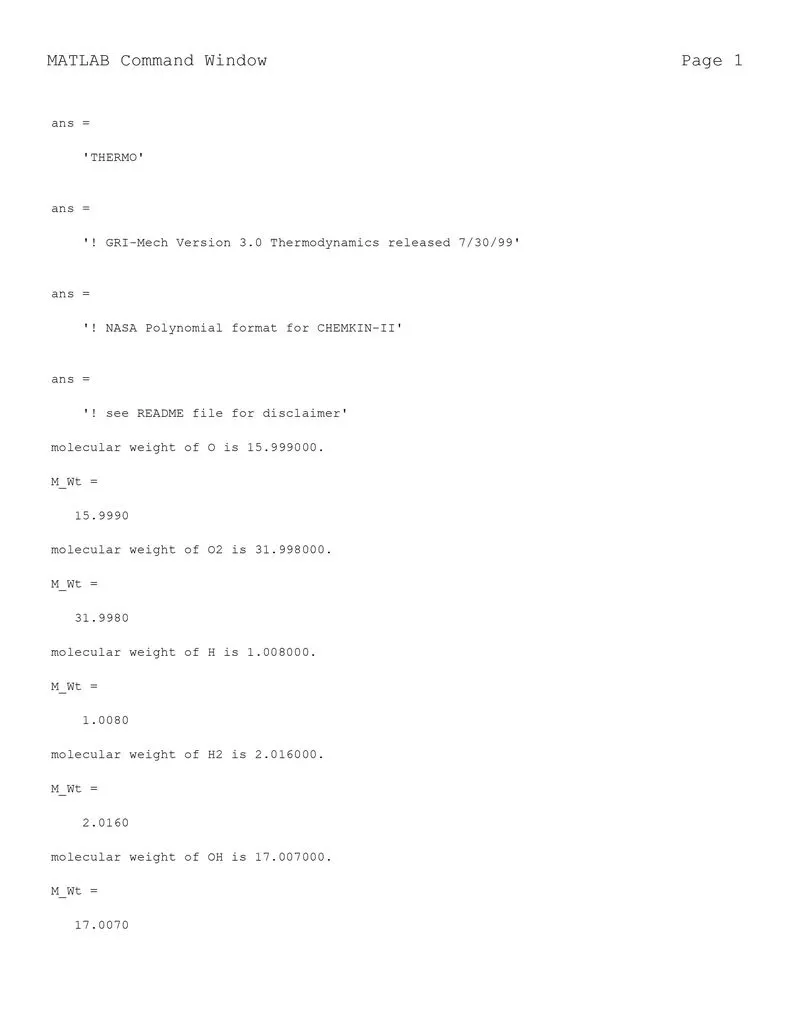
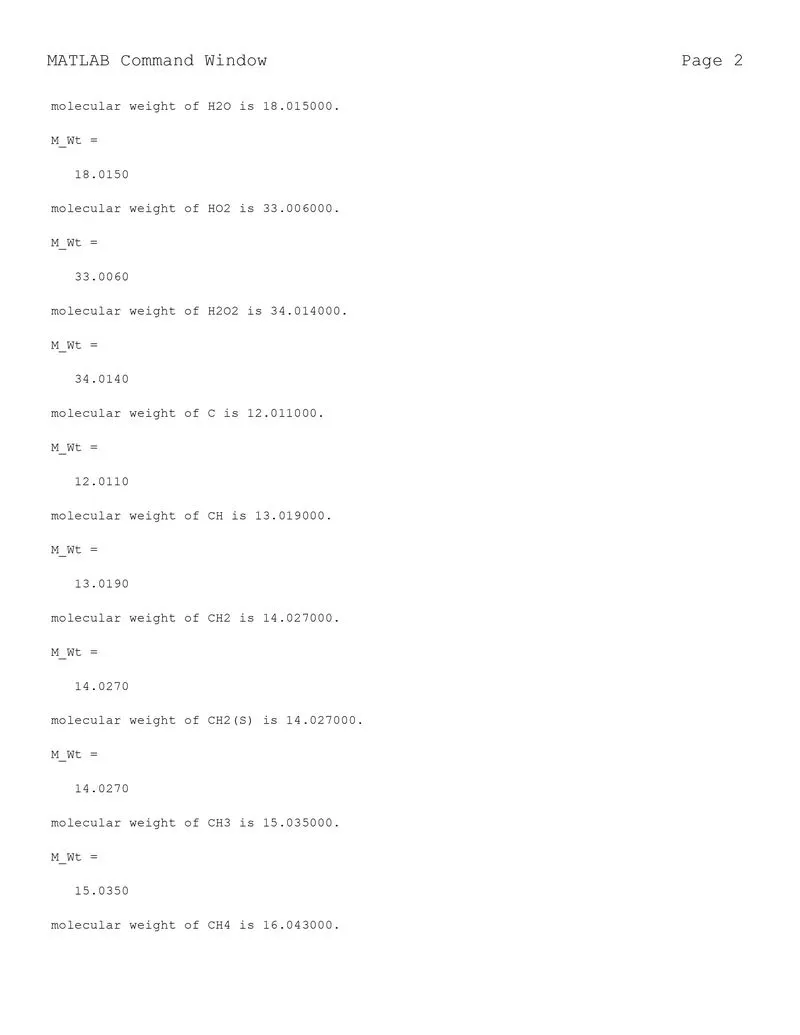
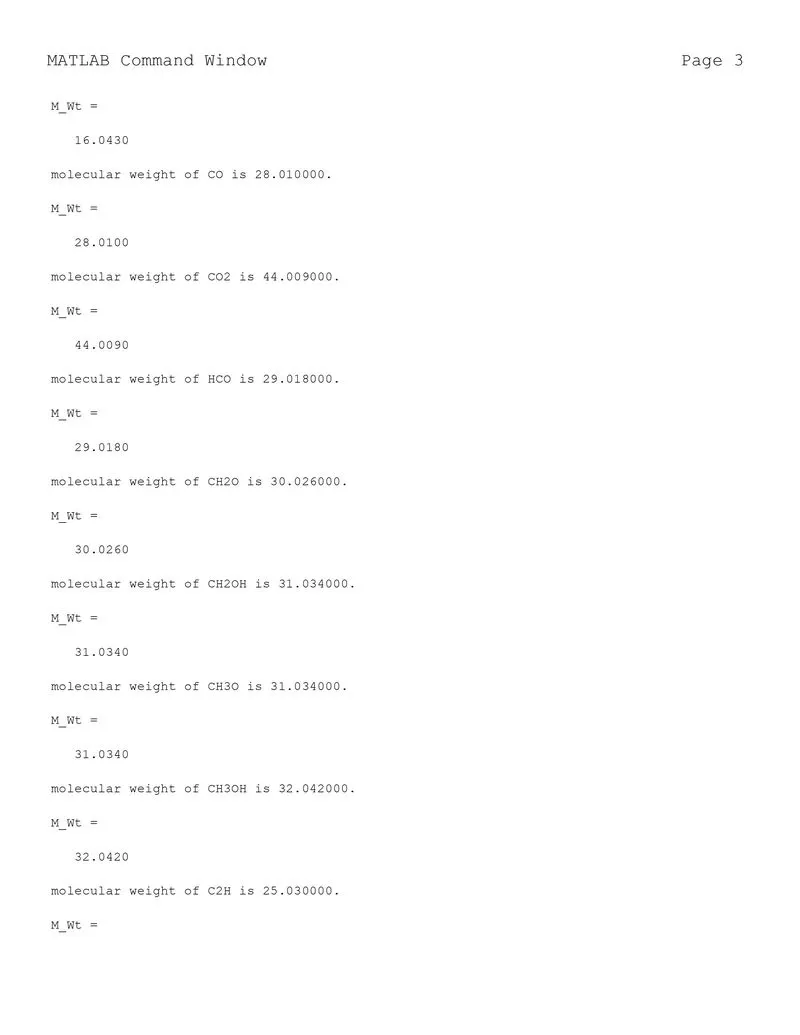
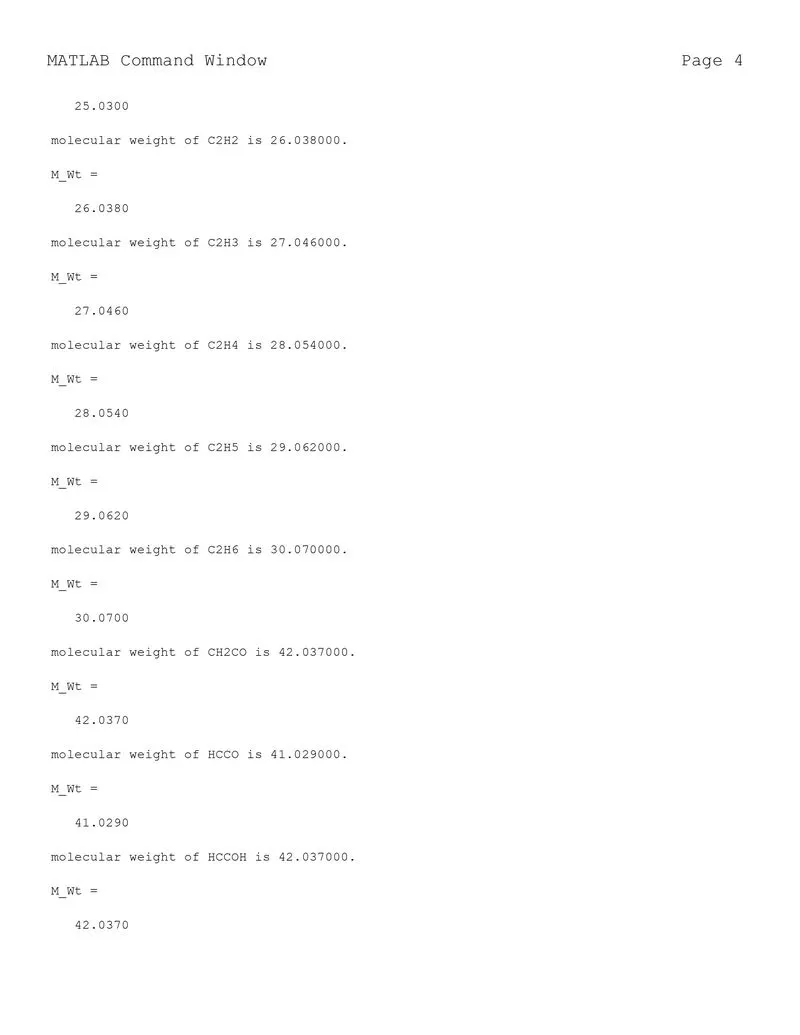
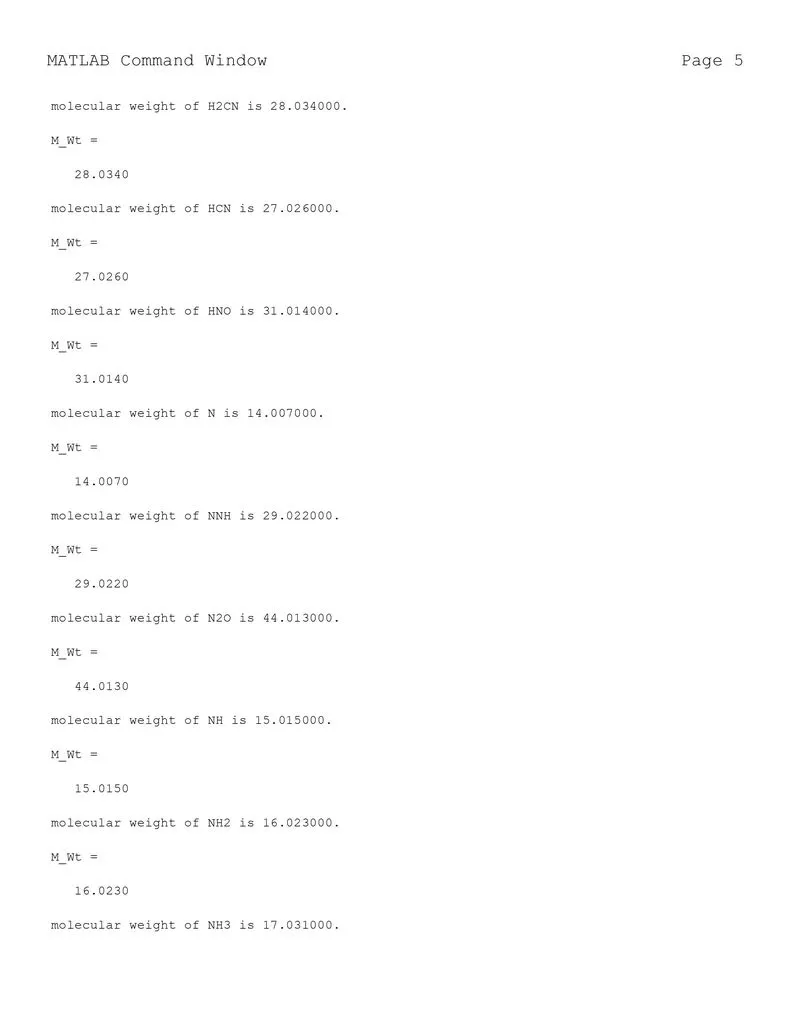
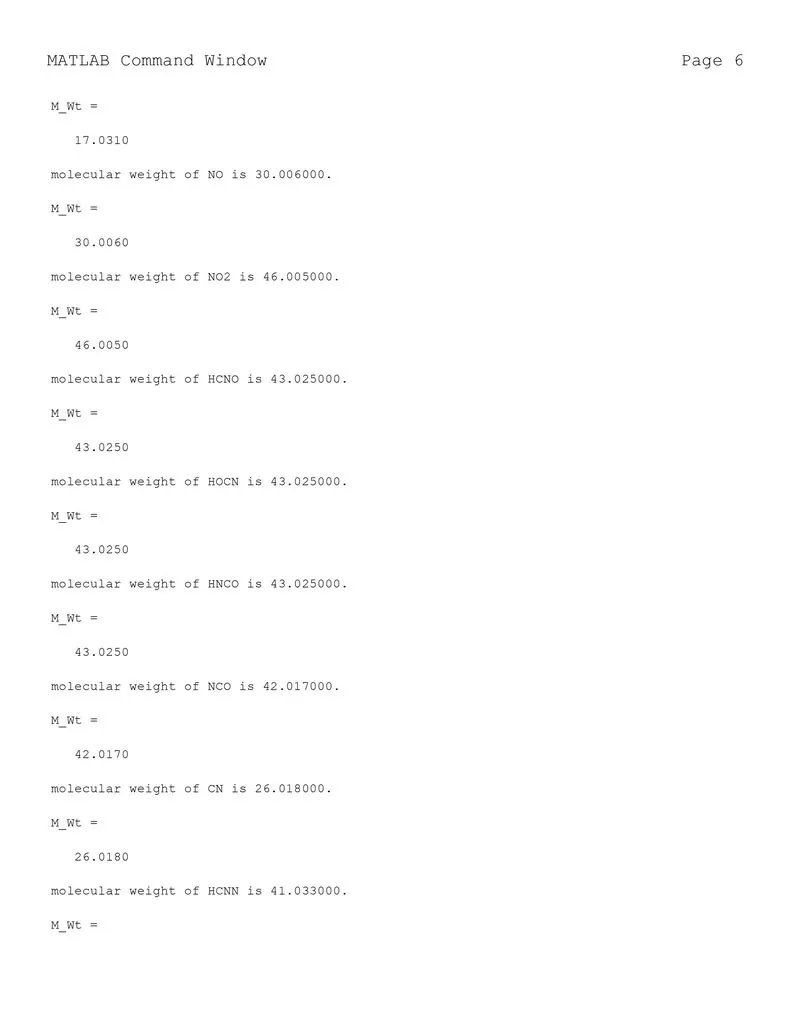
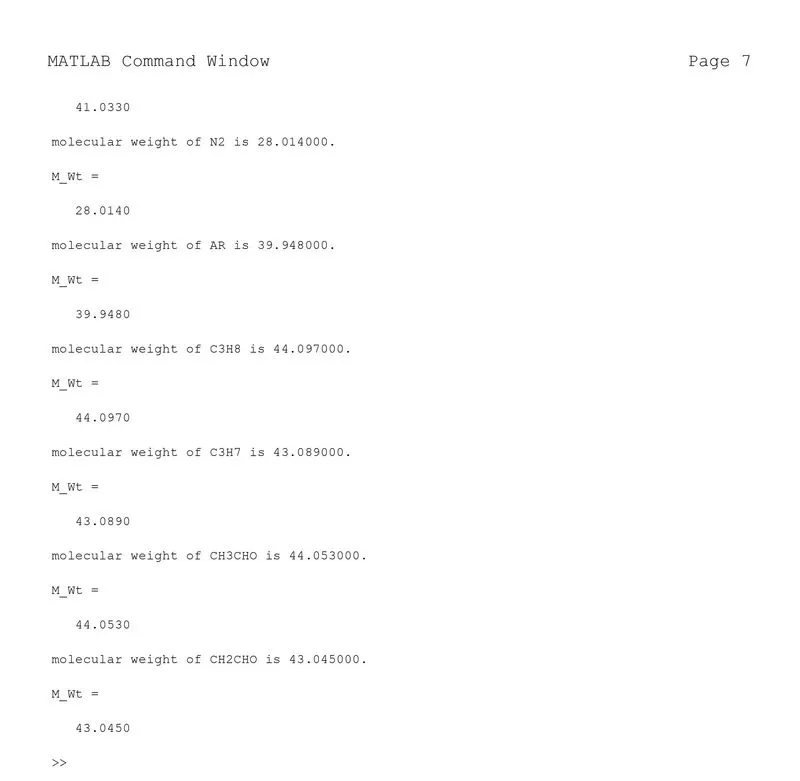
Calculate the molecular weight of each species and display it in the command window.
-
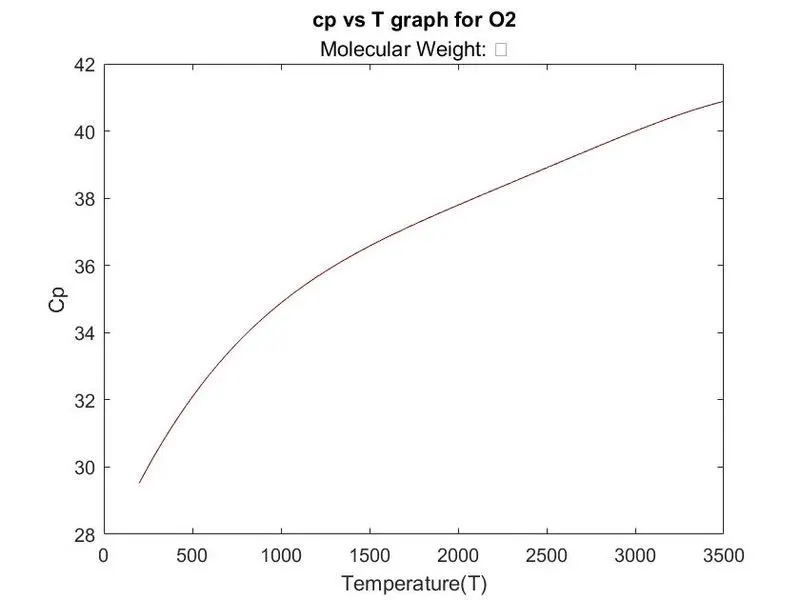
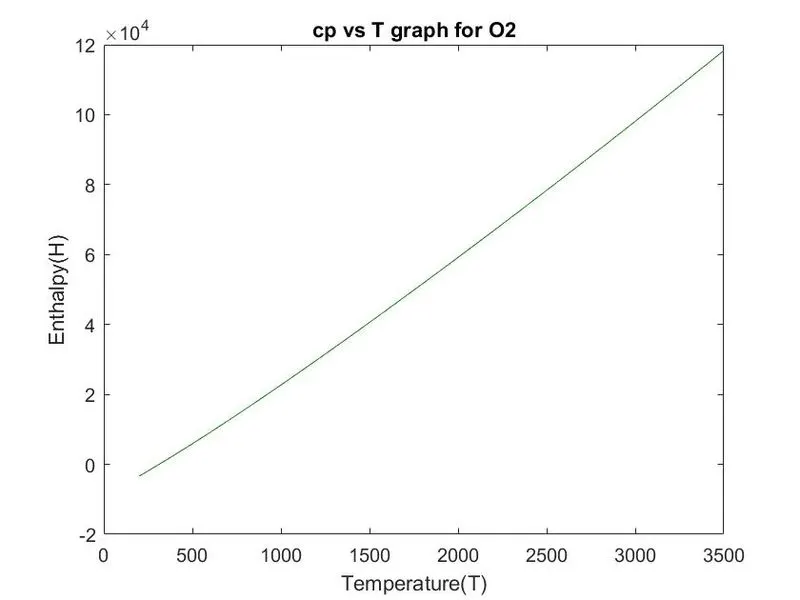
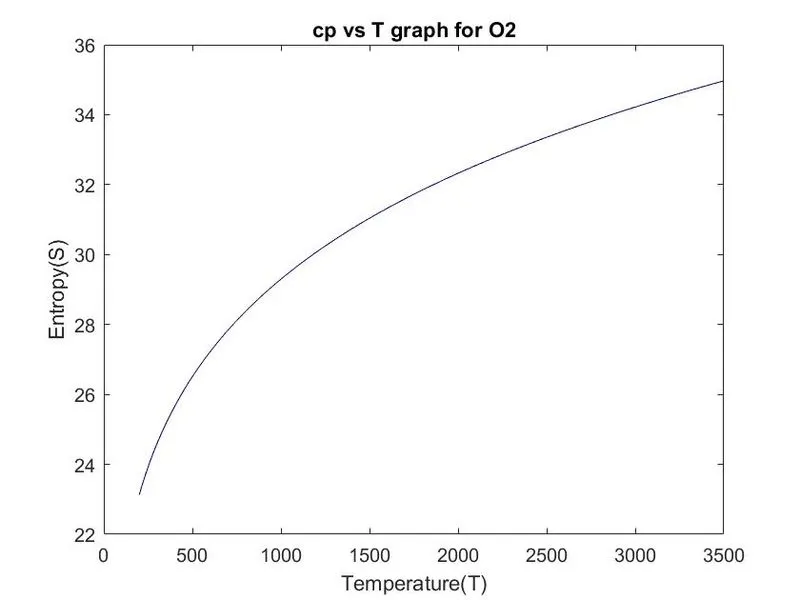
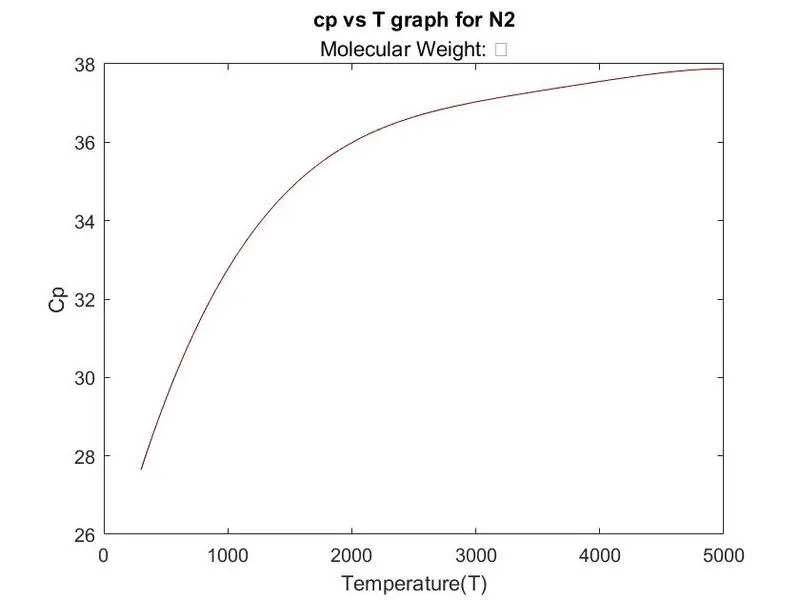
Plot the Cp, Enthalpy and Entropy for the local temperature range (low temperature : high temperature) specific for each species.
-
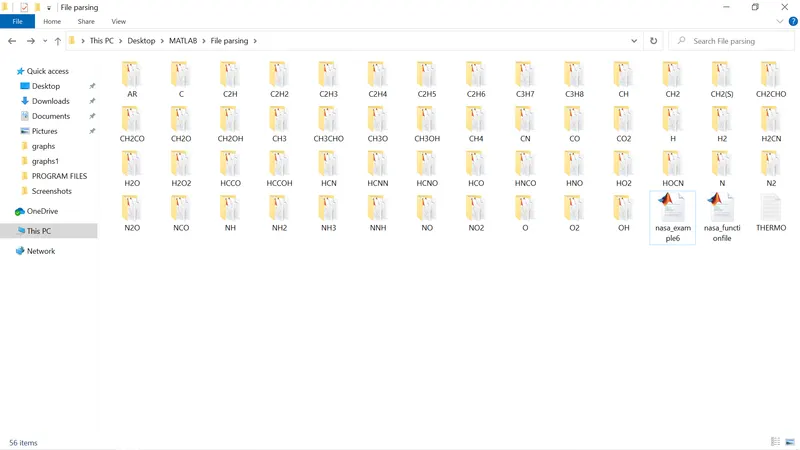
Save the plots as images with appropriate names and dump them in separate folders for each species with suitable name. All these should be generated automatically.
THEORY:
What is file parsing ?
- File parsing refers how the information can be read from a particular file.
- Here we extract the data from the given thermodynamic data file and will calculate the enthalpy,entropy and specific heat for all the species in data file.Also we calculate the molecular weight of each species.
- We plot the graphs for each species and will be stored in a separate folder.
Formula used to calculate the Cp,H,S
Here the temperature variers, For the first 7 coefficients we use local high temperature and for the last 7 coefficients we use local low temperature.
For calculating Molecular weight for each species
Molecular weight=(Number of atoms)*(Atomic weight)
CODE:
Here we are explaining the code in sub parts , and how it works.
Program 1:
% To read the text and open it by using fopen command
f1 = fopen('THERMO.txt','r');
%For reading the line in file and global_temperature
fgetl(f1)
global_temperature = fgetl(f1);
Explanation:
- First we have to import the 'THERMO.txt' file to the program by using 'fopen' command.
- To read each and every line , we used 'fgetl' command.
Program 2:
%Spliting the above temperature values in to numberss and giving values
split_global = strsplit(global_temperature,' ');
global_low_temperature = str2num(split_global{2});
global_medium_temperature = str2num(split_global{3});
global_high_temperature = str2num(split_global{4})
Explanation:
- To obtain the temperature range from the Thermo.dat file, using ‘strsplit’ to split the temperature into a particular string cell.
- Use 'str2num' for converting string cell in to numbers.
- And we skip the first three statements by using the 'fgetl' command in the 'for' loop.
Program 3:
for a = 1:53
    header = fgetl(f1);
    split_global = strsplit(header);
    c = length(split_global);
    species_name = split_global{1};


    local_low_temperature = str2num(split_global{c-3});
    local_medium_temperature = str2num(split_global{c-1});
    local_high_temperature = str2num(split_global{c-2});

    p = 0;
Explanation:
- To read the 53 species, We used 'for' loop to read the temperature range , species name.
- To get the temperature range of the present species.
- For extracting the coefficients of each species we introduced another variable called it as 'p'.
- 'for' that we have started here will be continued till the end of the program.
Program 4:
% To get the coefficients for each species
    for rep = 1:3
        line = fgetl(f1);
        %for finding E
        sep = findstr(line,'E');
        c = length(sep);
        s = 0;
        % To get the coefficients in one line
        for a = p+1:p+c
            if a == p+1
                coeff(a) = str2num(line(1:sep(s+1)+3));
            else
                coeff(a) = str2num(line(sep(s)+4:sep(s+1)+3));
            end
            % Increment after reading each value
            s = s+1;
        end
        %Increment after reading each line
        p = p+5;
    end
Explanation:
- To get the 14 coefficients for all species we used an another 'for' loop.
- To get the co-effecients 'strfind' command is used find the variable'E'.
- We used 'if else' statement to find the coefficients to which it belongs.
- To get all these coefficients we need to convert into numbers by using 'str2num' command and by this we will get the temperature and coefficient of all the species.
- Assign variables for calculating the Cp,H,S.
Program 4:
 % To calculate cp,H,S for low to high temperatures
    T = linspace(c1,c3,4000);
for k = 1:length(T)

    if T(k) > c2
        % Formulas for cp,H,S
        cp = R.*(b(1) + b(2).*T + b(3).*T.^2 + b(4).*T.^3 + b(5).*T.^4);
        H = R.*(b(1) + (b(2).*T)/2 + (b(3).*T.^2)/3 + (b(4).*T.^3)/4 + (b(5).*T.^4)/5 + (b(6)./T)).*T;
        S = b(1).*log(T) + b(2).*T + (b(3).*T.^2)/2 + (b(4).*T.^3)/3 + (b(5).*T.^4)/4 + b(7);
    else
        cp = R.*(b(8) + b(9).*T + b(10).*T.^2 + b(11).*T.^3 + b(12).*T.^4);
        H = R.*(b(8) + (b(9).*T)/2 + (b(10).*T.^2)/3 + (b(11).*T.^3)/4 + (b(12).*T.^4)/5 + (b(13)./T)).*T;
        S = b(8).*log(T) + b(9).*T + (b(10).*T.^2)/2 + (b(11).*T.^3)/3 + (b(12).*T.^4)/4 + b(14);
    end
end
Explanation:
- To calculate Cp,H,S we are using the formula given above.
- Since we are using set of temperature values, Using 'linspace' specified the temperature range from low to high.and for splitting we assumed 4000 points.
- By using 'if else' command,The (T)> the local medium temperature we use first 7 coefficients or else last 7 coefficents, this loop will continue.
Program 5:
%saving the plots in the folder
   pwd = 'C:\Users\chakr\OneDrive\Desktop\MATLAB\File parsing';
   mkdir(species_name);
   cd(species_name);
Explanation:
- To create a separate folder for saving the graphs we used 'mkdir' command.In this the plots of all 53 species are saved.
- pwd command is used to identify the current directory.
- cd command is used to changhe the working directory.
- Now we are changing the dierectory using cd command and then we will save the plots as our images using save command
Program 6:
%plotting Cp vs T
   figure(1)
   plot(T,cp,'color',[0.5 0 0])
   title(['cp vs T graph for ',species_name],['Molecular Weight: ',M_Wt])
   xlabel('Temperature(T)')
   ylabel('Cp')
   saveas(figure(1),'Cp vs T')

   %plotting H vs T
   figure(2)
   plot(T,H,'color',[0 0.5 0])
   title(['cp vs T graph for ',species_name])
   xlabel('Temperature(T)')
   ylabel('Enthalpy(H)')
   saveas(figure(2),'H vs T')


   %plotting S vs T
   figure(3)
   plot(T,S,'color',[0 0 0.5])
   title(['cp vs T graph for ',species_name])
   xlabel('Temperature(T)')
   ylabel('Entropy(S)')
   saveas(figure(3),'S vs T')
Explanation:
- Plotting the Cp,H,S values with rerspect to temperature.
- And giving the title and labels and save the plots for each species.
- Finally 'for' will be ended here.
Program 7:
%Calculating molecular weight
 M_Wt = nasa_functionfile(species_name)
Explanation:
- For calculating the molecular weight we had written another function program and calling it into main program.
- This function program will be explained below.
Main Program:
%A Program to file parsing the NASA thermodynamic data to calculate the
%Specific heat,Enthalpy,Entropy values

clear all
close all
clc
% To read the text and open it by using fopen command
f1 = fopen('THERMO.txt','r');
%For reading the line in file and global_temperature
fgetl(f1)
global_temperature = fgetl(f1);
%Spliting the above temperature values in to numberss and giving values
split_global = strsplit(global_temperature,' ');
global_low_temperature = str2num(split_global{2});
global_medium_temperature = str2num(split_global{3});
global_high_temperature = str2num(split_global{4});

% to skip the 1st 3 lines
for a = 1:3
    fgetl(f1)
end
%To read the 53 species
for a = 1:53
    header = fgetl(f1);
    split_global = strsplit(header);
    c = length(split_global);
    species_name = split_global{1};


    local_low_temperature = str2num(split_global{c-3});
    local_medium_temperature = str2num(split_global{c-1});
    local_high_temperature = str2num(split_global{c-2});

    p = 0;

    % To get the coefficients for each species
    for rep = 1:3
        line = fgetl(f1);
        %for finding E
        sep = findstr(line,'E');
        c = length(sep);
        s = 0;
        % To get the coefficients in one line
        for a = p+1:p+c
            if a == p+1
                coeff(a) = str2num(line(1:sep(s+1)+3));
            else
                coeff(a) = str2num(line(sep(s)+4:sep(s+1)+3));
            end
            % Increment after reading each value
            s = s+1;
        end
        %Increment after reading each line
        p = p+5;
    end

    %Assinging variables
   c1 = local_low_temperature;
   c2 = local_medium_temperature;
   c3 = local_high_temperature;
   R = 8.31446;
   b = coeff;

   % To calculate cp,H,S for low to high temperatures
    T = linspace(c1,c3,4000);
for k = 1:length(T)

    if T(k) > c2
        % Formulas for cp,H,S
        cp = R.*(b(1) + b(2).*T + b(3).*T.^2 + b(4).*T.^3 + b(5).*T.^4);
        H = R.*(b(1) + (b(2).*T)/2 + (b(3).*T.^2)/3 + (b(4).*T.^3)/4 + (b(5).*T.^4)/5 + (b(6)./T)).*T;
        S = b(1).*log(T) + b(2).*T + (b(3).*T.^2)/2 + (b(4).*T.^3)/3 + (b(5).*T.^4)/4 + b(7);
    else
        cp = R.*(b(8) + b(9).*T + b(10).*T.^2 + b(11).*T.^3 + b(12).*T.^4);
        H = R.*(b(8) + (b(9).*T)/2 + (b(10).*T.^2)/3 + (b(11).*T.^3)/4 + (b(12).*T.^4)/5 + (b(13)./T)).*T;
        S = b(8).*log(T) + b(9).*T + (b(10).*T.^2)/2 + (b(11).*T.^3)/3 + (b(12).*T.^4)/4 + b(14);
    end
end
%Calculating molecular weight
 M_Wt = nasa_functionfile(species_name)


 %saving data file

 %saving the plots in the folder
   pwd = 'C:\Users\chakr\OneDrive\Desktop\MATLAB\File parsing';
   mkdir(species_name);
   cd(species_name);


    %plotting Cp vs T
   figure(1)
   plot(T,cp,'color',[0.5 0 0])
   title(['cp vs T graph for ',species_name],['Molecular Weight: ',M_Wt])
   xlabel('Temperature(T)')
   ylabel('Cp')
   saveas(figure(1),'Cp vs T')

   %plotting H vs T
   figure(2)
   plot(T,H,'color',[0 0.5 0])
   title(['cp vs T graph for ',species_name])
   xlabel('Temperature(T)')
   ylabel('Enthalpy(H)')
   saveas(figure(2),'H vs T')


   %plotting S vs T
   figure(3)
   plot(T,S,'color',[0 0 0.5])
   title(['cp vs T graph for ',species_name])
   xlabel('Temperature(T)')
   ylabel('Entropy(S)')
   saveas(figure(3),'S vs T')

  %To change the working directory
  chdir('C:\Users\chakr\OneDrive\Desktop\MATLAB\File parsing')

end
Function Program:
To calculate the molecular weight, The code is written below.
% For calculating molecular weight.

function Molecular_weight = Molecularweight(species_name)
         %  Atomic Name
         atomic_name = ['H','C','O','N','A'];
         % Hydrogen, Carbon, Oxygen, Nitrogen, Argon

         %  Atomic weight
         Atomic_Weight = [1.008 12.011 15.999 14.007 39.948];

         Molecular_weight = 0;

         % Adding Atomic number to obtain particular value
        for a = 1:length(species_name)
            for b = 1:length(atomic_name)
                if strcmpi(species_name(a),atomic_name(b))
                        Molecular_weight = Molecular_weight +Atomic_Weight(b);
                    position = b;
                end
            end
            n = str2num(species_name(a));

            if n>1

                Molecular_weight = Molecular_weight + Atomic_Weight(position)*(n-1);

            end
        end
            fprintf('molecular weight of %s is %f.',species_name,Molecular_weight);
            disp(' ');
end
Explanation:
-
By using the above funtion code we can calculate the molecular weight of all the species by giving the atomic weight and atomic name as inputs.
-
Then we make use of for loop to calculate the molecular weight of each species individually.
-
we used strcmp command to compare the species with the elements and calculate their molecular weight.
-
And the string is converted to number by using str2num command.
OUTPUTS:
1) Graphs of O2,
2) Graphs of N2:
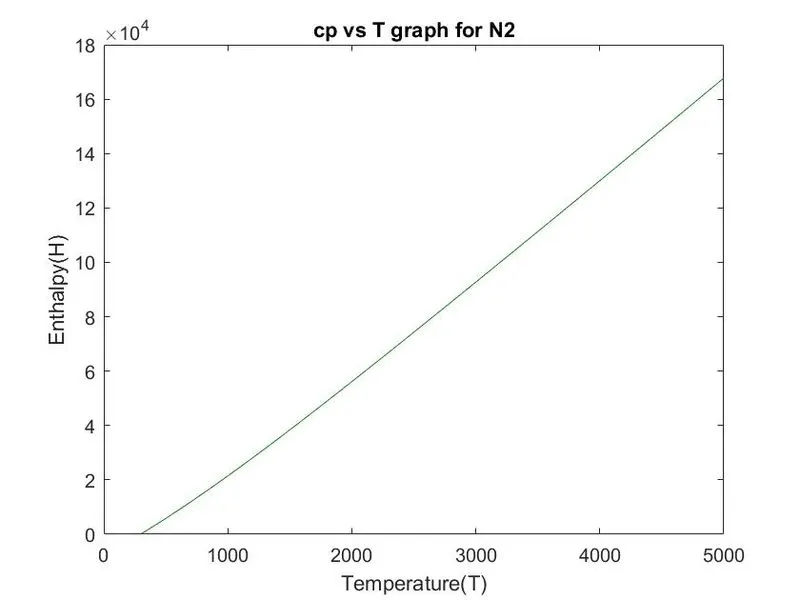
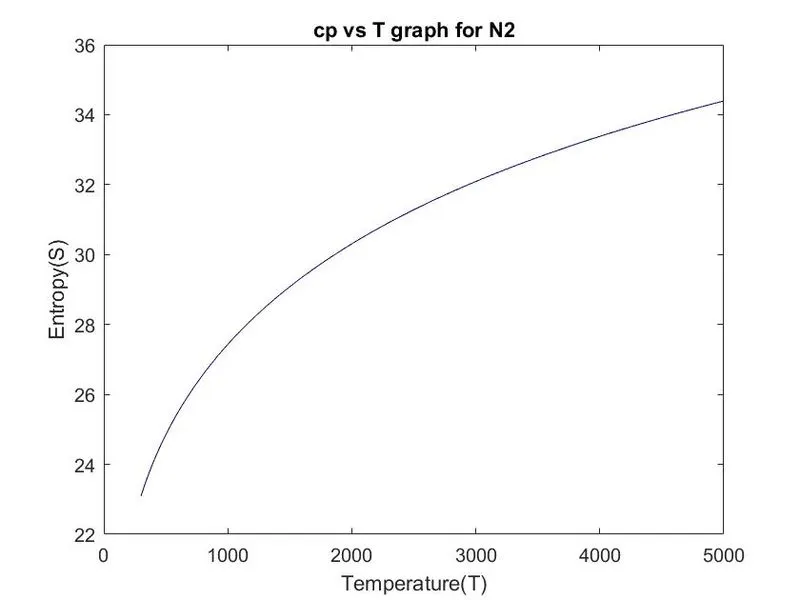
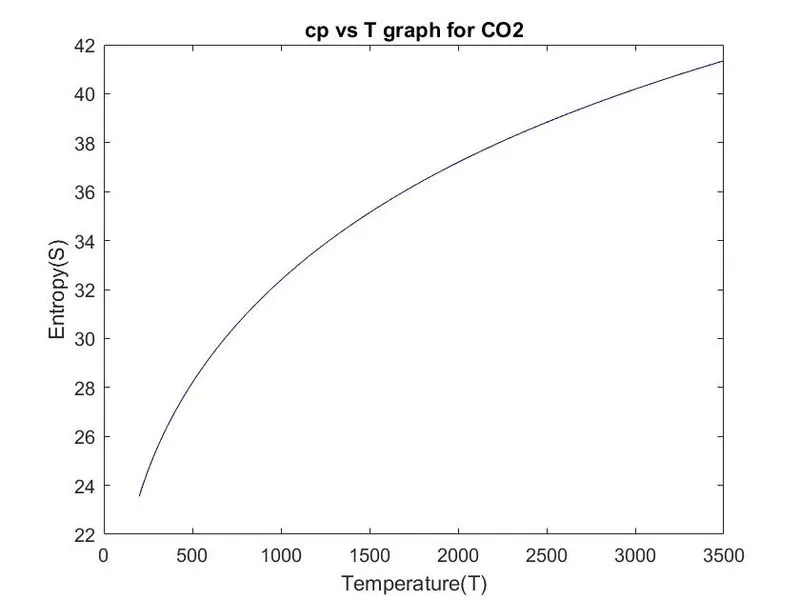
3)Graphs of C02:
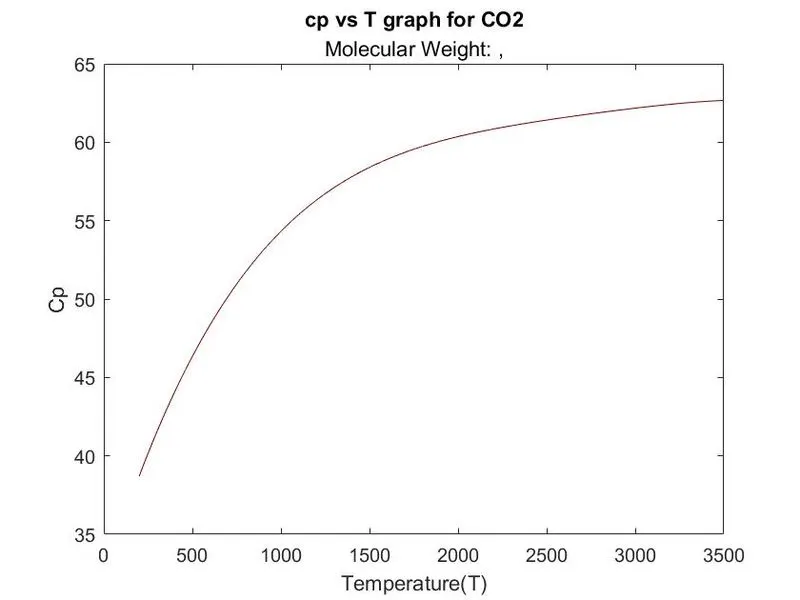
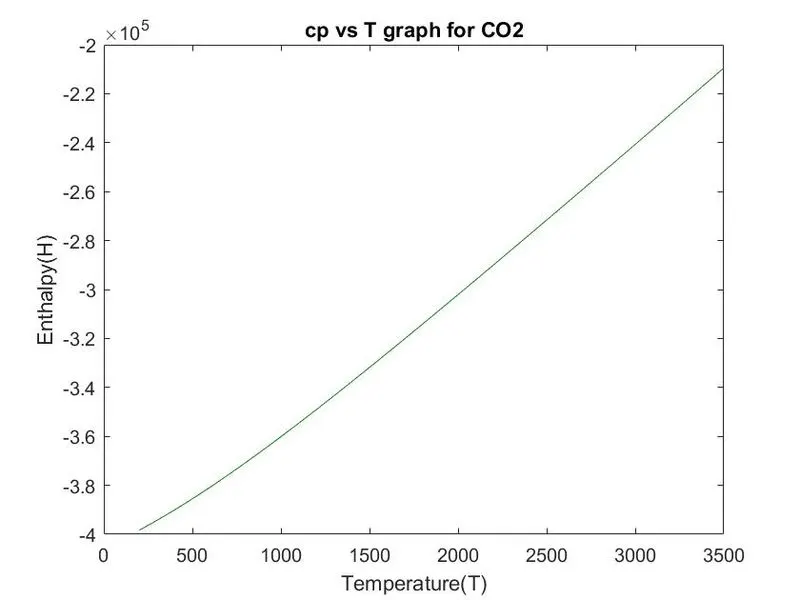
Scrrenshot of the folder:
Molecular weight values :
References:
https://in.mathworks.com/help/matlab/ref/mkdir.html
https://in.mathworks.com/matlabcentral/answers/317006-create-new-folders-by-mkdir
https://in.mathworks.com/help/matlab/ref/saveas.html
CONCLUSION:
By using matlab we have writeen a program to file parsing the NASA thermodynamic data. The specific heat(Cp),enthalpy(H),entropy(s) values are calculated for each species. Molecular weight is calculated for each species. Graphs has been plotted for all species w.r.t temperature. we also learnd how to save in a separate folder.