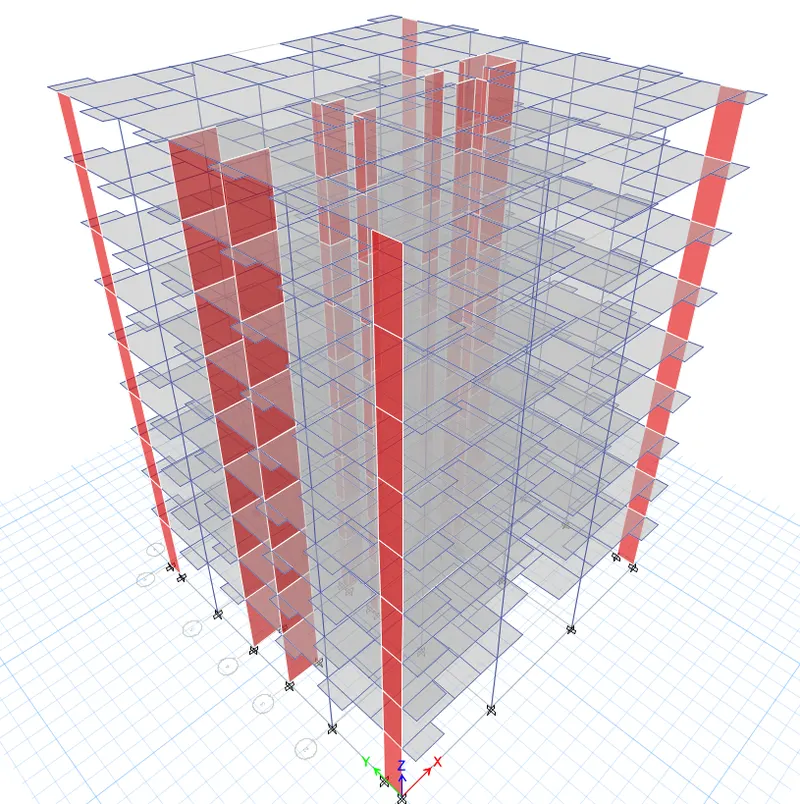
Structural Modelling using Etabs 2018
Structural Modelling using Etabs 2018
AIM:-
- Conceptualize a framing plan layout and then model a G+7 residential building in zone 5 using Etabs software.
- The structural model must comply with provisions of IS 1893 and IS 13920
- Finally Run a modal response spectrum analysis and check analysis results of the etabs model for inter-storey drift requirements, vertical & planar irregularities, minimum shear wall requirements,maximum axial load ratio for column and shear walls, effective moment of inertia for beams and columns etc.
PROCEDURE:-
STEP 1.
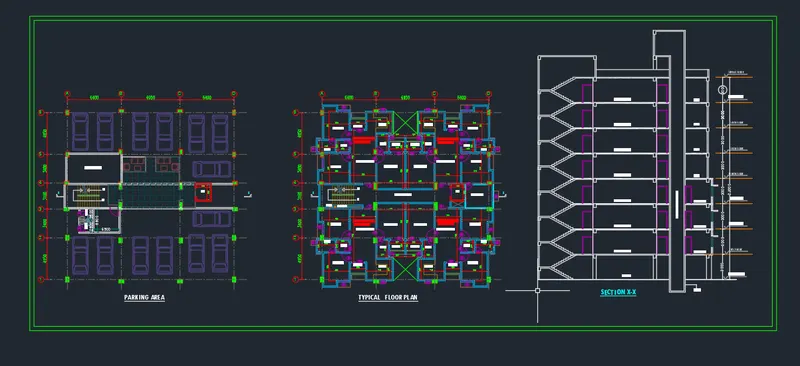
- Carefully analyse the floor plan and section of given residential model.
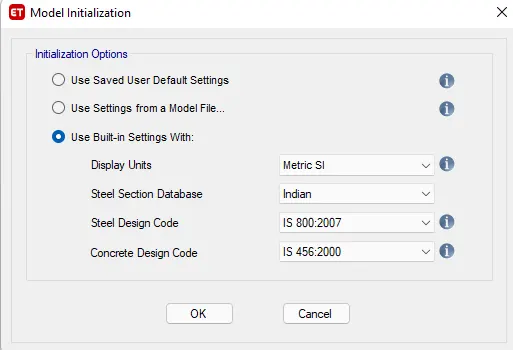
- Open Etabs software and open new file.
- Make the settings as below.
- Now enter all the sufficient grid and storey details in the following window.
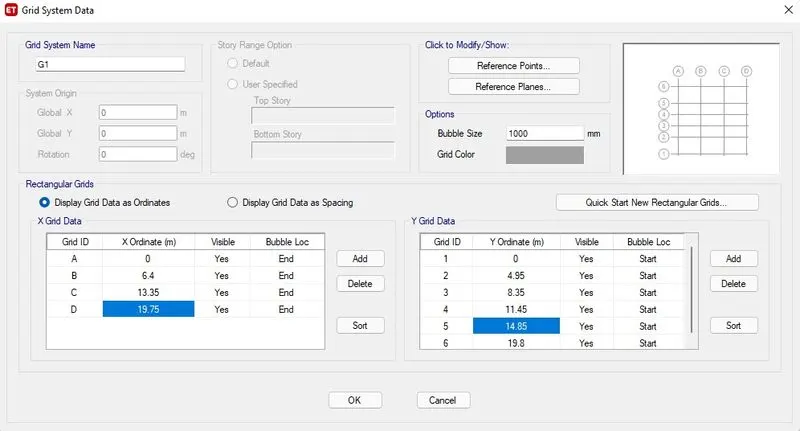
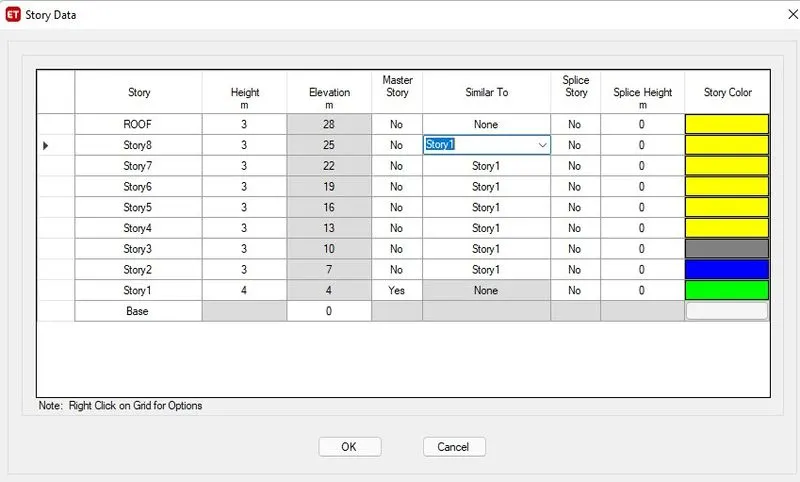
- Then grid appears as follows in the screen.
Step 2:-
- Now go to define tab.
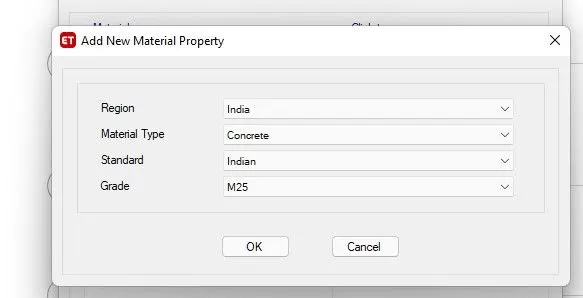
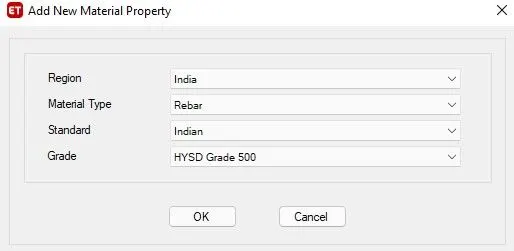
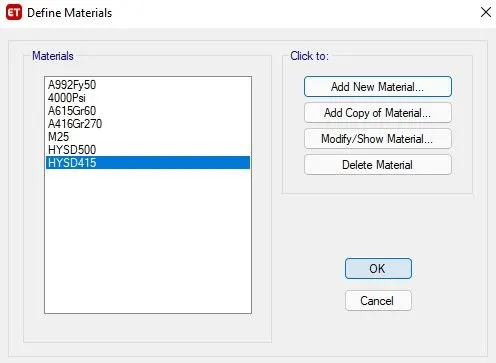
- define materail properties as follows.
Step 3:-
- Now again go to define tab.
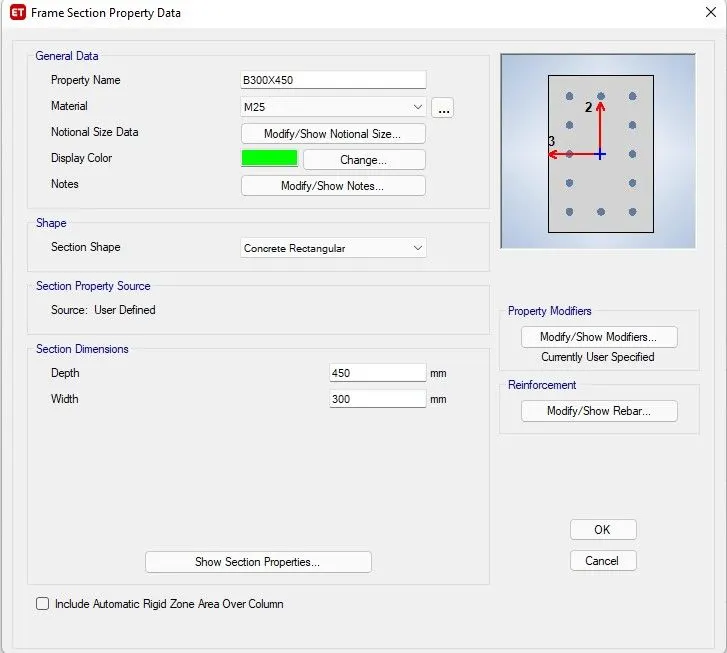
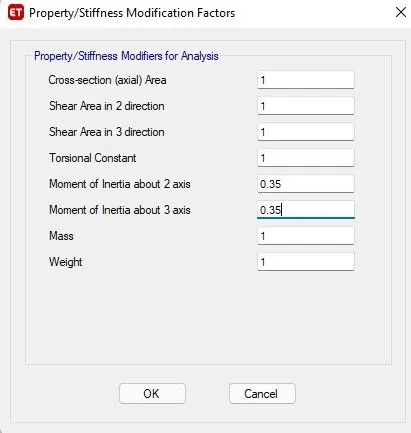
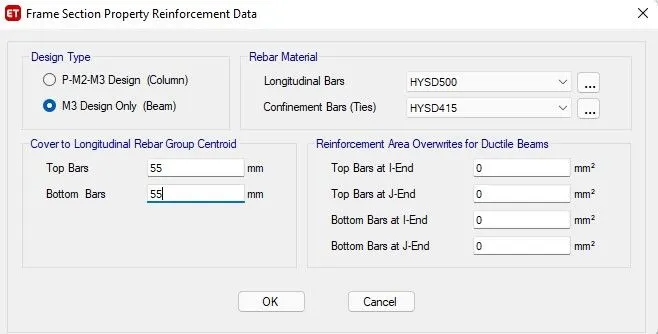
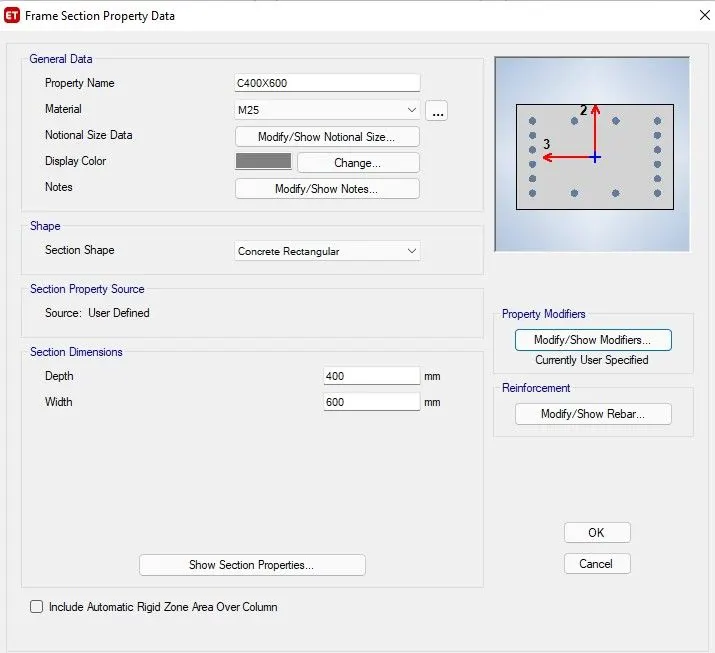
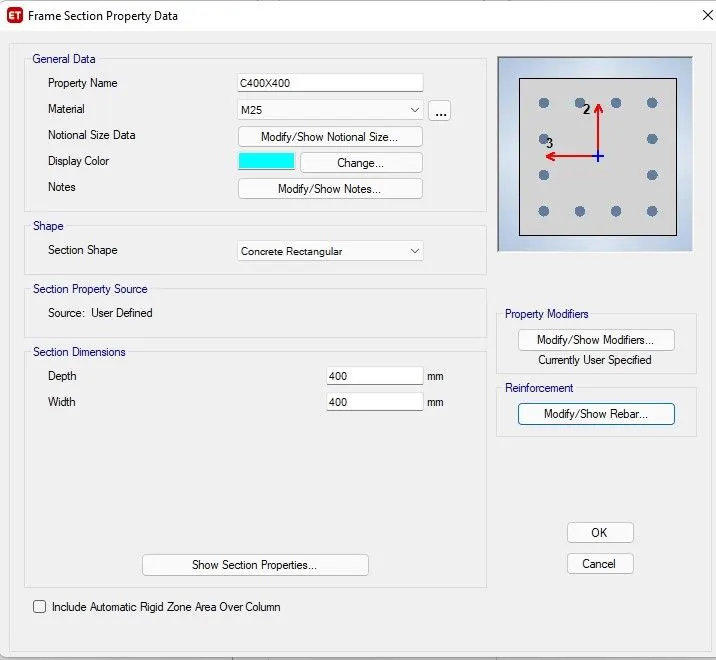
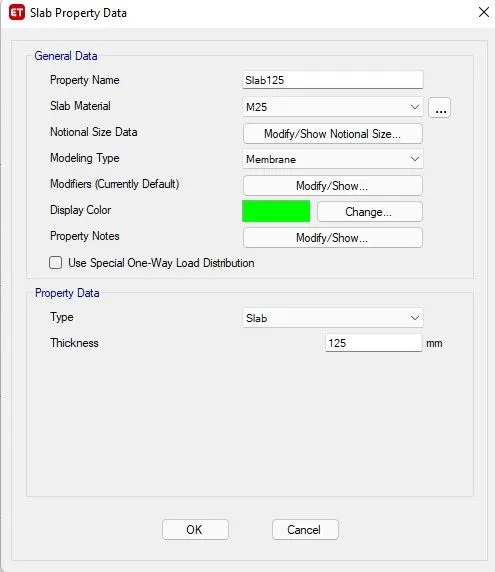
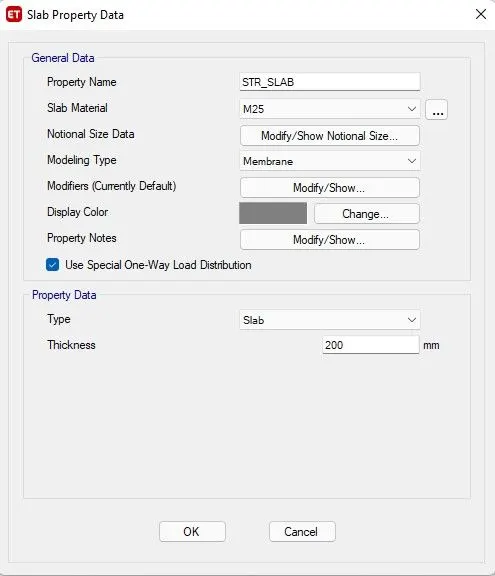
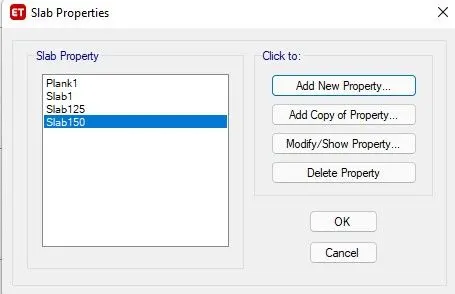
- Then define all section properties such as Beams(B300x400),column(400x600) , (slab 115 and str 200) and shear walls.
1.Beams(B300x400)
2.Column(400x600) and (400x400)
3.(slab 125 and str 200)
4.Shear walls.
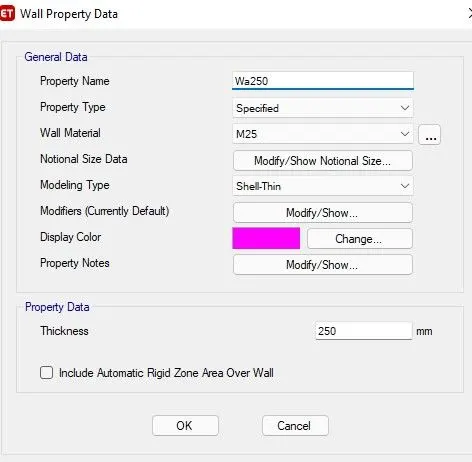
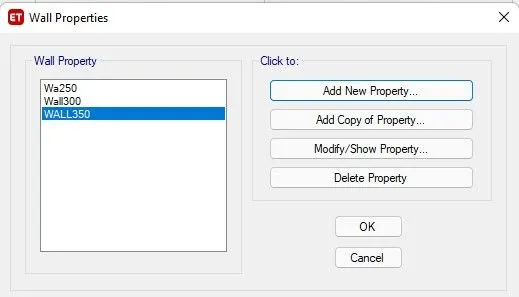
STEP 4:-
- Placing appropriate elements on the grids.
1. Placing Column(400x600)
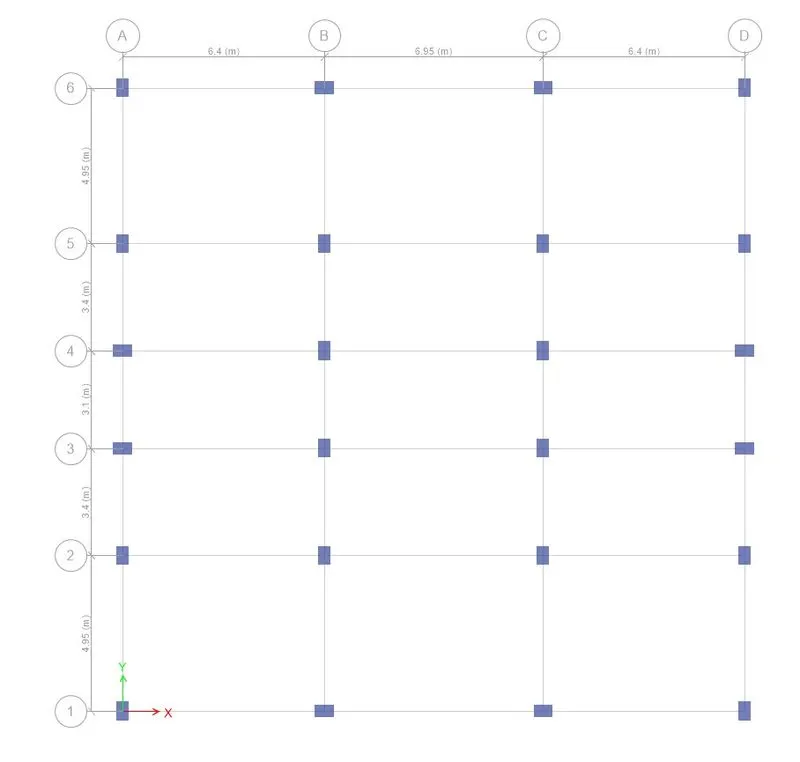
2. Placing Beams(300x450)
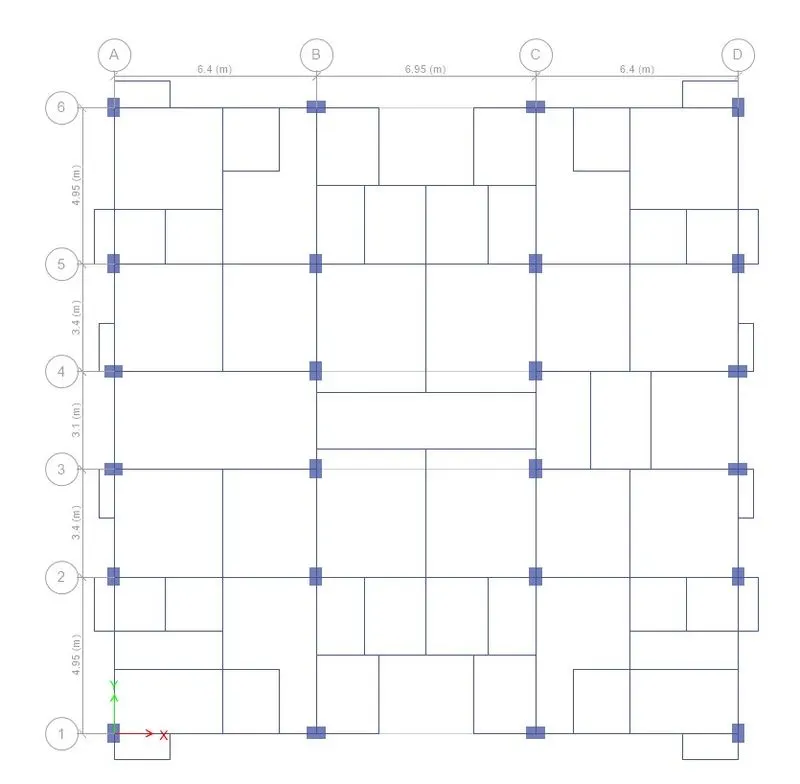
3. Placing Shear walls(300)
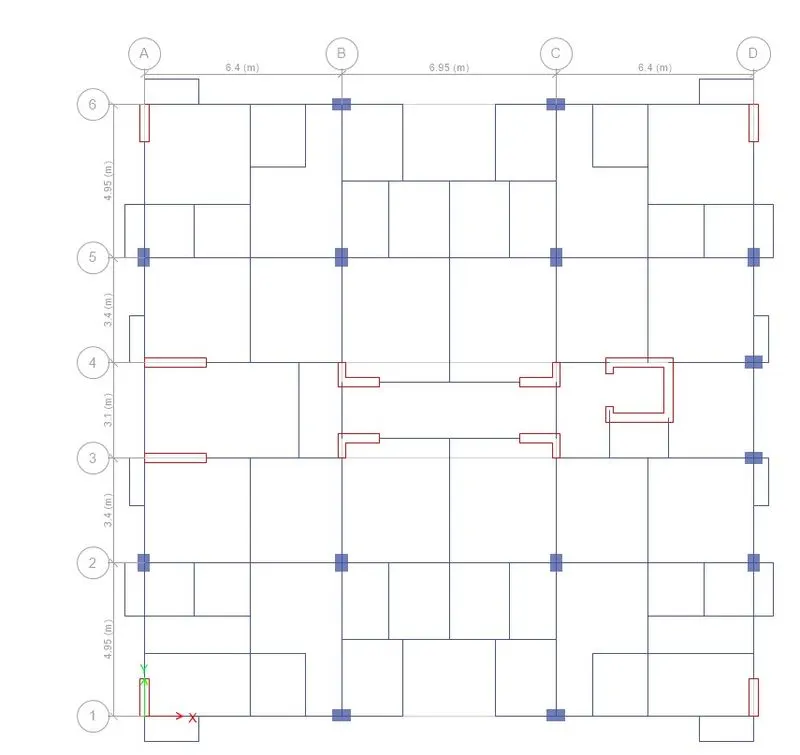
3. Placing slab membranes.4
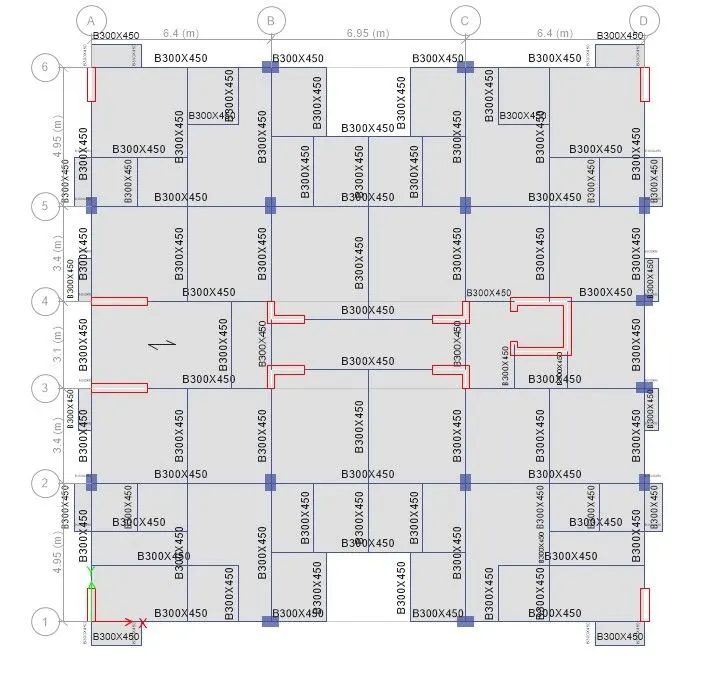
Step 5:-
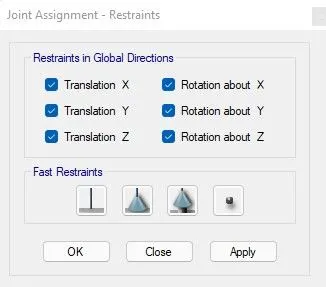
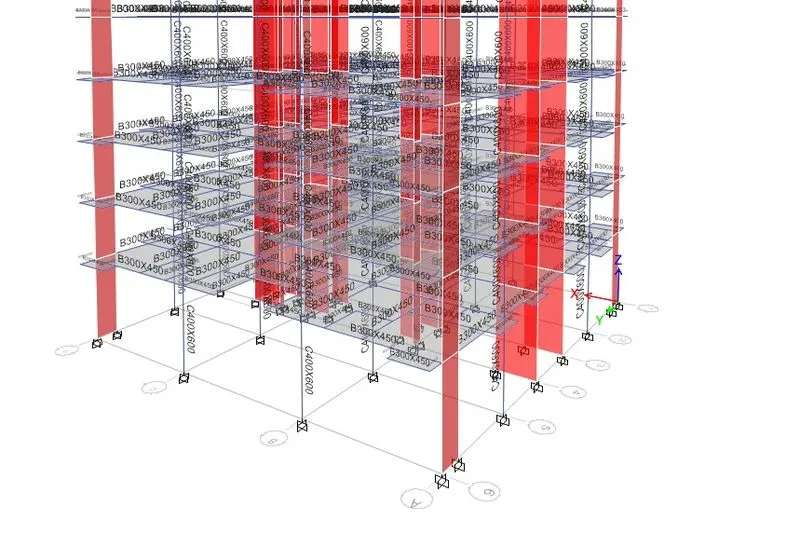
- Now go to base floor and select all joints.
- Then go to Assign>joints>restraints>fixed.
Step 6:-
- Go to define>load patterns.
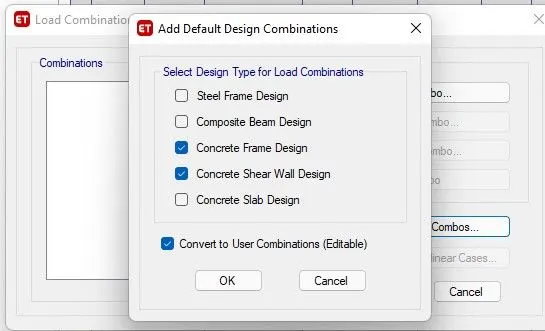
- Load patterns- dead,live,wall,floor finishes and seismic loads.
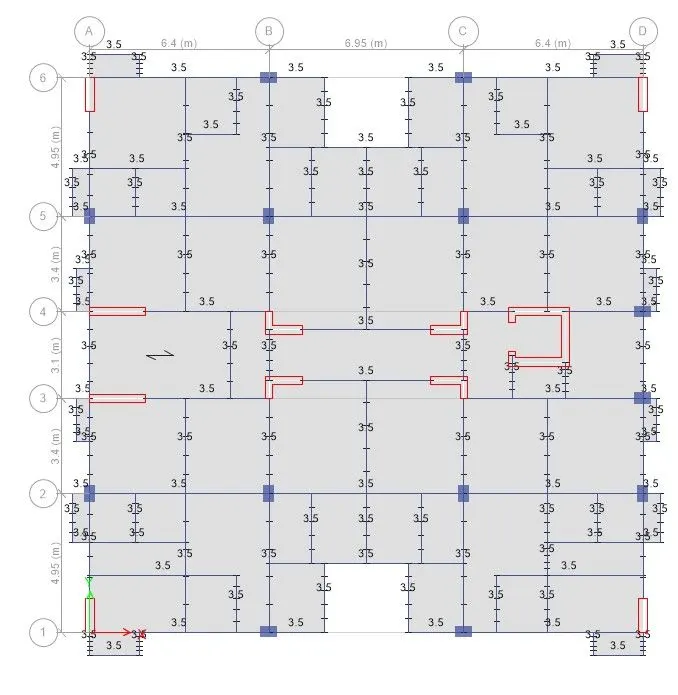
- Brick wall - 3.5 KN/m^2
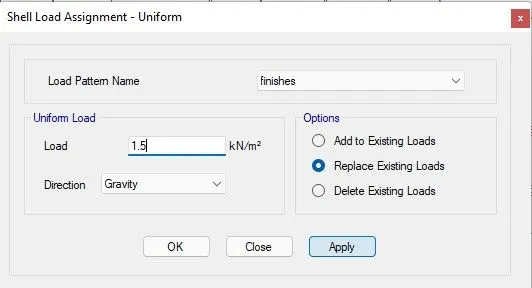
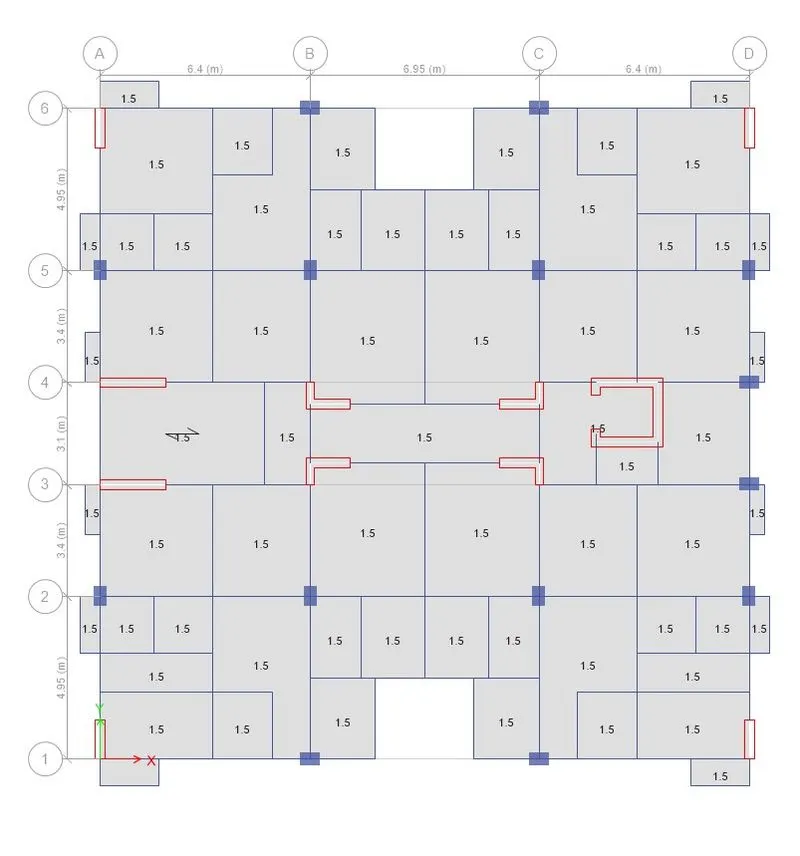
- floor finishes - 1.5 KN/m^2
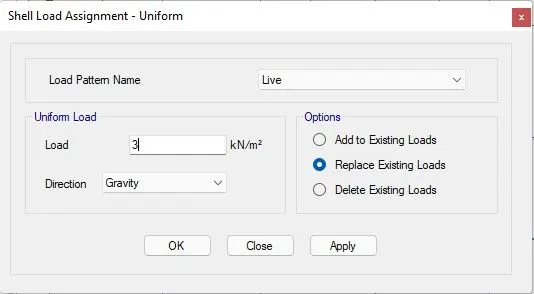
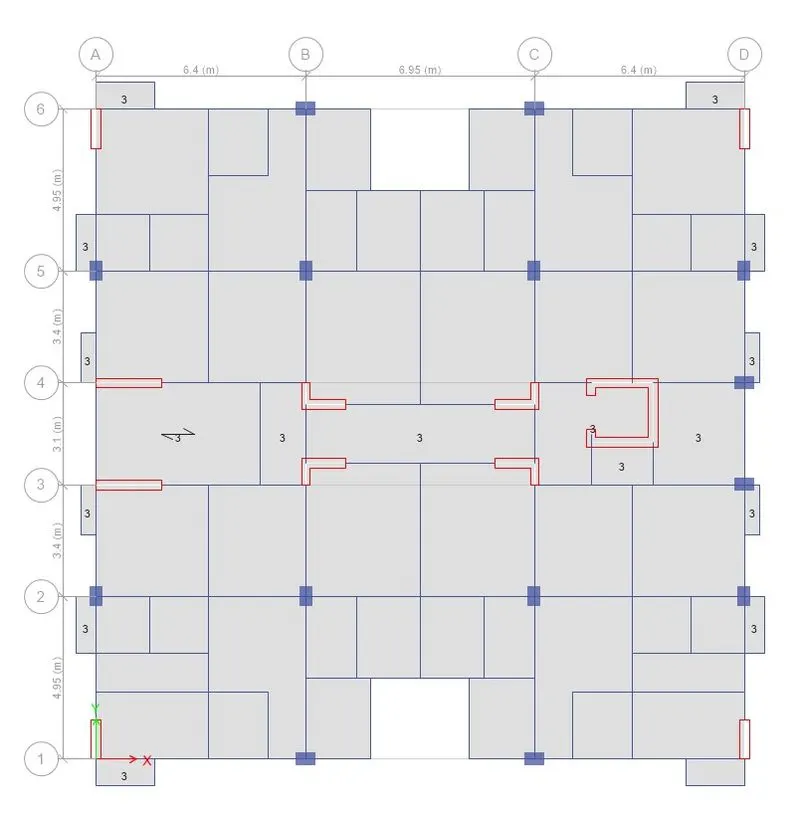
- Live load - 2 KN/m^2 and 3 KN/m^2.
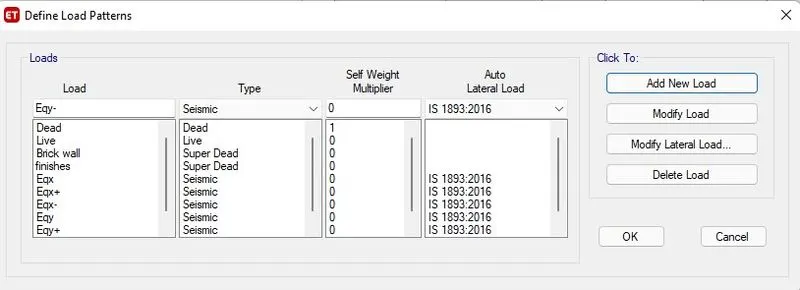
- Brick wall - 3.5 KN/m^2
2. Live load - 2 KN/m^2 and 3 KN/m^2.
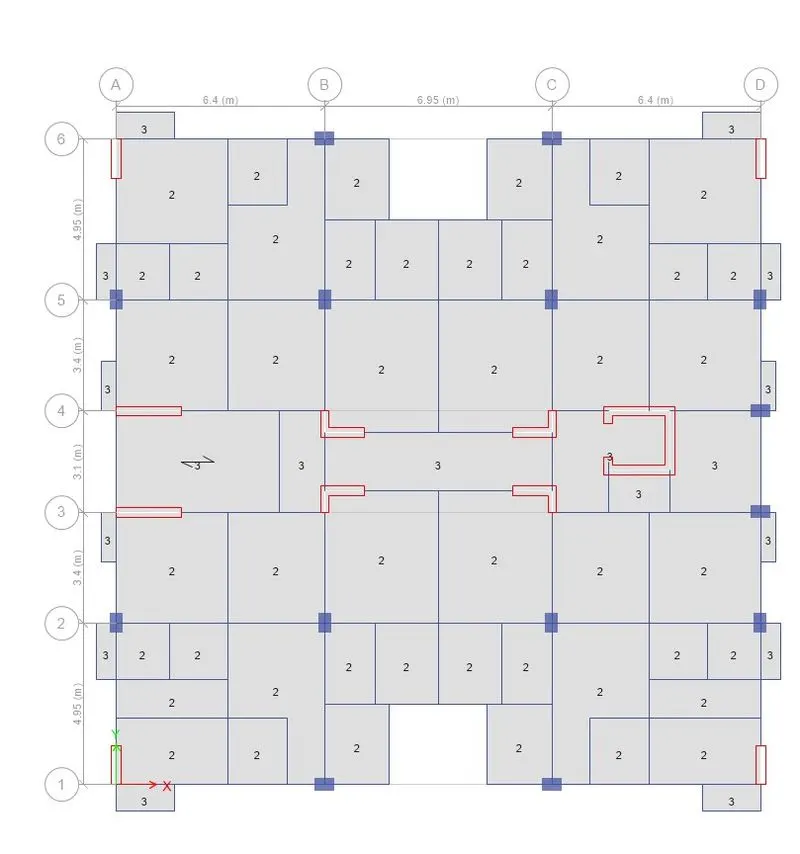
3. Floor finishes.
Step 7:-
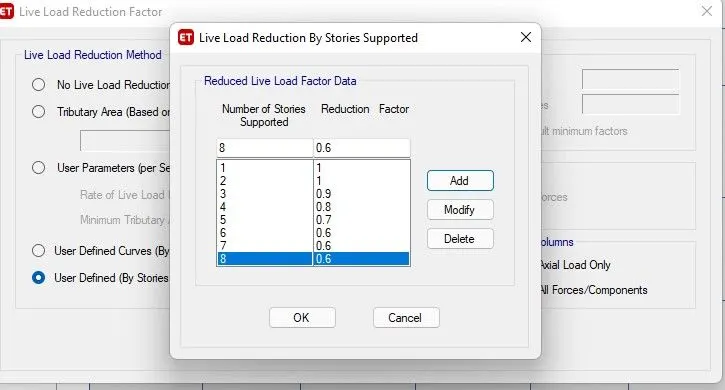
- Select live reduction factor for each storeys as per IS code specification.
Step 8:-
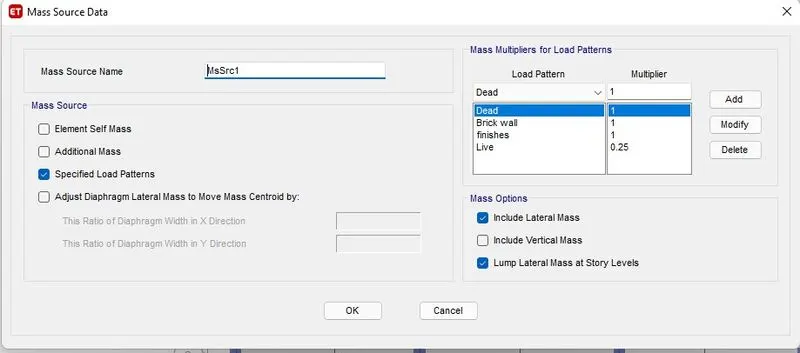
- Define mass source as follows.
Step 9:-
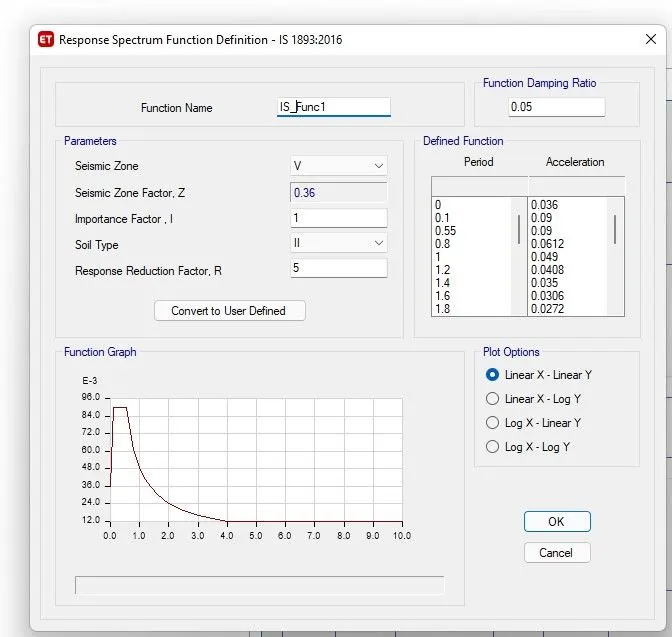
- Define responce spectrum function.
- Go to deine>Responce spectrum>Func name_RS>OK.
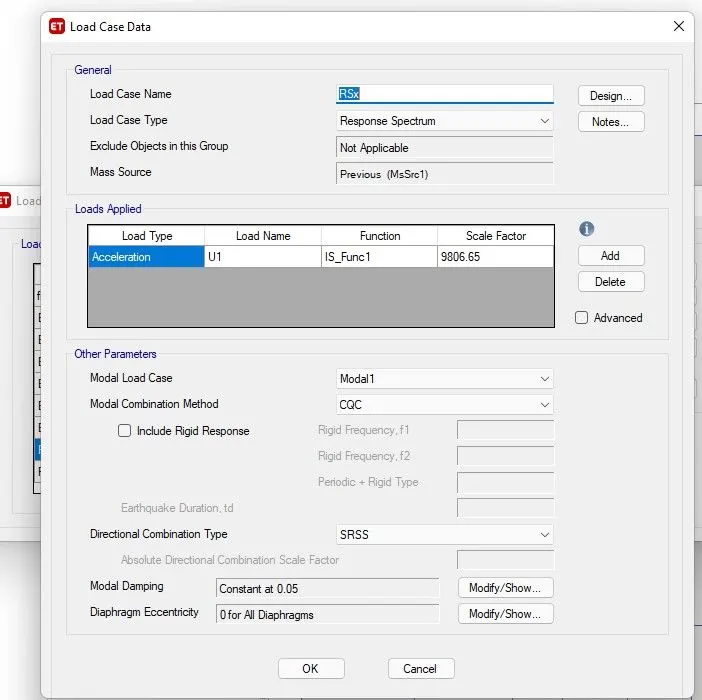
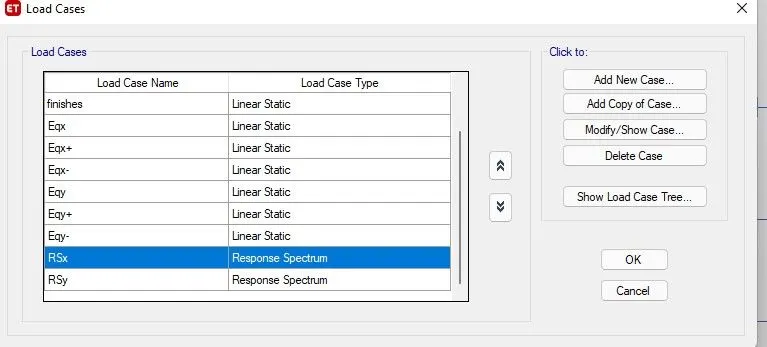
- Then go to load case>add new case>Rsx(U1)>load case type>Response spectrum>Then fill load applied details.
- Similarly add another load case Rsy(U2).
Step 10:-
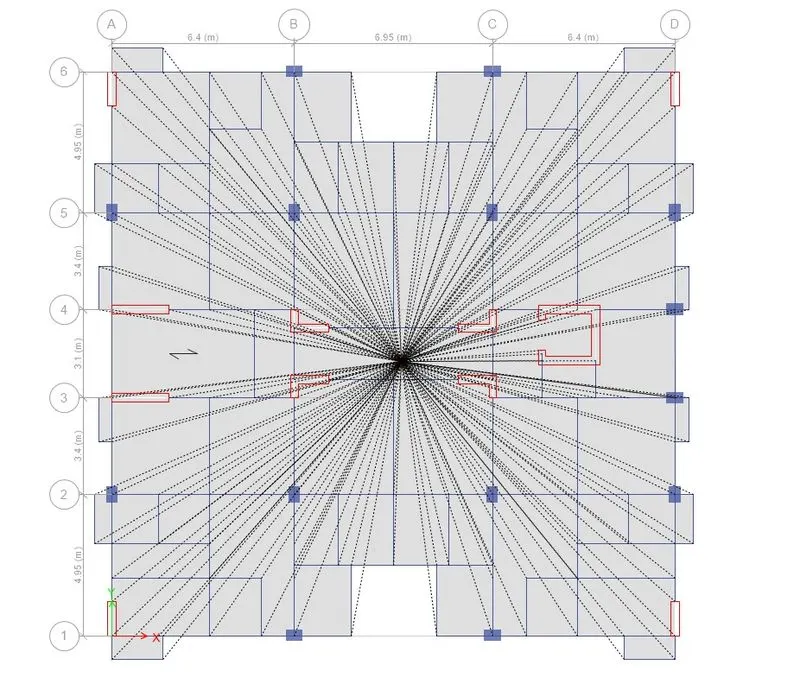
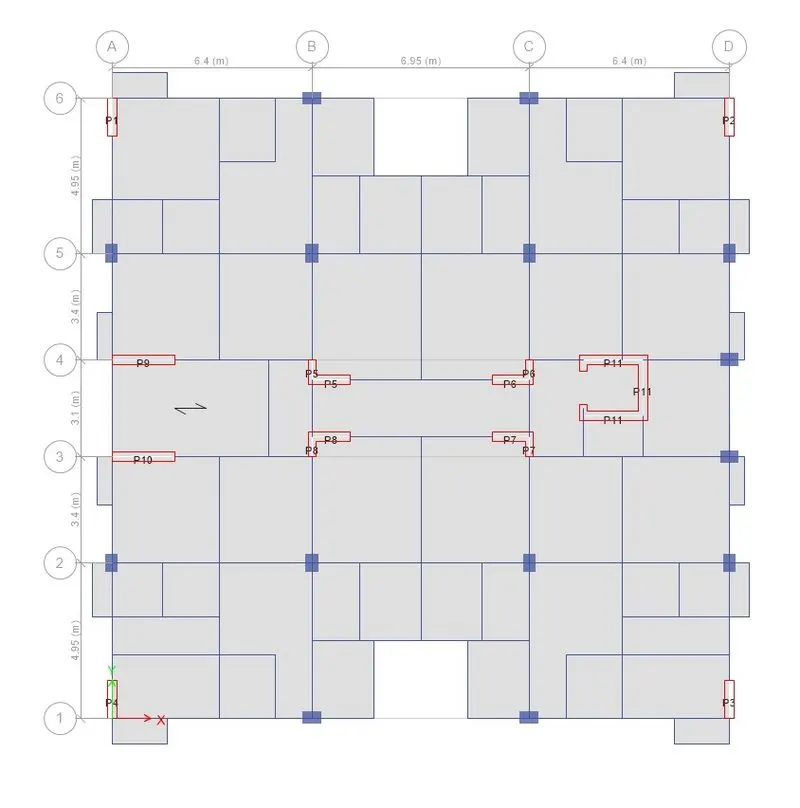
- shear walls are marked with appropriate names as follows.
Step 11:-
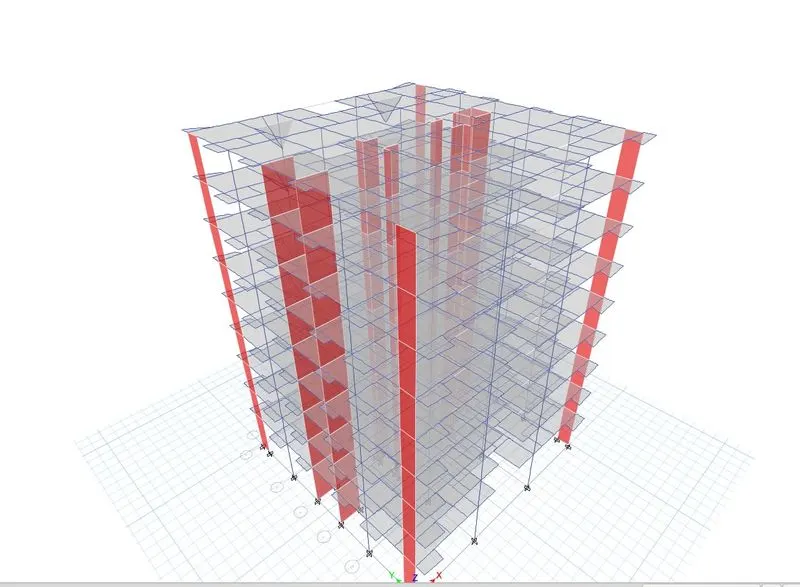
- Analyse>Check model.

- Run analysis
Step 11:-
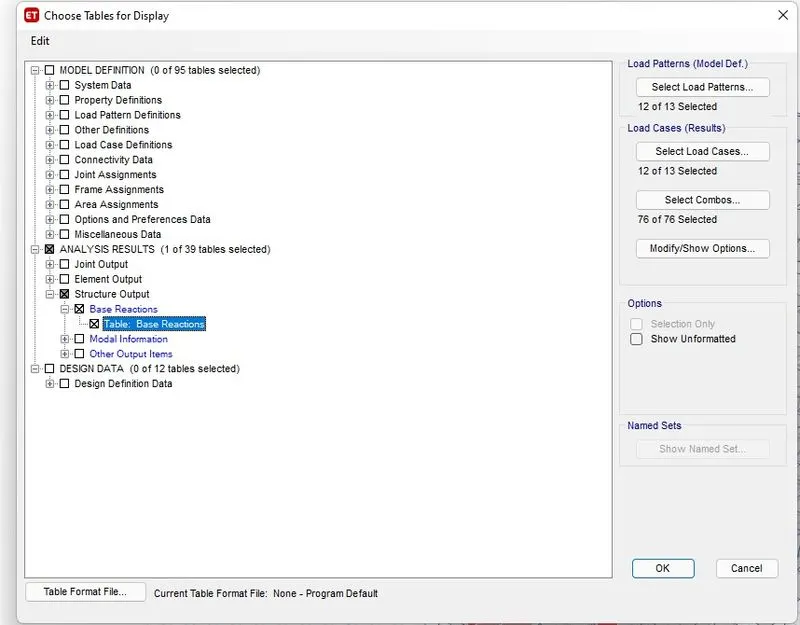
- Go to Display>structure output>Base reactions.
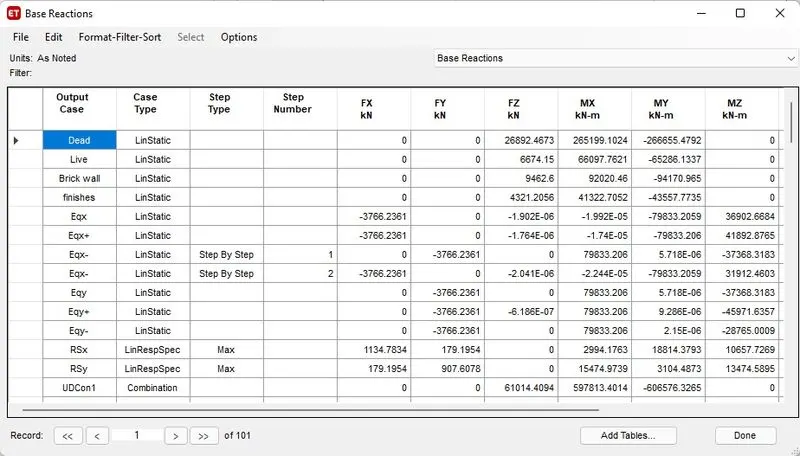
From the table;
Eqx = 3766.2361 KN
Rsx = 1134.7834 KN
Hence scale factor = Eqx / Rsx = (3766.2361/1134.7834 )= 3.31.
similarly
Eqy = 3766.2361 KN
Rsy = 907.6078 KN
Hence scale factor = Eqy / Rsy = (3766.2361/907.6078 )= 4.14.
Now change the scale factor in the load case by mulitiplying the values obtained above.
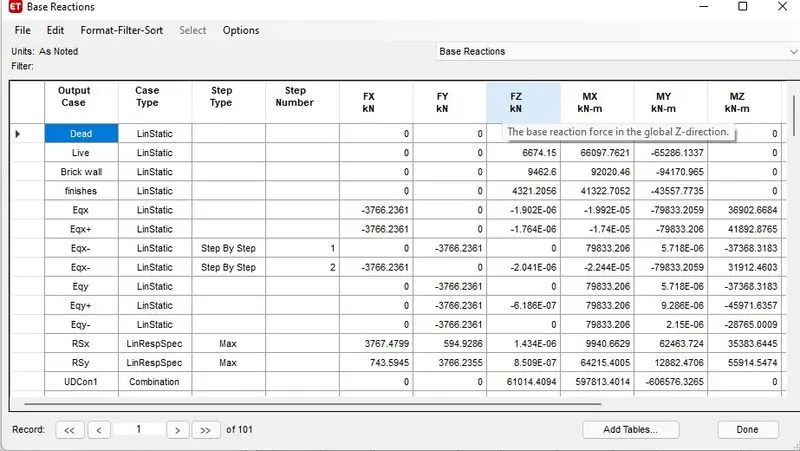
Here we can see that the Eqx and RSx values are almost equal.
STEP 12
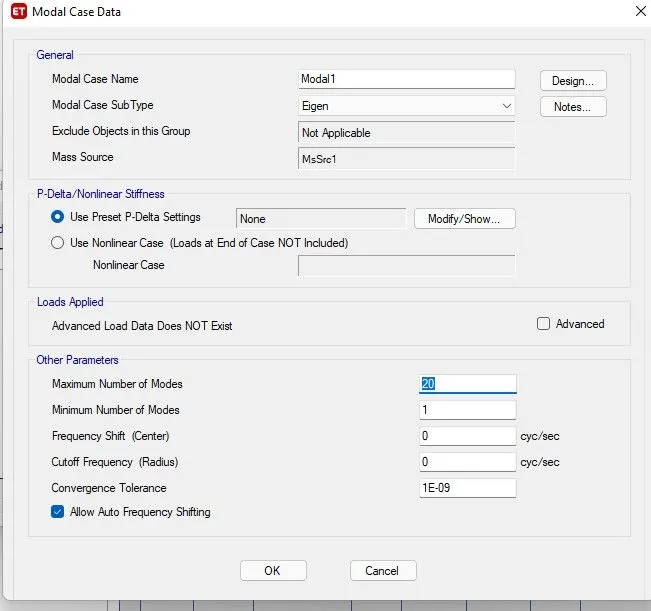
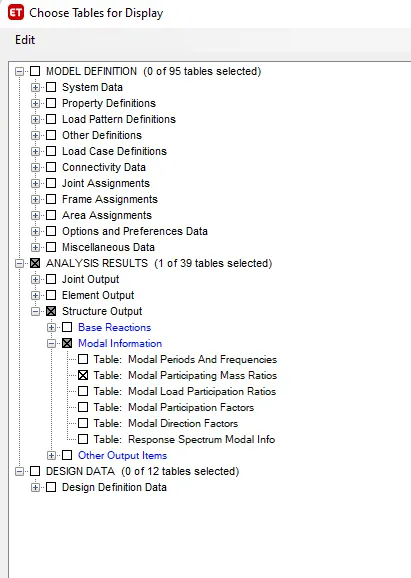
- Again Go to Display>structure output>Modal information>Modal participationg mass ratios.
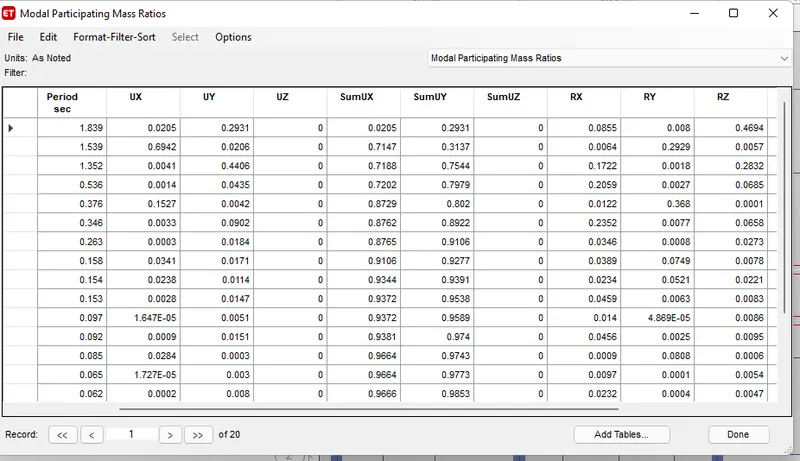
Mode 1:- 29.31 %
Mode 2 :- 69.42 %
Mode 3 :- 28.32 %
First 2 fundamental modes are greater than the third mode.
Step 12:-
- Go to display>story response plot > Maximum story drift.
- Masimum story drift for Rsx and Rsy are as follows.
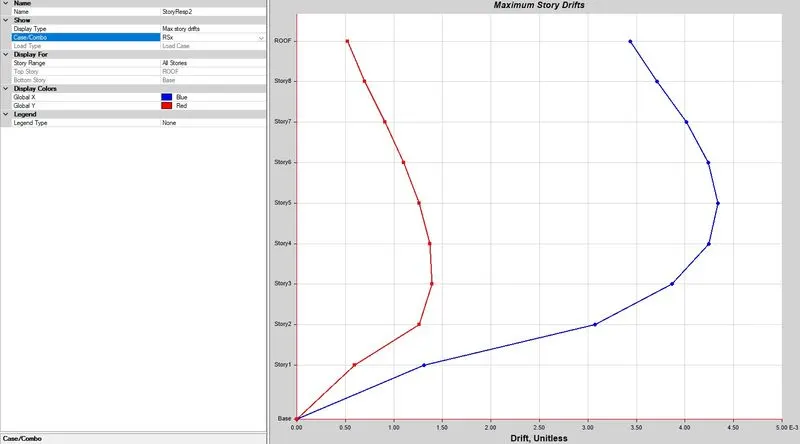
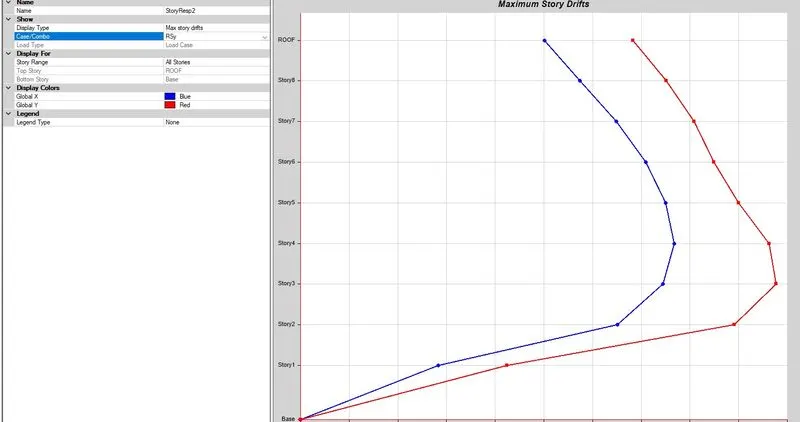
- Drift values are slghtly greater than 4%.
Step 12:-
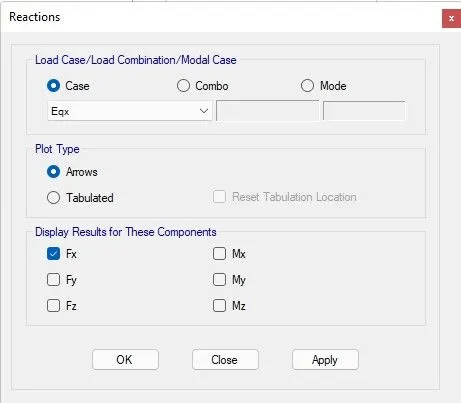
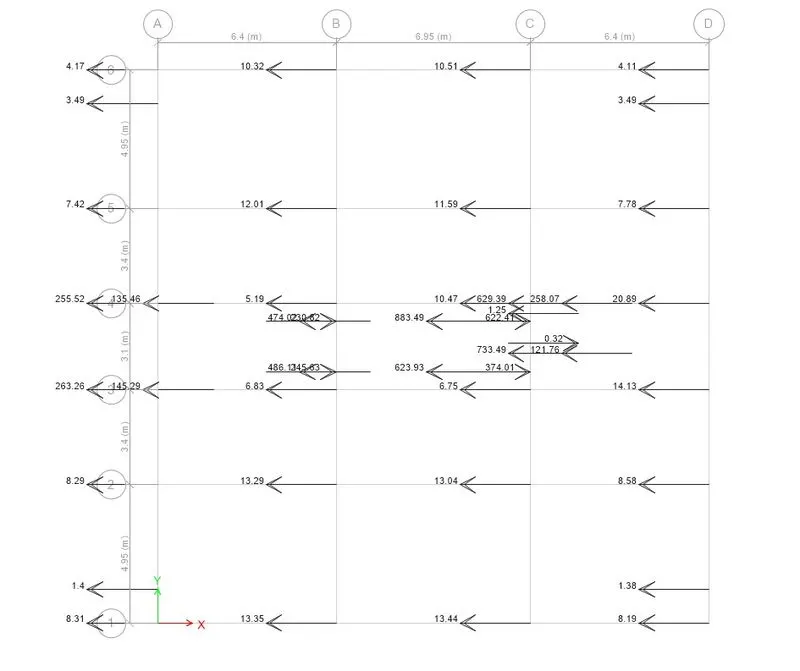
- Go to base floor>Click on reaction tab>select load case and tick on display results for these componeents.
Eqx
Eqy
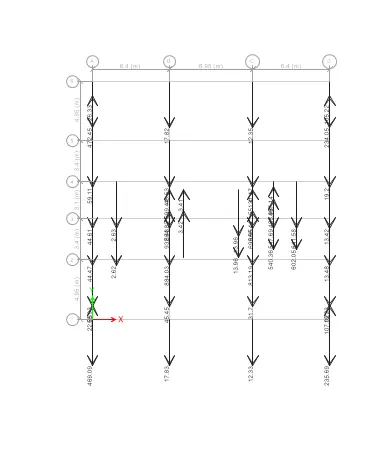
- Base shear taken up by the shear wall divided by total base shear of buliding will get the % of the shear forces taken up by the shear wall.
- And if it is less than 80% more shear walls have to be added.
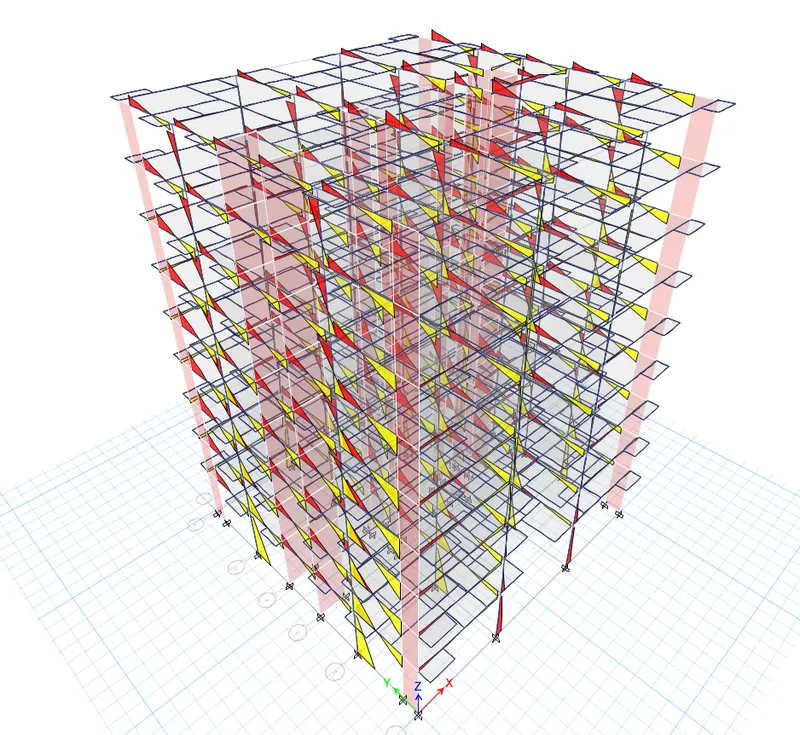
Axial force diagram
- Display>Force stres diagram >Frame/pier/sprandel/link.
Result:-
- Hence G+7 Building has designed as per IS 1893 and IS 13920
- After framing the layout,analysis has been carried out.
- All the checks as per IS code has carried out.