Structural dynamics
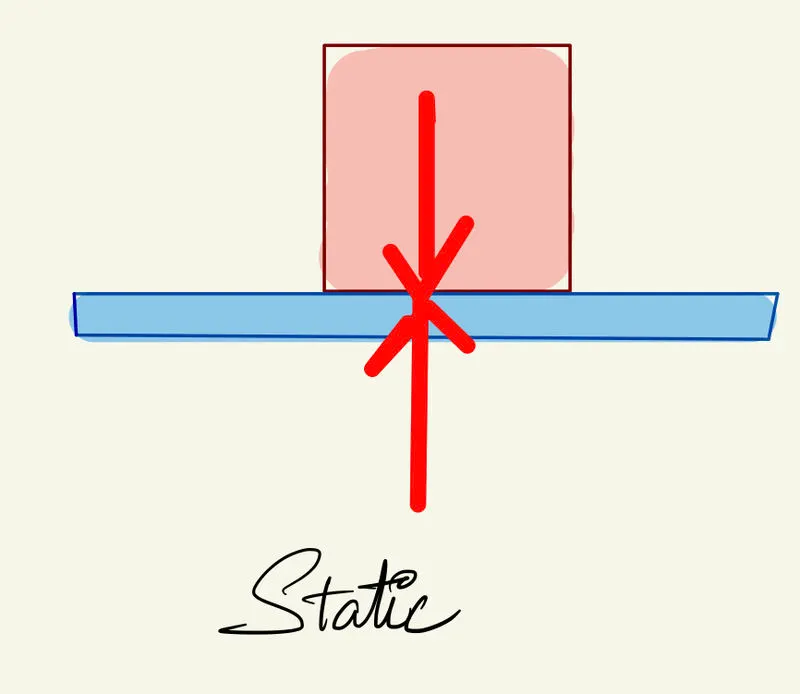
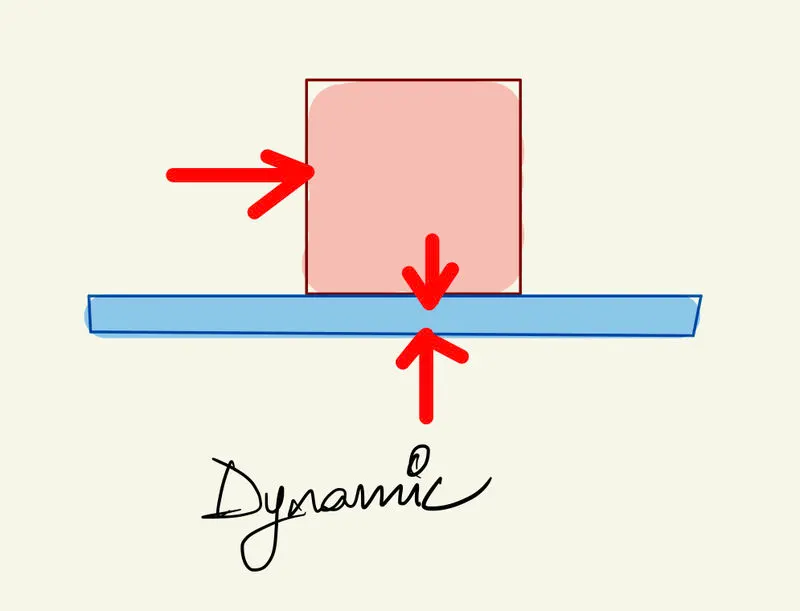
1. Differentiate Static analysis and Dynamic analysis with proper representing pictures
Ans:
| Static Analysis | Dynamic Analysis |
| Variation of the load with time is neglected due to the slow application of load. | Variation of load with time is considered due to the fast application of load. |
| The motion of the structure can be disregarded. | Displacement of structure is regarded. |
| Only equivalent lateral force is considered in the equilibrium equation. | Inertia and damping force are also considered in the equilibrium equation. |
| In the case of static analysis counting of inertia and damping force is not necessary, but the elastic forces should be accounted for static analysis. | Intertia and damping forces should be accounted for in the calculation of dynamic analysis. |
| There is no inertia effect on static analysis | The inertia effect is considered in dynamic analysis. |
 |
 |
2. Explain the following with the relevant force-displacement graph
- Elastic behaviour
- Inelastic behaviour
- Plastic behaviour
- Non-linear Inelastic behaviour
Ans:
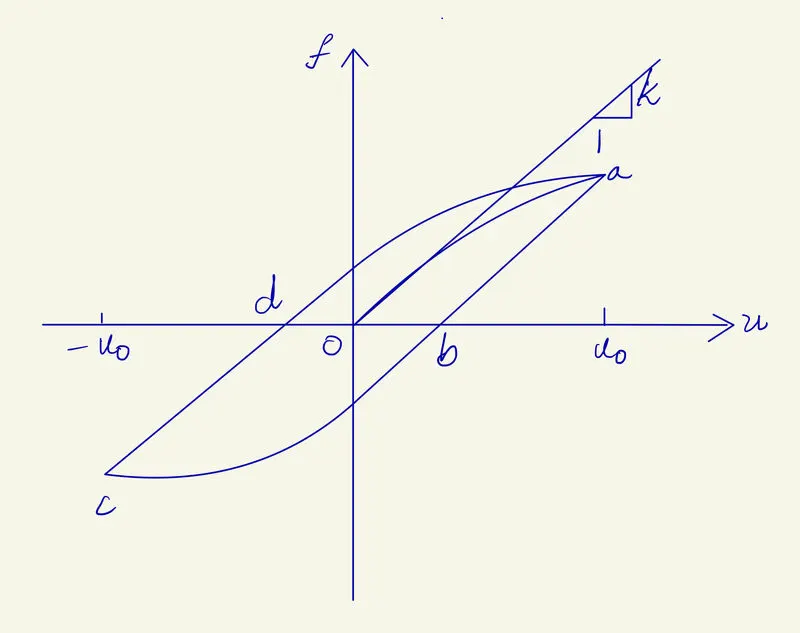
- Elastic behaviour:
- Elastic behaviour is the ability of a material to recover its original shape after the force is removed.
- Elastic structures fail either by exhausting material strength or by instability.
- From the graph, up to the certain point from 'O', the graph is linear and shows elastic properties.
- Elastic behaviour is the ability of a material to recover its original shape after the force is removed.
- Inelastic behaviour:
- The term, "inelastic" is used to define the material response in relation to the stress-strain diagram that is non-linear and that retains a permanent strain or returns to an unstrained state on complete unloading.
- In earthquake engineering, the inelastic response is expected, and the survivability of the structure depends on the ability of the structure to sustain several cycles of fully reversed inelastic deformation without excessive loss of stiffness or strength.
- In the graph inelastic behaviour is shown at the upper shape of the curve up to point 'a'.
- The term, "inelastic" is used to define the material response in relation to the stress-strain diagram that is non-linear and that retains a permanent strain or returns to an unstrained state on complete unloading.
- Plastic behaviour:
- For stresses beyond the elastic limit, a material exhibits plastic behaviour. This means the material deforms irreversibly and does not return to its original shape and size, even when the load is removed.
- When stress is gradually increased beyond the elastic limit, the material undergoes plastic deformation.
- In the graph, plastic behaviour is displayed during unloading after point 'a'.
- For stresses beyond the elastic limit, a material exhibits plastic behaviour. This means the material deforms irreversibly and does not return to its original shape and size, even when the load is removed.
- Non-linear Inelastic behaviour:
- Force displacement relationship becomes non-linear and inelastic at large deformations.
- Force fs corresponding to deformation is not single-valued and depends on the history of deformations and whether deformations are increasing or decreasing. Thus the resisting force can be expressed as:
fs=fs(u, v) - Non-linear inelastic behaviour occurs after the line from 'O' tends to bend towards point 'a'
- Force displacement relationship becomes non-linear and inelastic at large deformations.
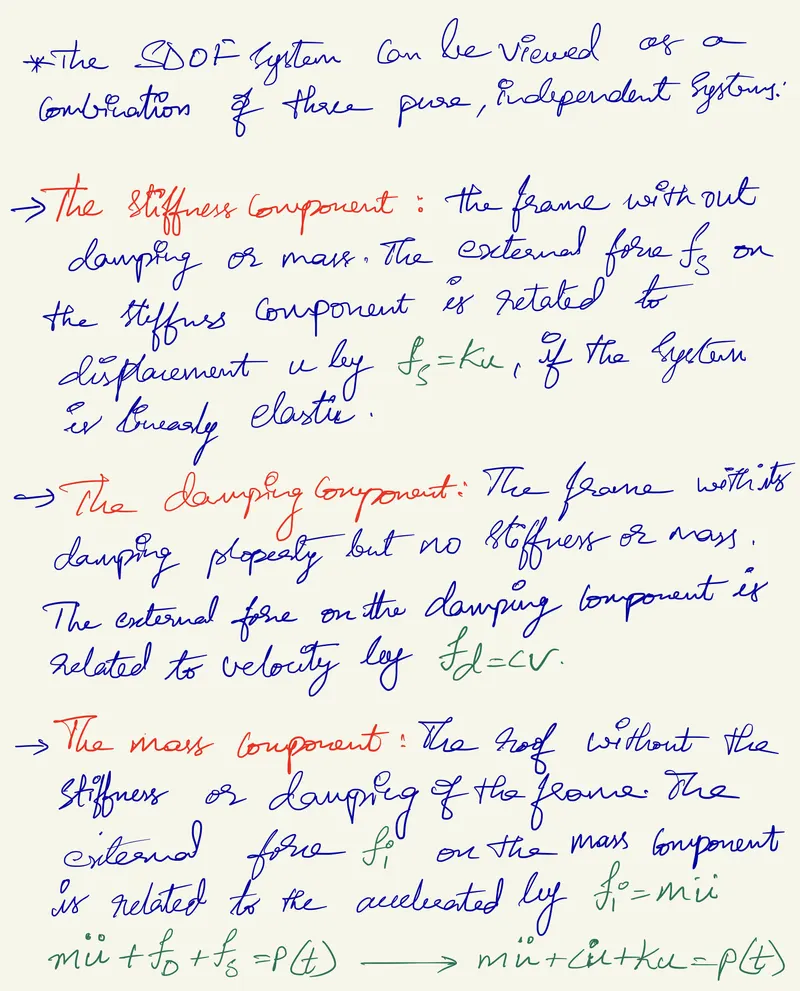
3. Explain Mass, Stiffness & Damping components in the equation of motion
Ans:
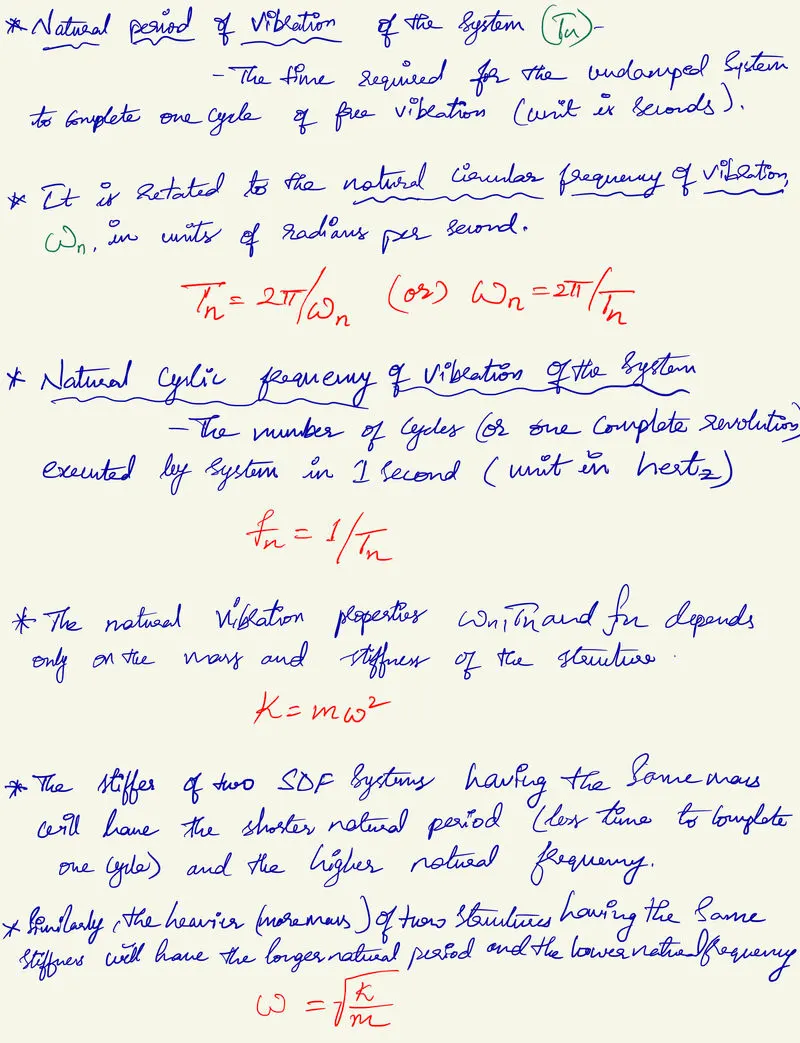
4. Provide relationship between Natural period (Tn) & Natural frequency (f) and provide their definitions
Ans:
5. Explain in detail about Response spectrum & its Graph
Ans:
RESPONSE SPECTRUM:
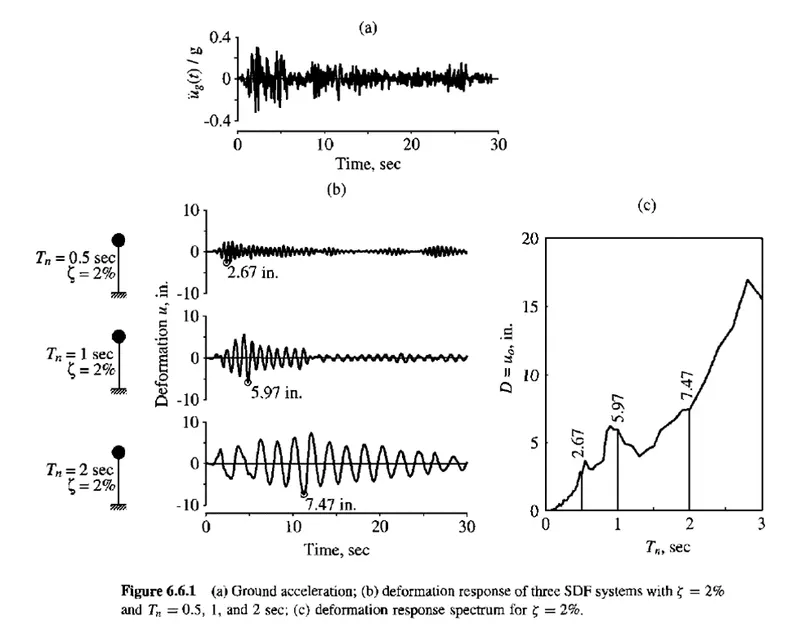
- A central concept in earthquake engineering, the Response spectrum is a practical means of characterizing ground motions and their effects on the structure of different natural periods of frequency (Tn)
- It provides a convenient means to summarize the peak response of all possible linear SDF systems to a particular component of ground motion.
- It also provides a practical approach to applying the knowledge of structural dynamics to the design of structures and the development of lateral force requirements in building codes.
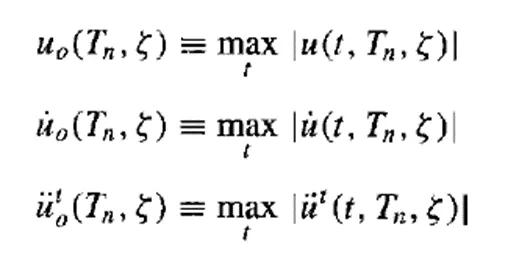
- A plot of the peak value of a response(u,v and a) as a function of the natural vibration period Tn of the system, is called the response spectrum for that quantity.
- Each suck plot is for SDF systems having a fixed damping ratio ζ and several such plots for different values of ζ are included to cover the range of damping values encountered in actual structures.
- The response spectrum can be of 3 types. The deformation of the response spectrum is a plot of peak u, against Tn for fixed ζ. A similar plot for peak ù is the relative velocity response spectrum, and for peak ü ^T, is the acceleration response spectrum.