Structural dynamics
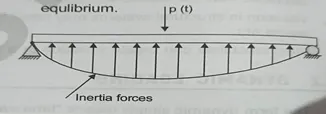
1. Differentiate Static analysis and Dynamic analysis with proper representing pictures
|
Static analysis |
Dynamic analysis |
|
1. Load is consist with respect to time 2. Static problem has only one response i.e. displacement 3. Static problem has only one solution 4. Generally it is simple analysis 5. The response can be calculated by the principle of static equilibrium |
1. Load varying with time 2. Dynamic problem has mainly three responses, displacement, velocity and acceleration 3. Dynamic problem has infinite number of solution that are time dependant in nature 4. Complex and time consuming analysis 5. The response can be calculated by including inertia force and static equilibrium |

2. Explain the following with relevant force-displacement graph
- Elastic behavior –
For liner system the relationship between the latral force fs and resulting deformation u is liner that is
fs=ku
where k is the lateral stiffness of the system its unit are force/length implicit in is the assumption that the liner fs-u relationship determined for small deformation of the structure is also valid for large deformation. The linear relationship implies that fs is a single valid function of u. such as system is said to be elastic hence we use the term linearly elastic system to emphasize both properties.
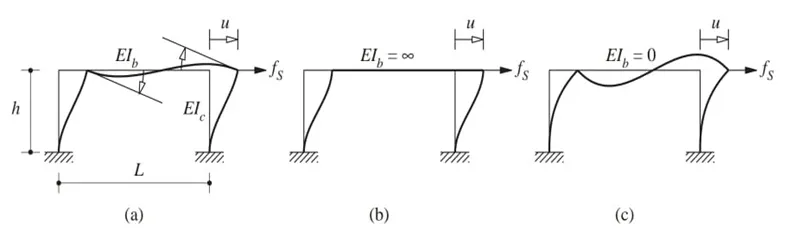
Consider the frame with bay with l height h elastic modules E and second moment of cross-section area about the axis of the bending-lb and lc for the beam and column respectively the column are clamped at the base. The latral stiffness of the frame can readily be determined fo two extreme cases if the beam is rigid
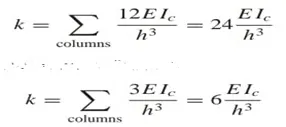
Observed that for the two extreme value of beam stiffness the lateral stiffness of the frame is independent of L the beam length or bay width
Inelastic behaviour-
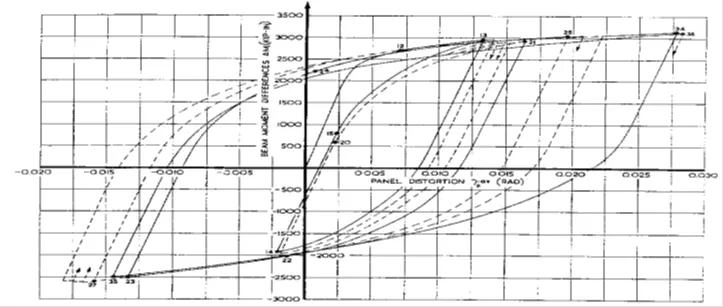
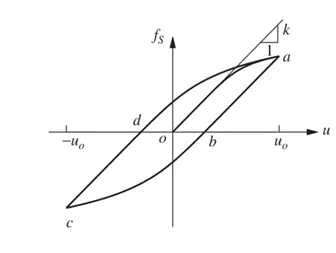
Determined by experiments, the force–deformation relation for a structural steel component undergoing cyclic deformations expected during earthquakes is shown in The initial loading curve is nonlinear at the larger amplitudes of deformation, and the unloading and reloading curves differ from the initial loading branch; such a system is said to be inelastic. This implies that the force–deformation relation is path dependent, i.e., it depends on whether the deformation is increasing or decreasing. Thus the resisting force is an implicit function of deformation:
fS = fS(u)
The force–deformation relation for the idealized one-story frame deforming
into the inelastic range can be determined in one of two ways. One approach is to use methods of nonlinear static structural analysis. For example, in analyzing a steel structure with an assumed stress–strain law, the analysis keeps track of the initiation and spreading of yielding at critical locations and formation of plastic hinges to obtain the initial loading curve (o–a) shown The unloading (a–c) and reloading (c–a) curves can be computed similarly or can be defined from the initial loading curve using existing hypotheses. Another approach is to define the inelastic force–deformation relation as an idealized version of the experimental data, such as in. We are interested in studying the dynamic response of inelastic systems because many structures are designed with the expectation that they will undergo some cracking,yielding, and damage during intense ground shaking caused by earthquakes.
 Non-linear Inelastic behaviour-
Force displacement relationship becomes non-linear and inelastic at large deformation
Force fs corresponding to deformation is not single valued and depends on history of deformation and whether deformations is increasing or decreasing thus the resisting force can be express as
fs=fs(u,v)
3. Explain Mass, Stiffness & Damping components in the equation of motion
A)Mass components-
The roof mass without the stiffness or damping of the frame the external force fi on the mass components is related to the acceleration by fi=mu
- B) stiffness components-
The frame without damping or mass the external force fs on the stiffness components is related to displacement u by fs=ku if the system is linearly elastic
C)Damping components-
The frame with its dmping property but no stiffness or mass the external force on the damping components is related to velocity by fd=cv
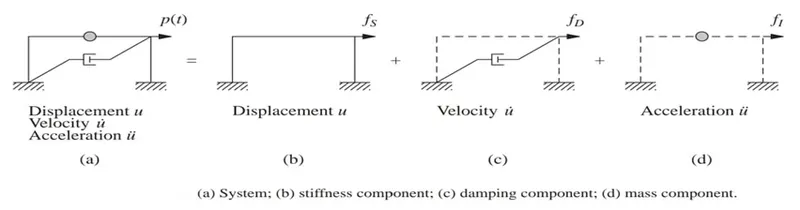
The external force fS on the stiffness component is related to the displacement u by if the system is linearly elastic, the external force fD on the damping component is related to the velocity ˙ u by and the external force fI on the mass component is related to the acceleration by fI = m ¨ u. The external force p(t) applied to the complete system may therefore be visualized as distributed among the three components of the structure, and fS + fD + fI must equal the applied force p(t) leading to Although this alternative viewpoint may seem unnecessary for the simple system of it is useful for complex systems.
4. Provide relationship between Natural period (Tn) & Natural frequency (f) and provide their definitions .
Natural period (Tn)-
The time required for the undamped system to complete one cycle of free vibration is the natural period of vibration of the system, which we denote as Tn, in units of seconds.It is related to the natural circular frequency of vibration, ωn, in units of radians per second
Tn = 2π/ωn
Natural frequency (f)-
A system executes 1/Tn cycles in 1 sec. This natural cyclic frequency of vibration is denoted by
fn = 1/Tn
The units of fn are hertz (Hz) fn is obviously related to ωn through
fn = ωn/2π
The term natural frequency of vibration applies to both ωn and fn.
The natural vibration properties ωn, Tn, and fn depend only on the mass and stiffness of the structure; see The stiffer of two SDF systems having the same mass will have the higher natural frequency and the shorter natural period. Similarly, the heavier (more mass) of two structures having the same stiffness will have the lower natural frequency and the longer natural period. The qualifier natural is used in defining Tn, ωn, and fn to emphasize the fact that these are natural properties of the system when it is allowed to vibrate freely without any external excitation. Because the system is linear, these vibration properties are independent of the initial displacement and velocity. The natural frequency and period of the various types of structures of interest to us vary over a wide rangeThe natural circular frequency ωn, natural cyclic frequency fn, and natural period Tn defined by Eqscan be expressed in the alternative form

Where, δst = mg/k, and where g is the acceleration due to gravity. This is the static deflection of the mass m suspended from a spring of stiffness k; it can be visualized as the system of oriented in the vertical direction. In the context of the one-story frame of δst is the lateral displacement of the mass due to lateral force mg.
5. Explain in detail about Response spectrum & its Graph
W. Housner was instrumental in the widespread acceptance of the concept of the earthquake response spectrum—initiated by M. A. Biot in 1932—as a practical means of characterizing ground motions and their effects on structures. Now a central concept in earthquake engineering, the response spectrum provides a convenient means to summarize the peak response of all possible linear SDF systems to a particular component of ground motion. It also provides a practical approach to applying the knowledge of structural dynamics to the design of structures and development of lateral force requirements in building codes. A plot of the peak value of a response quantity as a function of the natural vibration period Tn of the system, or a related parameter such as circular frequency ωn or cyclic frequency fn, is called the response spectrum for that quantity. Each such plot is for SDF systems having a fixed damping ratio ζ , and several such plots for different values of ζ are included to cover the range of damping values encountered in actual structures. Whether the peak response is plotted against fn or Tn is a matter of personal preference. We have chosen the latter because engineers prefer to use natural period rather than natural frequency because the period of vibration is a more familiar concept and one that is intuitively appealing. A variety of response spectra can be defined depending on the response quantity that is plotted. Consider the following peak responses:
uo(Tn, ζ) ≡ maxtu(t, Tn, ζ) |
uo(Tn, ζ) ≡ maxt u(t, Tn, ζ)|
uto(Tn, ζ) ≡ maxt ut (t, Tn, ζ)|
The deformation response spectrum is a plot of uo against Tn for fixed ζ . A similar plot for ˙ uo is the relative velocity response spectrum, and for ¨ uto is the acceleration response spectrum.