Structural dynamics
ANS 1 AIM - TO DIFFERENTIATE BETWEEN STATIC ANALYSIS AND DYNAMICS ANALYSIS
STATIC ANALYSIS :-
- In static analysis we analysis we analysis static load means a force that has constant size , position and direction on or withinm a structure
- Study of static load help applied to the determine the max allowable load to be applied to the structure
- In static analysis we use equation of equilibrium for a structure under static loading is F=ku where u is the displacement
- Motion of the structure can be disregaraded
- Static analysis does't change in size , position or in direction
DYNAMIC ANALYSIS :-
- In dynamic analysis we analysis dynamic load means'' a force on a structure that change size , position or direction .
- In dynamic analysis two aaditional forces must be accounted
- Interial force - F=M x A where 'M' is ,mass A' acceleration
- Unlike static loading which remain constant or act in such a mannewr so that there is no substainable varation in structure response with time , dynamics loading vary substantially with time , thus the structural response needs to be calculate at every time.
- Load is variable with time due to fast applying of load and variation
- motion cannot be disregarded.
- Dynamics analysis considered interia force along with dynbamics force
- Where in dynamics forces changes in either size , position or in direction .
Rpre sentation of static and dynamics loads
Dynamic means time varying ,and as the name suggests , the applied loads vary with time and thus induced time varying response .one of the most notable difference in dynamics analysis is the explict consideration of interial force developed in the structure when it is excited by the time varying loads . some of the examples of dynamic load are hammer striking an iron block , a moving truck on a bridge etc .
ANS 2
- Elasticity , ability of a deformed material body to return to its original shape and size when the forces causing the deformation are removed.
- In linear deformation K is constant
- This deformation would be linear at smaller displacement .
- In region AB is inelastic region in that region we apply the load to the substance will deform permanently '' it will not regain it's original shape ''
- The normalized yield strength fy of an inelastic system is defined
- If the normalized yield stength of a system is less than unity , the system will yield and deform into the inelastc range to remain elastic during the ground motion
- PLASTIC DEFORMATION : The material does not return to its original shape when the force is removed
- For stress beyond the elastic limit , a material exhibsts plastic behaviour
- This means the material deforms irrewversible and does not return to its original shape and size , even when the load is removed
- When stess is gradually increased beyond the elastic limit , the material undergoes plastic deformation.
- Plastic behavior occurs when the material completly losit ductilly in the above mentioned graph plastic behavior occurs during unloading after point
- Force displacement relationship become non- linear and inelastic at large deformations
ANS 3 AIM - TO EXPLAIN THE MASS , STIFFNESS AND DAMPING COMPONENTS IN THE EQUATION OF MOTION
The single degree of freedom system can be viewed as a combination of 3 pure independent system
THE STIFFNESS COMPONENTS
- The term stiffness is used in earthquake engineering to designate how well a building will endure large lateral displacement imposed by ground shaking
- Stiffness is ameasure of how much force is required to displace a building by a certain amount .
- The external force on the stiffness components is related to displacement u by FS=ku
- IF the system is linearly elastic
THE DAMPING COMPONENTS :-
- Damping is the dissipation of vibration energy in solid medims and structure over time and distance .
- The frame with its damping property but no stiffness or mass
- The external force on the damping components is related to velocity by FD = CV
THE MASS COMPONENT :-
- The vertical irregularities in structures are stiffness irrequalirty , mass irregular , vertiacal geometric irregularities
- The centre of mass is aposition defined as the average position of all the parts of the systewm , wqeighted according to their masses.
- The external forces F1 on the mass components is related to aaceleratioin by FI = MU
ANS 4 AIM : TO DETERMINE THE RELATIONSHIP BETWEEN NATURAL PERIOD AND NATURAL FREQUENCY
NATURAL PERIOD ( TN ) :-
- The natural vibration of the system is the time required for the undamped system to complete one cycle of free vbibration
- It is related to the natural circular frequency of vibration , wn , in units of radiance per second .
NATURAL FREQUENCY ( f) :-
- The number of cycle executed by system in one second with units in hertz
- Natural vibration properties wn , tn and f dependend only on mass and stiffness of the structure
- - tn , wn , fn depends only on two quantites that is mass and stiffness
- natural frequency and natural time period is inversly proportional toi each other .
- Similar , the heavier of 2 structure one with more mass and if both structure have the same stiffness .
- It is important to remember that earthquake last for few seconds .
- These properties are related to its mass and stifness
- Similar the heavier mass of two structure having the same stifness will have the longer natural period and the lower natural frequency .
ANS 5
Response spectrum analysis is a method to estimate the structural response to short , nondeterministic , transient dyanimic events. Examples of such event are earthquake and shocks . since the exact time history of load is not form , it is difficult to perform a time dependent analysis . The reason spectrum method is based on a special type of mode superposiition .
The text below is separated into three parts:
- the definition of a response spectrum
- Generation of a response spectrum from a given time history
- The use of a given response spectrum in astructural analysis
ANALYSIS OF AN SDOF SYSTEM
Consider a mass - spring - damper system attached to a moving base . The foundartion as agiven movement , the equation of a motion for the mass can , if there are no external forces , ( mu + c ( u-b) + k( U - b ) =0
-
Response spectrum analysis is a method to estimate the structural response to short, nondeterministic, transient dynamic events. Examples of such events are earthquakes and shocks. Since the exact time history of the load is not known, it is difficult to perform a time-dependent analysis. Due to the short length of the event, it cannot be considered as an ergodic ("stationary") process, so a random response approach is not applicable either.
The response spectrum method is based on a special type of mode superposition. The idea is to provide an input that gives a limit to how much an eigenmode having a certain natural frequency and damping can be excited by an event of this type.
The text below is separated into three parts:
- The definition of a response spectrum
- Generation of a response spectrum from a given time history
- The use of a given response spectrum in a structural analysis
In most cases, the engineer performing a response spectrum analysis is presented with a given design response spectrum, in which case the two first parts can be considered as background material.
A response spectrum is a function of frequency or period, showing the peak response of a simple harmonic oscillator that is subjected to a transient event. The response spectrum is a function of the natural frequency of the oscillator and of its damping. Thus, it is not a direct representation of the frequency content of the excitation (as in a Fourier transform), but rather of the effect that the signal has on a postulated system with a single degree of freedom (SDOF).
Analysis of an SDOF System
Consider a mass-spring-damper system attached to a moving base. The foundation has a given movement,
 .
.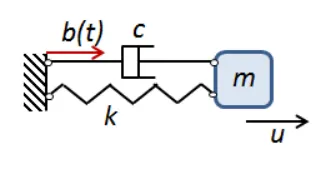
The SDOF system.
The equation of motion for the mass can, if there are no external forces, be written as

Dividing by the mass, and using customary notation,

Here, the undamped natural (angular) frequency is

and the damping ratio is

It can be seen that the support movement acts as a forcing term and that the solution depends only on the two parameters
 and
and  , but not on the individual values of m, c, and k.
Instead of using the absolute displacement as the degree of freedom, it is possible to choose the relative displacement between the mass and the base,
 . This is actually a frame transformation where the oscillator is studied in a coordinate system attached to the base. As in any accelerating frame, there will be inertial forces. The equation of motion can be stated as
 (1)
(1)Thus, the support acceleration appears as a gravity-like load. There are two advantages with this representation:
- The internal forces in the system — that is, elastic and damping forces — depend on relative displacements and velocities. These forces are not affected by a rigid body motion.
- Often, measured data is available in terms of an accelerogram, so that the foundation displacements are not directly available.
For given values of
,, and, this equation can be solved for a sufficiently long time. The displacement, velocity, and acceleration response spectra are defined as the maximum values caused by the acceleration history .


These are all relative spectra. It is possible to do a similar definition of the absolute spectra, by instead using the absolute displacement .
Sometimes, a distinction is made between the positive and negative spectra, so that


and similarly for velocity and acceleration spectra.
The velocity and acceleration response spectra are often approximated by


Such spectra are called pseudovelocity and pseudoacceleration spectra.
For a system without damping, the pseudoacceleration spectrum based on the relative displacement is actually equal to the absolute acceleration spectrum. This can be seen from the undamped equation of motion,

Thus,

The maximum absolute value of the relative displacement must thus occur at the same time as the maximum absolute value of the absolute acceleration. The scale factor between the two is . For systems with low damping, this relation will still be approximately true. Since most mechanical systems have a low damping (often 2% to 5%), it is customary to assume that the spectra for the absolute acceleration and the pseudoacceleration are the same.
Another common way of describing the damping in this context is by the Q factor (quality factor). The relation to the damping ratio is given by

Create a Response Spectrum
- For a certain given time history, , a response spectrum is created in the following way:
- Select a frequency range for which the spectrum should be generated
- Select a frequency step that determines how many points on the response spectrum should be computed
- Select a certain damping ratio,
- For each of the selected frequencies
a. Solve Equation (1) with for a sufficiently long time
b. Keep track of the maximum value of and store it
The equation can be solved by a pure numerical time stepping, but there may be better ways of doing it. If
 is given as a number of points in an accelerogram, then it is natural to assume that the acceleration has a linear variation in time between those points. So, for each interval between two measurements, say from
 to
to , the equation of motion for the oscillator is
Deformation Response Spectrum:-
- Here is the paticular ground motion that is L-centro earthquake.
- The response developed for L-centro earthquake as shown.
- Now, the time variation of the deformation induced in the ground motion in 2 different single degree of freedom system is presented.
- Each single degree of freedom as its own period of vibrations that is Tn=1sec and Tn=2sec. And the damping ratio kept constant.
- Each of the single degre freedom system subjected this earthquake. That is the displacement history that we obtain.
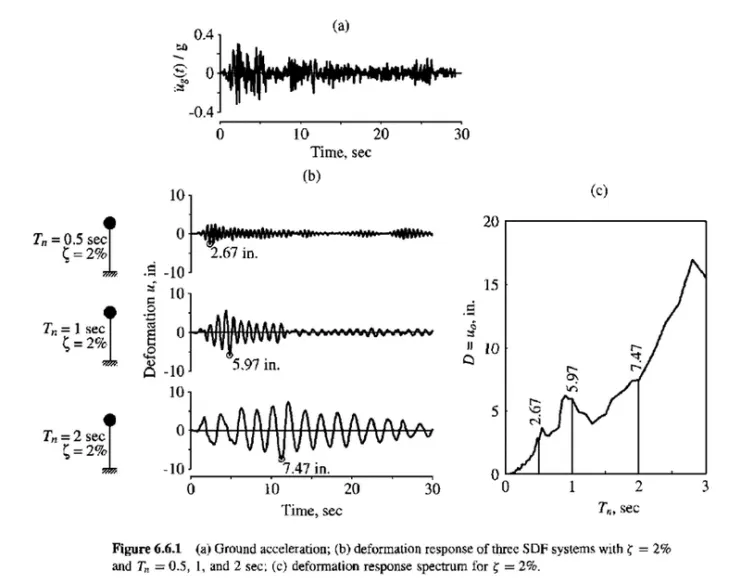
- The First Peak deformation we obtain is 2.67 inch for Tn=0.5sec and Շ = 2%
- Second Peak deformation we obtain is 5.97 inches for Tn=1sec and Շ = 2%
- The third Peak deformation we obtain is 7.47 inches for Tn=2sec and Շ = 2%
- In x-axis, it shows the natural period of vibration and y-axis peak displacement.
- Now, to determine the peak deformation value, repeat the process again and compute displacement for natural period vibration.
- For a range of single degree of freedom system with different period of vibration keep the damping ratio as constant.
- For getting the peak period of vibration that is displacement from the response spectrum curve. That deformation can be multiplied by stiffness to get equivalent static force.
- From there we can do simple structural analysis to obtain the bending moment and shear force in the structure.
Pseudo-Acceleration Response Spectrum:-
- Pseudo acceleration for an single degree od freedom system with naturak frequency ωn is related to its peak deformation D = uo, due to earthquake ground motion: A = (ωn^2) * D = ((2π/Tn)^2) * D.
- The quantity A has units of acceleration and is related to the peak value of base shear Vbo (just another name for the peak value of the equivalent static force fso): Vbo = fso = mA (or) Vbo = (A/g)*ω.
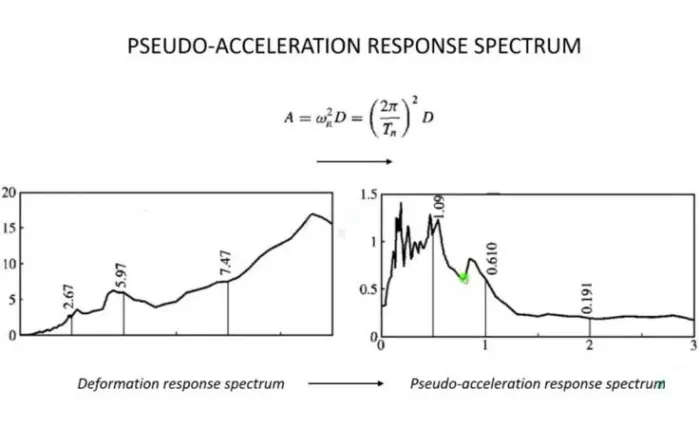
- A(t) is called pseudo acceleration and can be easily obtained by multiplying deformation at each instant of time with ωn^2 = ((2π/Tn)^2).
- Most codes worldwide are force-based values related to peak acceleration are mentioned in the code and those values can be easily multiplied by the mass of the structure to obtain the equivalent static force.
- When equivalent static force is expressed in the form of deformation.
- The stiffness of the system is to be calculated and it can be a laborious task.